The sector level dashboards that cover student characteristics have a provider-level parallel – the access and participation dashboards do not have a regulatory role but are provided as evidence to support institutions develop access and participation plans.
Though much A&P activity is pre-determined – the current system pretty much insists that universities work with schools locally and address stuff highlighted in the national Equality of Outcomes Risk Register (EORR). It’s a cheeky John Blake way of embedding a national agenda into what are meant to be provider level plans (that, technically, unlock the ability to charge fees up to the higher level) but it could also be argued that provider specific work (particularly on participation measures rather than access) has been underexamined.
The A&P dashboards are a way to focus attention on what may end up being institutionally bound problems – the kinds of things that providers can fix, and quickly, rather than the socio-economic learning revolution end of things that requires a radicalised cadre of hardened activists to lead and inspire the proletariat, or something.
We certainly don’t get any detailed mappings between numeric targets declared in individual plans and the data – although my colleague Jim did have a go at that a while ago. Instead this is just the raw information for you to examine, hopefully in an easier to use and speedier fashion than the official version (which requires a user guide, no less)
Fun with indicators
There are four dashboards here, covering most of what OfS presents in the mega-board. Most of what I’ve done examines four year aggregations rather than individual years (though there is a timeseries at provider level), I’ve just opted for the 95 per cent confidence interval to show the significance of indicator values, and there’s a few other minor pieces that I’ve not bothered with or set a sensible default on.
I know that nobody reads this for data dashboard design tips, but for me a series of simpler dashboards are far more useful to the average reader than a single behemoth that can do anything – and the way HESA presents (in the main) very simple tables or plain charts to illustrate variations across the sector represents to me a gold standard for provider level data. OfS is a provider of official statistics, and as such is well aware that section V3.1 of the code of practice requires that:
Statistics, data and explanatory material should be relevant and presented in a clear, unambiguous way that supports and promotes use by all types of users
And I don’t think we are quite there yet with what we have, while the simple release of a series of flat tables might get us closer
If you like it you should have put a confidence interval on it
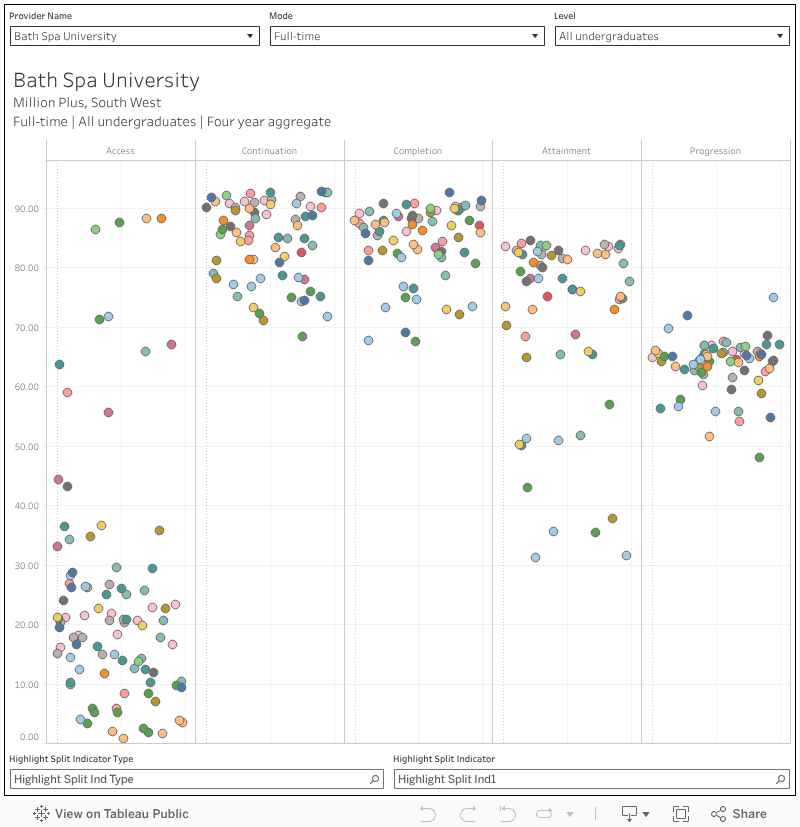
To start with, here is a tool for constructing ranked displays of providers against a single metric – here defined as a life cycle stage (access, continuation, completion, attainment, progression) expressed as a percentage of successful achievements for a given subgroup.
Choose your split indicator type on the top right, and the actual indicator on the top right – select the life cycle stage on the box in the middle, and set mode and level (note certain splits and stages may only be available for certain modes and levels). You can highlight a provider of interest using the box on the bottom right, and also find an overall sector average by searching on “*”. The colours show provider group, and the arrows are upper and lower confidence bounds at the standard 95 per cent level.
You’ll note that some of the indicators show intersections – with versions of multiple indicators shown together. This allows you to look at, say, white students from a more deprived background. The denominator in the tool tip is the number students in that population, not the number of students where data is available.
I’ve also done a version allowing you to look at all single indicators at a provider level – which might help you to spot particular outliers that may need further analysis. Here, each mark is a split indicator (just the useful ones, I’ve omitted stuff like “POLAR quintiles 1,2,4, and 5” which is really only worth bothering with for gap analysis), you can select provider, mode, and level at the top and highlight a split group (eg “Age (broad)”) or split (eg “Mature aged 21 and over”).
Note here that access refers to the proportion of all entrants from a given sub-group, so even though I’ve shown it on the same axis for the sake of space it shows a slightly different thing – the other lifecycle stages relate to a success (be that in continuation, progression or whatever) based on how OfS defines “success”.
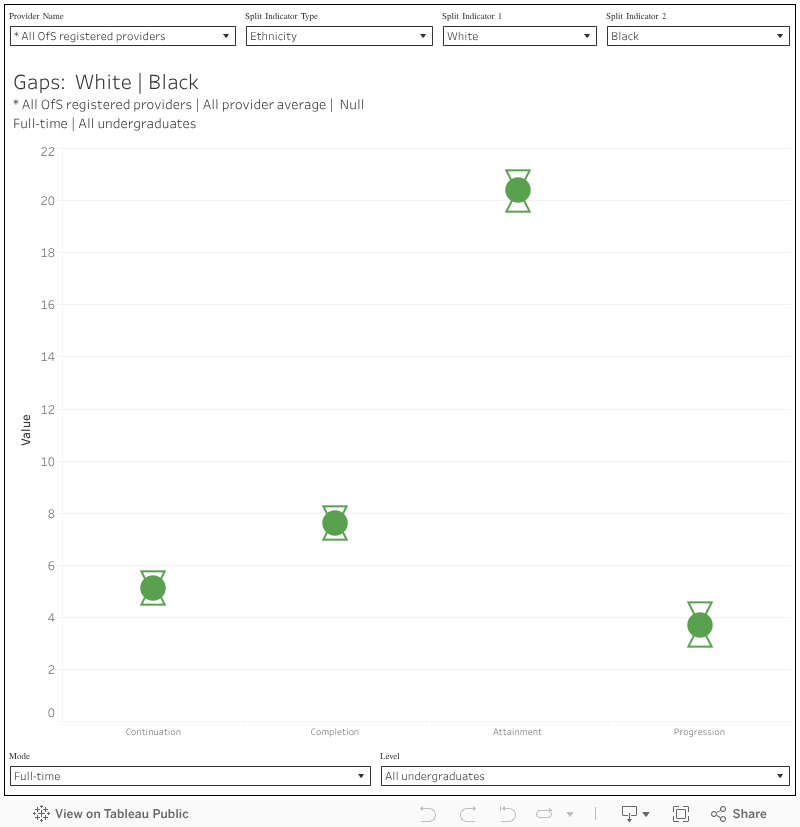
As you’ve probably spotted from the first section, to really get things out of this data you need to compare splits with other relevant splits. We are talking, then, about gaps – on any of the lifecycle stages – between two groups of students. The classic example is the attainment gap between white and Black students, but you can have all kinds of gaps.
This first one is across a single provider, and for the four lifecycle stages (this time, we don’t get access) you can select your indicator type and two indicators to get the gap between them (mode, and level, are at the bottom of the screen). When you set your two split, the largest or most common group tends to be on indicator 1 – that’s just the way the data is designed.
As a quick context you can look for “*” again on the provider name filter to get sector averages, but I’ve also built a sector ranking to help you put your performance in context with similar providers.
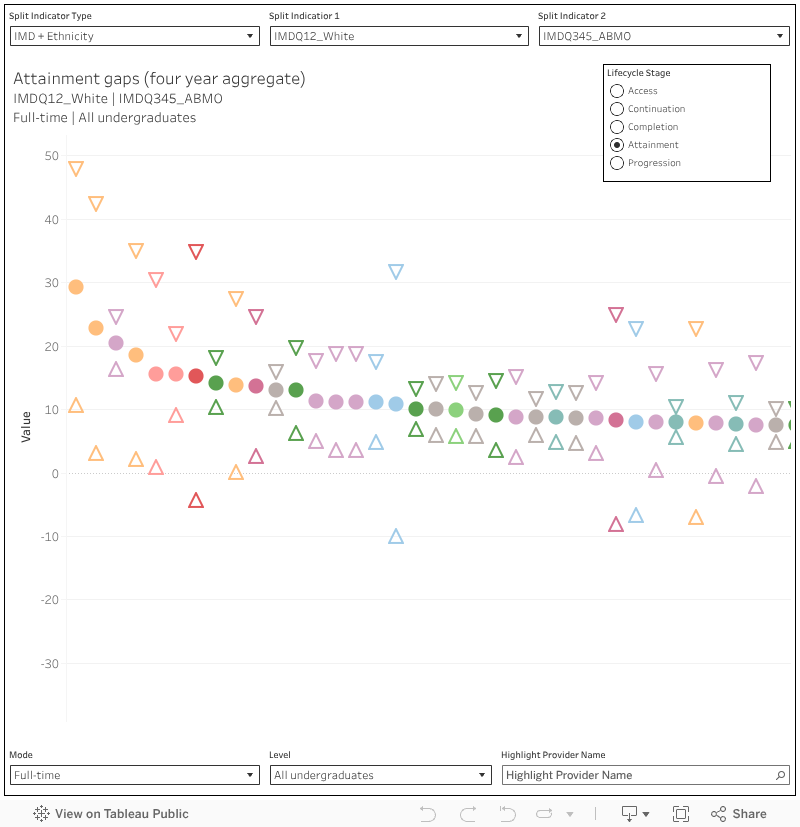
This is like a cross between the single ranking and the provider-level gaps analysis – you just need to set the two splits in the same way.
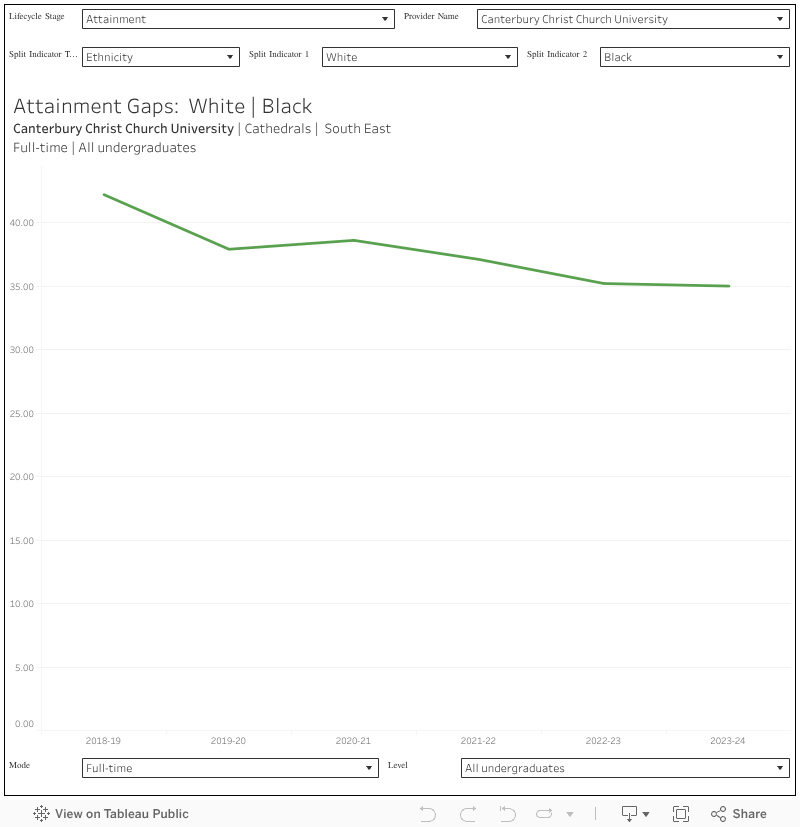
The four year aggregates are handy for most applications, but as you being to drill in you are going to start wondering about individual years – are things getting gradually worse or gradually better? Here I’ve plotted all the individual year data we get – which is, of course, different for each lifecycle stage (because of when data becomes available). This is at a provider level (filter on the top right) and I’ve included confidence intervals at 95 per cent in a lighter colour.
The Office for Students releases a surprisingly large amount of data for a regulator that is supported by a separate “designated data body”.
Some of it is painfully regulatory in nature – the stuff of nightmares for registrars and planning teams that are not diligently pre-preparing versions of the OfS’ bespoke splits in real time (which feels like kind of a burden thing, but never mind).
Other parts of it feel like they might be regulatory, but are actually descriptive. No matter how bad your provider looks on any of the characteristics, or access and participation, indicators it is not these that spark the letter or the knock on the door. But they still speak eloquently about the wider state of the sector, and of particular providers within it.
Despite appearances, it is this descriptive data that is likely to preoccupy ministers and policymakers. It tells us about the changing size and shape of the sector, and of the improvement to life chances it does and does not offer particular groups of students.
Outcomes characteristics
How well do particular groups of students perform against the three standard OfS outcomes measures (continuation, completion, progression) plus another (attainment) that is very much in direct control of individual providers?
It’s a very pertinent question given the government’s HE Reform agenda language on access and participation – and the very best way to answer it is via an OfS data release. Rather than just the traditional student characteristics – age, ethnicity, the various area based measures – we get a range of rarities: household residual income, socioeconomic status, parental higher education experience. And these come alongside greatly expanded data on ethnicity (15 categories) and detail on age.
Even better, as well as comparing full time and part-time students, we can look at the performance of students by detailed (or indeed broad) subject areas – and at a range of levels of study.
We learn that students from better off (residual income at £42,601 or greater) are more likely to progress to a positive outcome – but so are students of nursing. Neither of these at the level of medical students, or distance learning students – but very slightly above Jewish students. The lowest scoring group on progression is currently students taught via subcontractual arrangements – but there are also detriments for students with communication-related disabilities, students from Bangladeshi backgrounds, and students with “other” sexual orientations.
In some cases there are likely explanatory factors and probably intersections – in others it is anyone’s guess. Again and again, we see a positive relationship between parental income or status and doing well at higher education: but it is also very likely that progression across the whole of society would show a similar pattern.
On this chart you can select your lifecycle stage on the top left-hand side, and use the study characteristics drop down to drill into modes of study or subject – there’s also an ability to exclude sub-contractual provision outside of registered provider via the population filter. At the bottom you can set domicile (note that most characteristics are available only for UK students) and level of study (again note that some measures are limited to undergraduates). The characteristics themselves are seen as the individual blobs for each year: mouse over to find similar blobs in other years or use the student characteristic filter or sub-characteristic highlighter to find ones that you want.
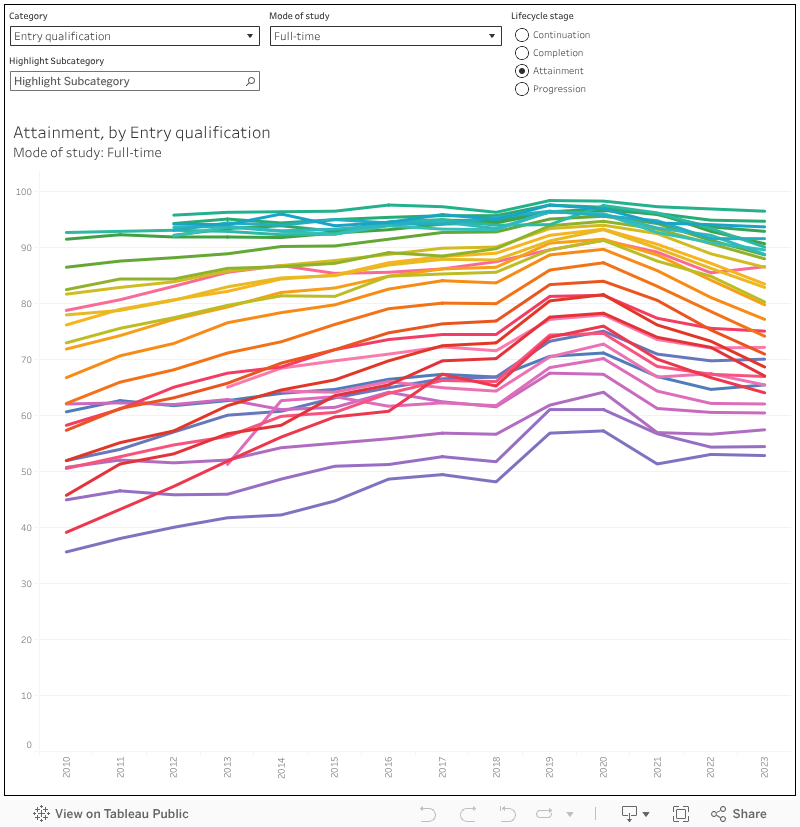
The “attainment” life cycle stage refers to the proportion of undergraduate qualifiers that achieve a first or upper second for their first degree. It’s not something we tend to see outside of the “unexplained first” lens, and it is very interesting to apply the detailed student characteristics to what amounts to awarding rates.
It remains strikingly difficult to achieve a first or upper second while being Black. Only 60 per cent of UK full time first degree students managed this in 2023-24 which compares well to nearer 50 per cent a decade ago, but not so well with the 80 per cent of their white peers. The awarding gap remains stark and persistent.
Deprivation appears to be having a growing impact on continuation – again for UK full time first degree students, the gap between the most (IMD Q1, 83.3 per cent) and least (Q5 93.1 per cent) deprived backgrounds has grown in recent years. And the subject filters add another level of variation – in medicine the different is tiny, but in natural sciences it is very large.
Population characteristics
There are numerators (number of students where data is included) and denominators (number of students with those characteristics) within the outcomes dashboard, but sometimes we just need to get a sense of the makeup of the entire sector – focusing on entrants, qualifiers, or all students.
We learn that nearly 10 per cent of UK first degree students are taught within a subcontractual arrangement – rising to more than 36 per cent in business subjects. Counter-intuitively, the proportion of UK students studying other undergraduate courses (your level 4 and 5 provision) has fallen in previous years – 18 per cent of these students were taught via sub contractual arrangements in 2010, and just 13 per cent (of a far lower total) now. Again, the only rise is in business provision – sub-contractual teaching is offered to nearly a quarter of non-degree undergraduates from UK domiciles there.
More than a third (33.14 per cent) of UK medicine or dentistry undergraduates are from managerial or professional backgrounds, a higher proportion than any other subject area, even though this has declined slightly in recent years.
Two visualisations here – the first shows student characteristics as colours on the bars (use the filter at the top) and allows you to filter what you see by mode or subject area using the filters on the second row. At the bottom you can further filter by level of study, domicile, or population (all, entrants, or qualifiers). The percentages include students where the characteristic is “not applicable” or where there is “no response” – this is different from (but I think clearer than) the OfS presentation.
The second chance puts subject or mode as the colours, and allows you to look at the make up of particular student characteristic groups on this basis. This is a little bit of a hack, so you need to set the sub characteristic as “total” in order to alter the main characteristic group.
Overall, UK undergraduate business students are less likely to continue, complete, attain a good degree, or a positive progression outcome than their peers in any other subject area – and this gap has widened over time. There is now a 1.5 percentage point progression gap between business students and creative or performing arts students: on average a creative degree is more likely to get you into a job or further study than one in business, and this has been the case since 2018.
And there is still a link between level 3 qualifications and positive performance at every point of the higher education life cycle. The data here isn’t perfect – there’s no way to control for the well documented link between better level 3 performance (more As and A*s, less Cs, Ds and BTECs) and socioeconomic status or disadvantage. Seventy two per cent of the best performing BTEC students were awarded a first or upper second, 96 per cent of the best performing A level students.
This is all taken from a specific plot of characteristics (entry qualification and subject) data – unfortunately for us it contains information on those two topic only, and you can’t even cross plot them.
Two key findings documents published alongside this release detail the regulatory observations. The across-the-board decline in continuation appears to have been halted, with an improvement in 2022-23 – but mature entrants are still around 9 percentage points less likely to continue.
We get recognition of the persistent gap in performance at all levels other than progression between women (who tend to do better) and men (who tend to do worse). And of the counterintuitive continuation benefits experienced by disabled students. And we do get a note on the Black attainment gap I noted above.
Again, this isn’t the regulatory action end of OfS’ data operations – so we are unlikely to see investigations or fines related to particularly poor performance on some of these characteristics within individual providers. Findings like these at a sector level suggest problems at a structural rather than institutional level, and as is increasingly being made plain we are not really set up to deal with structural higher education issues in England – indeed, these two reports and millions of rows of data do not even merit a press release.
Back in May, I argued that the UK’s “pace miracle” – the system that produces the youngest, fastest-completing graduates in Europe – is damaging students’ learning and health.
Our system’s efficiency, I suggested, comes at the cost of pressure, exhaustion, and a creeping normalisation of distress.
But what happens when students fall behind in that miracle? What happens when someone breaks the rhythm that the entire funding and regulatory framework assumes to be normal?
For our work with SUs, Mack Marshall and I have been looking in detail at the rules and funding that surround “retrieval”.
From what we can see, UK higher education doesn’t just expect rapid completion – it punishes deviation from it.
When students stumble, the architecture designed to retrieve them from failure taxes disadvantage and rewards privilege.
The illusion of generosity
Pretty much every university we’ve looked at has policies designed to look fair. There is almost always a promise of one reassessment opportunity, and increasingly a public line about not charging resit fees. On paper, that sounds humane – but in practice, the design is economically brutal.
When a student fails a module and resits within the same academic year, the direct cost may be zero. But there’s no maintenance support for any extra study they need to do. And if that student is placed on reassessment-only status for the following year – allowed to resit assessments without attending teaching – they become ineligible for maintenance funding for much, much longer.
That means no support for rent, bills, or food for months. The student who can rely on family help revises in comfort. The student who can’t works full-time through summer and fails again, or drops out entirely.
The sector calls the resit “free” and congratulates itself on removing barriers. But the barrier was never the invoice – it was the maintenance cliff.
This is not a marginal anomaly – it’s the structural product of the same system that glorifies pace. It’s a logic that insists most degrees must be achieved within three years – one that also dictates that recovery from failure must happen outside the funded frame.
To understand what happens to students who fail, students need to navigate a maze of regulations, finance policies, visa rules, and handbooks – each written in its own dialect of compliance.
Students from professional families likely know where to look and what questions to ask. They have the vocabulary, the contacts, the confidence, while first-generation students rarely do. They may well discover “compensation” rules only after exam boards meet, and learn about extenuating circumstances after the deadline passes.
The result is an information economy that mirrors the class system. The retrieval framework may be universal, but its navigation costs are socially distributed.
The poverty penalty v pedagogy
When students pass a module on reassessment, their mark is often capped at the pass threshold – 40 per cent for undergraduates, maybe 50 per cent for postgraduates. The principle sounds rigorous, but the reality is punitive.
A student who failed once because they were caring for a parent, working nights, or suffering mental ill-health can never escape the academic scar tissue unless it’s a complex and approved mit-circs application. The capping rule converts a temporary difficulty into a permanent credential penalty.
It is the same ideology that underpins the pace miracle – a meritocracy of difficulty that romanticises struggle and treats rest as weakness. Only it is encoded in assessment policy rather than culture.
For international students, the same logic takes on a bureaucratic form. Those who fail a single module often face a choice between reassessment-only status – which ends their visa – or repeating with attendance purely to remain sponsored.
Repeating with attendance can cost thousands of pounds in tuition and visa fees. Many have no realistic option but to pay. The system enforces what looks like a market choice – but is in practice compulsion.
The Lifelong Learning Entitlement – fix or mirage
In England at least, the forthcoming Lifelong Learning Entitlement (LLE) ought to usher in flexibility. Funding will finally be linked to credits rather than years. Students will be able to study, pause, and return across their lifetimes. In theory, that should dismantle the rigid three-year cage.
But in practice, everything will depend on how universities classify students, and how they’re allowed to resit. If reassessment-only learners are still coded as “not in attendance”, they still fall outside maintenance entitlement. The policy will have modernised the vocabulary of exclusion without addressing its cause.
And even when students do qualify, the LLE’s promise of proportional maintenance means something subtle but serious – flexibility is offered as additional debt, not as forgiveness. Students who fall behind because of illness or bereavement will borrow more, not owe less.
Unless maintenance is reconceived as a right to recovery rather than a privilege of progression, the LLE risks becoming a faster, more efficient version of the same trap.
Across Europe, completion frameworks are slower and more forgiving. Some countries permit students a decade to complete a bachelor’s degree without financial penalty. Temporary setbacks don’t trigger existential crises – because variations in time are built into the design.
As I referenced here, the HEDOCE project found that students in systems with longer completion horizons are less likely to drop out entirely and more likely to recover from setbacks. Those systems treat time as a pedagogical resource, not an efficiency problem.
In contrast, our compressed model leaves no room for error. Once you stumble, the treadmill doesn’t slow down – it throws you off.
Beyond efficiency
Our systems for “retrieval” are not an isolated bureaucracy. They’re the endpoint of a philosophy – the same one I explored in the “pace miracle” piece. Both the speed and the punishment are symptoms of a culture that prizes output over understanding, and throughput over humanity.
When the system is calibrated around efficiency, every deviation becomes failure, and every failure becomes costly. The student who needs time is framed as wasteful – and the institution that supports them risks financial loss.
I suspect that is why academic pressure now appears so often in mental health reviews. The structure of funding itself generates the anxiety we later medicalise – what looks like individual struggle is really systemic design.
If we genuinely wanted a system that supports learning rather than policing pace, we would start by aligning time, funding, and compassion.
Maintenance support would continue for students on reassessment-only status. Resit marks would reflect achievement, not past misfortune. Compensation and extenuating circumstances policies would be clear, accessible, and generous.
And more profoundly, universities would stop treating recovery as inefficiency. Every student who fails and returns would be evidence of persistence, not profligacy.
In England, the LLE could be a turning point – a framework that finally recognises learning as cyclical and non-linear. Or it could simply re-brand the same cruelty in the language of flexibility.
When I wrote about the UK’s “pace miracle”, I argued that we have built a higher education system that prizes speed and punishes delay – a model that achieves impressive completion rates at the cost of wellbeing, mastery, and fairness.
Our retrieval systems are the mirror image of that miracle. One governs what happens when students move too slowly during the race – the other governs what happens when they fall altogether. Both reveal the same problem – UK HE mistakes motion for progress, and speed for success.
A humane higher education system would not just help students recover from failure – it would stop treating recovery as failure in the first place.
Until then, our miracle of efficiency will continue to hide a quiet cruelty. The students least able to afford failure will remain those the system punishes most heavily – not because they lacked talent or effort, but because we built a structure that makes time itself the privilege they can rarely get a loan for.
This week on the podcast as pro-Palestinian student protests mark the anniversary of October 7, an intervention from Keir Starmer sparks a national debate on campus safety, antisemitism, and free speech.
Plus the Prime Minister is leading a trade delegation to India alongside sector leaders, we explore the growing opportunities in transnational education and ask whether UK universities are ready for a TNE surge – and at Conservative Party Conference, Kemi Badenoch announces plans to slash student numbers and redirect funding.
With Jess Lister, Director (Education) at Public First, Liz Hutchinson, Chief Executive at London Higher, James Coe, Associate Editor at Wonkhe and hosted by Mark Leach, Editor-in-Chief at Wonkhe.
The Sorbonne is undoubtedly one of the most recognised university names in the world. But to what does it refer? Well, there’s a story. Consider this a first instalment – there’s more than I can do justice to in one post.
Let’s go back to twelfth century Paris. The cathedral of Saint Etienne (which was near to what is now Notre Dame) had a school attached. And associated with this cathedral school in 1150 or thereabouts was a collective of teachers and students, organising themselves in the way that medieval teachers and students did. One Lotario de’ Conti di Segni completed his studies there in 1182, and in 1200 King Philip II issued a charter declaring it a universitas. In 1215 Lotario de’ Conti di Segni, who by now was Pope Innocent III, also recognised it.
The university was organised into four faculties: arts, medicine, law and theology. Students had to graduate in the faculty of arts before they could begin study in any of the other faculties. Was this an early example of a foundation course, or was it the first stirrings of the STEAM agenda? Discuss.
The university also had some colleges, like Oxbridge – by 1305 there was the College of the Eighteen, the College of the Sorbonne, and the College of Navarre. The College of the Sorbonne was founded in 1257 by Robert de Sorbon, chaplain to King Louis IX, focusing on theology. Students were also organised into nations, depending on their nationality, and these nations also provided accommodation: nation and college seemed like overlapping concepts.
And for the next few hundred years the university did what universities do, going through ups and downs with good and bad relationships with kings and emperors and popes. A highlight: when the Spanish invaded during the reign of Louis XIV, crossing the Somme and threatening Paris, the university agreed to award the Master of Arts degrees without further ado to any scholar who presented a certificate of service in the King’s army. Academic standards, you see.
And then came 1793, and the mother of all upheavals: the French Revolution. On 15 September the National Convention decreed that education beyond primary level was to be organised differently, and by 1 November the universities were no more.
If this were a TV miniseries, this point is definitely the cliffhanger. What will happen next? Well, a LOT of history happened in the next few years, but for the purpose of this blog, we’ll skip to the start of the next season. Napoleon Bonaparte, in 1806, re-established the University of France with a single faculty. (All staff, I think, were members of this faculty and working in a particular site. But I may be wrong. France is very different, and very confusing. Vive le difference!) And in 1808 expanded this to have five faculties.
And as France had new republics, so it seems that France made tweaks to its university system, of which Paris and the Sorbonne was a part. So in 1870 the number of faculties was again changed, and the types degrees students could get and the curriculum for them. Women were admitted from the 1860s onwards (which is about fifteen years ahead of the UK).
In 1968 France almost had another revolution. Unrest started in universities, as students firstly complained about the failure of the state to provide enough good quality spaces as universities expanded. The protests then expanded to become anti-Vietnam war and generally anti-government protests. Workers joined in – nine million were on strike by 22 May 1968. De Gaulle called a referendum, the striking workers and students burned the Paris Bourse. De Gaulle fled to a military base in Germany, but returned when assured of military support, and slowly the individual strikes were broken up.
By 1970 De Gaulle had increased his majority at a general election, and the government dissolved the University of Paris. It was broken up into thirteen universities – which is why you see places referred to as Paris 3, or Paris 11 and so on. Professors were, it seems, allowed to choose the university they were assigned to. The Sorbonne became Paris IV, which later merged with Paris VI (Pierre and Marie Curie University) to become the Sorbonne University, and also now includes INSEAD.
And this is where the question, to what does the Sorbonne refer, becomes real. In addition to the Sorbonne University (Paris IV and VI), it might mean (if you look at the Wikipedia disambiguation page):
the building which housed the Sorbonne, and is now used by multiple universities
the Sorbonne chapel
the University of Paris up to 1970
the chancellery of the Sorbonne, which administers the Sorbonne estate
Panthéon-Sorbonne University (Paris I)
Sorbonne Nouvelle University
Sorbonne Paris North Université (Paris XIII)
Sorbonne-Assas International Law School (Paris II)
As I say, they do things differently in France. And it is confusing.
The card itself was not sent, but looks to date from the 1910s or 1920s, and is evidently in a biology lab. Here’s a jigsaw of the card – enjoy!
The economics of higher education are tricky. It’s a labour-intensive industry, and generally speaking the cost of producing labour-intensive goods will always increase faster than the price of producing capital intensive goods, because the latter have more scope for increasing productivity. That’s not a problem if you are a public institution in a country with bottomless pockets, or if you are a prestigious private institution with almost unlimited ability to raise prices. If you’re among the other 99 percent of the world’s institution, though, you have to find ways to balance rising costs with new sources of income. But every money-making scheme comes with problems…and costs! So which one to choose?
Today’s guest is Joshua Travis Brown, from Johns Hopkins University’s School of Education. He’s the author of a new book called Capitalizing on College: How Higher Education went From Mission-Driven to Margin-Obsessed, which follows the fortunes of a number of institutions who try out different strategies to try to keep themselves afloat. Some try to double-down on a historic place-based residential mission and charge higher fees; others try to find ways to generate revenue that can cross-subsidize their historic place-based activities. But what’s particularly intriguing about this book is that his subject institutions are all religious institutions. Not only does that mean no core public funding: it means that decisions about how to find new business lines all really have to pass a test of God vs. Mammon.
This really is one of the best higher education books of the year and I was so pleased we could get Josh on the show. I won’t spoil the fun any more: here’s Josh.
The World of Higher Education Podcast Episode 4.6 | Capitalizing on College: Mission, Money, and Survival in Higher Ed with Joshua Travis Brown
Transcript
Alex Usher (AU): Josh, your book is one of my favorite kinds of higher education books—lots of real, if disguised, institutional case studies. I get the impression that what you were trying to do was look at different financial strategies to cope with the phenomenon of ever-rising costs in higher education—Baumol’s disease, basically. How did you choose those eight institutions for your case studies? And why did you focus only on religious institutions, which I thought was a really intriguing choice?
Joshua Travis Brown (JTB): Thanks, Alex. That’s an excellent question to open with. I was looking around at the world, and a lot of what we in higher education base our norms on are the best practices maintained by elite institutions—those that accept only about five to nine percent of applicants. But then there’s the other ninety-one to ninety-five percent of institutions that don’t have those kinds of resources, and their world looks radically different.
One group I focused on are what we call tuition-driven institutions in the American sector. That’s actually a very diverse set of schools that, I’d argue, form the backbone of American higher education—at least in terms of its diversity. These include Hispanic-serving, minority-serving, HBCUs, predominantly Black, religious, women’s, Asian American, vocational, and regional colleges, among others.
Within that really rich and diverse group, the largest by far are the religious colleges and universities in the United States. There are roughly a thousand of them—Protestant, Catholic, some Buddhist, Mormon, Muslim, and Jewish institutions as well. I chose to sample primarily from the Protestant group. And the reason for that choice is that I was interested in behavior, not belief.
The perspective I argue is most valuable is one that looks at behavior that cuts across institutional types, rather than staying within silos and making what I’d call an erroneous assumption that, “This sector operates this way, and that sector operates that way.” I argue instead that everyone is in competition with one another—and to truly understand the sector, you have to look at behavior across all types.
AU: Based on your work at these institutions, you developed a four-part typology with four types of institutions. You call them those following a Traditional Strategy, a Pioneer Strategy, a Network Strategy, and an Accelerated Strategy. How did you come up with those four? Were they in the back of your mind when you selected the cases, or did they emerge organically from the research?
JTB: This is purely grounded theory—straight from the data. What I’m arguing here is that I’m looking within what I call the “missing middle.”
A lot of higher education research tends to focus on what I call the bookends—students on one end, and government or the state on the other. But we don’t do a great job, as researchers, of really diving in to hear the voices of those actually running and leading the institutions.
So as I started to look at the data, pull out themes, and group them into buckets, these four strategies emerged. There was even a fifth one beginning to appear, which I called Accelerated Networks—where the accelerated institution was trying to crack the code to move to the next level of market-oriented behavior. So yes, they surfaced organically from the research.
AU: Let’s talk about that Traditional Strategy. What does it entail? What kind of resources does it take to implement? And how easy is it to, you know, for lack of a better word, win using this strategy?
JTB: The Traditional Strategy is your typical higher education institution that values prestige. They’re constantly looking to the elites.
There’s a whole sector of “little Ivys,” “public Ivys,” and “mini Ivys” that sit just below the Ivy League institutions, and they’re really trying to leap forward into that group. These institutions not only value prestige, but they also operate under the assumption of an in-person education. As one president told me, “You come to a tradition.” He repeated that phrase several times. These institutions rely heavily on building their brand, climbing the rankings, ensuring their athletics are top-notch, and gaining national exposure through sports. They want to become household names.
The problem for traditional institutions—and really, for all institutions—is that the residential, on-campus, in-person model of higher education in the United States operates at a deficit. It must be subsidized.
For the traditional institutions, that subsidy comes primarily from endowments—the spinoff revenue that supports the residential model. And the key takeaway from the book, across all these strategies, is that everyone is trying to subsidize the residential core. What differs is how they do it.
The traditional model depends on philanthropists, wealthy donors, and the prestige that fills their sails. They can call on endowments of two, three, four, five, six, even eight hundred million dollars—and the revenues those spin off—to make their operations sustainable. Or at least, so they think.
AU: Tell us about the second strategy then. You’ve got a Pioneer Strategy. What does that mean—and where do those subsidies come from, if we can put it that way?
JTB: From this point forward in the book, everything turns entrepreneurial. These institutions no longer look to endowments—because they don’t have them. So, for the next six schools in the book, every president is basically saying, “I don’t have an endowment. I need to find margins—and I need to find them somewhere.”
And what they do is turn to students. That’s where they find their margins.
In the Traditional Strategy, as I mentioned earlier, the assumption was that you come to the institution for the tradition—to receive it, to be inculcated into it. The Pioneer Strategy turns that idea on its head. These institutions ask, what if we took the classroom to the students?
That’s the innovation here. Every one of the next strategies has some kind of innovation at its core. In many ways, this book is a story—or a playbook—of innovation. That’s what I hope readers take away: not just the strategies, but the innovative practices themselves.
So, these institutions took classrooms to hotels. They took classrooms to schools and high schools, to shopping malls, to military bases. They went to where the customer was. The classroom became reconceived—portable. And they picked a type.
I take readers through three different types in that chapter, and then show how they replicate it. Whatever region they’re in, what you end up seeing is a giant branch campus model built around that one specific type.
You’ve got multiple sites, but all following the same formula. And all of the revenue—say, a 20% profit margin—from those branch campuses flows back to the core institution. That’s how they rebuild the core.
Over the course of a decade, they can raise anywhere from two hundred to five hundred million dollars—and they use that money to physically transform and rebuild the residential campus.
AU: But all those markets you’re talking about—it’s really just mature students, right? Are there other pioneer markets you can go to besides mature students?
JTB: The principle here is that these institutions were first movers. They were the first movers in adult education at the time.
For readers today—if I’m a leader picking up this book and asking, “What’s the takeaway here?”—I’d say: think badgification, think microcredentials. Think of some new market that’s just about to spin off or is moments away from being spun off.
Anyone who goes all in on that kind of emerging market would be a pioneer institution. They’d be adopting the Pioneer Strategy for that new market—just as these institutions did about a decade ago.
AU: Does it work? I mean, it takes money to make money, right? You’ve got to rent the hotel rooms, pay the professor to go there and teach. It sounds like you have to be extremely margin-conscious—and at a certain point, it’s easy to overshoot, to overcommit to these kinds of things. So how many of the institutions you looked at actually managed to reinforce the residential core?
JTB: They did—but by the time I arrived on campus, the folks in the Traditional bucket were saying, “Oh my gosh, we need a new strategy.”
Meanwhile, the folks at the Pioneer institutions were saying, “Hey, this has worked for about five to seven years, but the competition is so intense it’s eating into our margins. Other institutions are moving into our space. It’s getting really hard to recruit. We need to add a new market.”
And that’s the principle behind the Network Strategy. Rather than having one type, they add multiple types. That’s the big difference between the two: the Pioneer Strategy has one type with multiple sites, while the Network Strategy has multiple types, multiple sites—and it’s global.
AU: Let’s talk now about that Network Strategy. Just as you were finishing there, I think you were saying the difference between the Pioneer and Network strategies is how many new markets you go after. Is it more than that, or is that really the key distinction between the two?
JTB: No, that’s the big difference—because again, what we’re really trying to figure out here is: how are you subsidizing your residential model? It never makes enough money on its own. So where are you finding those margins? And those margins always come from the periphery.
For the Network Strategy, one of the presidents I interviewed described what he called his tabletop strategy for running the institution. He said, “The residential core is the tabletop. All of my peripheral markets—whether online, international, transfer, or adult education—those are the legs. And I’m constantly looking for new legs, new sources of revenue, to support this tabletop.” He went on to say that the tabletop—the residential core—is what gives legitimacy to the entire model. You can’t do this without the tabletop.
And that’s the key difference between the Network Strategy and something like the University of Phoenix. Phoenix was essentially one giant leg. What they lacked—and what people criticized them for—was legitimacy. They didn’t look like a traditional college, and they weren’t serving typical students.
That’s why this book and this perspective are so valuable: when nonprofit institutions start going after the same students or adopting some of the same practices as for-profit institutions like Phoenix, the lines begin to blur. To really understand what’s happening, you have to look across types and sectors—and focus strategically on the behavior itself.
AU: Is that an easier strategy to pull off than the Pioneer one? I mean, it sounds harder to me—but it might also have bigger rewards, since it spreads the risk across different types of markets.
JTB: That’s absolutely key, Alex. One of the presidents I interviewed put it exactly that way. He said, “I’m trying to build a stock portfolio of enrollment. If one sector goes down, I still have another three or four sectors over here, so a drop in one leg isn’t going to sink the ship.” What they were striving for was balance. But both institutions, in their enthusiasm for adding new legs, made a critical mistake—they actually ended up creating a second tabletop.
They either absorbed another institution or built a massive campus overseas—in one case, in Asia. And instead of funneling all of their margins back to the residential core, they had to start directing them to these peripheries, to that second tabletop.
It became really complex. Morale declined. And by the time I arrived on campus, they were looking for a new kind of market—something they could take to scale. And that’s what the next school managed to crack.
AU: Let’s talk about that last strategy—the one you call the Accelerated Strategy. It’s an amazing case study, especially because it’s a religious institution. As you put it, it’s where God and Mammon really start to duke it out.
This is an institution that seems to have crossed the line from being merely margin-conscious to acting like a full-on for-profit college. And that’s wild for a faith-based organization. Tell us about this institution—and how going down this route changes a university.
JTB: You know, what’s crazy is that I changed all the names of the actual schools in the book—but when a school named its competitors, I left those in.
So as I’m interviewing the leaders at the accelerated institution, they’re saying, “Hey, we’re like ASU. We’re like Penn State. We’re like the Maryland system. We’re like Western Governors, UCF, Florida, Southern New Hampshire University.” And they viewed that entire group of schools as their competitors. The way they took their model to scale was through process and product innovation.
I was sitting across from the provost, and he told me, “I had a vision. I pictured an old country store. Down one side of the store was one product, and down the other side was another product—and that’s all we had to sell.” Those two products were an MBA and an interdisciplinary studies degree. At that time, if you wanted to earn a degree online from this institution, those were your only two options. But then he had this transformative idea. Over the course of a single summer, he took roughly 35 to 80 residential courses and converted them for online delivery. Within three to six months, that old store suddenly had 35 different products on the shelves.
And here’s the key innovation: everyone else at the time was selling online classes. This institution became one of the first—outside of Phoenix—to sell online degrees. They fundamentally shifted the product, and that move blew up their market. Virtually overnight, they went from 8% to 42% growth.
AU: Wow. But surely it changed the culture of the campus?
JTB: It did. People talked about the tension between the residential and online sides of the institution. The student population ballooned so dramatically that it went from being majority residential to, essentially, for every ten online students, there was one residential student. It radically transformed the institution. They were able to hold costs flat.
Now, the other entrepreneurial schools I studied were funneling their margins back into overhauling the residential campus. That’s what I call margin capitalization. Instead of looking for donors or venture capitalists, they turned to students.
This particular school made so much money—just north of two hundred million dollars a year—that they were not only able to completely rebuild their campus, but also to put hundreds of millions into their endowment.
What this institution effectively invented is a new form of philanthropy that I call margin philanthropy. Instead of relying on alumni—graduates who go out into the world and eventually give back—you’re leveraging the loans of students who are currently enrolled. They become your new philanthropists.
The risk of construction and the growth of the endowment aren’t borne by the institution anymore; they’re borne by the students themselves—who walk away with a degree in one hand and a student loan, anywhere from fifty to a hundred thousand dollars, in the other.
AU: The problem of ever-rising costs—Baumol’s disease, basically—is one that plagues every educational institution. Only by spending more money every year can you hope to stay in place. But achieving that means raising more money every year.
And I read your book as being fairly pessimistic about any institution’s ability to sustain that in the long run. Right? You can have all the strategies you want to increase revenue, but they all require hiring more staff, becoming more complicated—and then Baumol just reappears further down the line. Is that a fair summation? Do you think one of these strategies is actually more promising than the others? Or does Baumol’s law come for all of us eventually, no matter what?
JTB: I think one of the big takeaways from the book is that this sector is constantly marching upward in its market behavior.
When I arrived on these campuses, everyone was saying, “We’ve got to sustain. We need more. We need more revenue. We need more margins.”
Now, while Baumol, as an economist, has one way of looking at the world, I don’t think it’s entirely accurate. He was, after all, an economist from several generations ago. What’s spun out of economics since then is the field of strategy and management, which focuses more on the agency of actors within organizations.
Those working in strategy and management began to explore that agency—to explain the world in a more nuanced way. And that’s where this book differs from Baumol’s framework: it’s grounded in organizational theory, strategy, and management.
What you end up seeing—and what the book focuses on—is this: we often hear about public policies, particularly from the Federal Reserve in the U.S., that are based on the idea that if you increase competition and give students choice, the natural outcome will be higher quality. As institutions compete, quality should improve—at least in theory.
But what this book shows is that when you incentivize students to be more self-interested and to make market-based choices, you also incentivize institutions to be more self-interested.
That’s why we see institutions going after student loans and seeking margins from students—they’re also operating in a highly competitive market.
So, what this book illustrates are the trade-offs between mission and money that college leaders are forced to make when we choose to design a national education system based on market principles of competition. And that, I’d contend, is a challenge much bigger than Baumol himself.
AU: You’ve focused obviously on one group, the non–research-intensive private institutions, and a particular sub-sector within that. How much can you generalize from this book to other types of institutions—secular ones or public ones?
JTB: That’s a great question. The reason I narrowed the focus so tightly is that, in case studies, what you want to do is control for noise. So rather than mixing all types of tuition-driven institutions together, I chose one type and looked at the behavior across those cases.
But I would contend that because I’m really examining a single phenomenon—tuition—and specifically two questions: how do students get their money, and what do institutions do with it?—this framework is broadly applicable. And honestly, in the last six months especially, I think everyone is becoming tuition-driven.
We’re seeing decreases in research funding revenues, decreases in endowment revenues because of higher taxes. This morning’s headline from the Secretary of Commerce said they want to go after 50% of all patent revenue. And just yesterday, it was announced that all MSI funding would be decreased. The only stable thing left is tuition revenue.
What Capitalizing on College offers is a roadmap for how these institutions managed to survive in a highly competitive environment—and now everyone is entering that same space. So yes, I believe it’s highly generalizable, because this is the roadmap forward. This is the environment we’re heading into.
AU: Joshua Travis Brown, thank you so much for joining us today.
JTB: Thanks. A pleasure being here.
AU: And that just leaves me to thank our excellent producers, Sam Pufek and Tiffany MacLennan—and of course, you, our listeners and readers, for joining us.
If you have any comments or questions about today’s podcast, or suggestions for future episodes, please don’t hesitate to get in touch at [email protected].
Join us next week when our guest will be Luiz Augusto Campos, professor of sociology and political science at the Instituto de Estudos Sociais e Políticos at the State University of Rio de Janeiro. He’s the co-author of a new book on the effects of racial quotas in Brazilian universities. Join us next week. Bye for now.
*This podcast transcript was generated using an AI transcription service with limited editing. Please forgive any errors made through this service.Please note, the views and opinions expressed in each episode are those of the individual contributors, and do not necessarily reflect those of the podcast host and team, or our sponsors.
Although the Next Generation Science Standards (NGSS) were released more than a decade ago, adoption of them varies widely in California. I have been to districts that have taken the standards and run with them, but others have been slow to get off the ground with NGSS–even 12 years after their release. In some cases, this is due to a lack of funding, a lack of staffing, or even administrators’ lack of understanding of the active, student-driven pedagogies championed by the NGSS.
Another potential challenge to implementing NGSS with fidelity comes from teachers’ and administrators’ epistemological beliefs–simply put, their beliefs about how people learn. Teachers bring so much of themselves to the classroom, and that means teaching in a way they think is going to help their students learn. So, it’s understandable that teachers who have found success with traditional lecture-based methods may be reluctant to embrace an inquiry-based approach. It also makes sense that administrators who are former teachers will expect classrooms to look the same as when they were teaching, which may mean students sitting in rows, facing the front, writing down notes.
Based on my experience as both a science educator and an administrator, here are some strategies for encouraging both teachers and administrators to embrace the NGSS.
For teachers: Shift expectations and embrace ‘organized chaos’
A helpful first step is to approach the NGSS not as a set of standards, but rather a set of performance expectations. Those expectations include all three dimensions of science learning: disciplinary core ideas (DCIs), science and engineering practices (SEPs), and cross-cutting concepts (CCCs). The DCIs reflect the things that students know, the SEPs reflect what students are doing, and the CCCs reflect how students think. This three-dimensional approach sets the stage for a more active, engaged learning environment where students construct their own understanding of science content knowledge.
To meet expectations laid out in the NGSS, teachers can start by modifying existing “recipe labs” to a more inquiry-based model that emphasizes student construction of knowledge. Resources like the NGSS-aligned digital curriculum from Kognity can simplify classroom implementation by providing a digital curriculum that empowers teachers with options for personalized instruction. Additionally, the Wonder of Science can help teachers integrate real-life phenomena into their NGSS-aligned labs to help provide students with real-life contexts to help build an understanding of scientific concepts related to. Lastly, Inquiry Hub offers open-source full-year curricula that can also aid teachers with refining their labs, classroom activities, and assessments.
For these updated labs to serve their purpose, teachers will need to reframe classroom management expectations to focus on student engagement and discussion. This may mean embracing what I call “organized chaos.” Over time, teachers will build a sense of efficacy through small successes, whether that’s spotting a studentconstructing their own knowledge or documenting an increased depth of knowledge in an entire class. The objective is to build on student understanding across the entire classroom, which teachers can do with much more confidence if they know that their administrators support them.
For administrators: Rethink evaluations and offer support
Arecent survey found that 59 percent of administrators in California, where I work, understood how to support teachers with implementing the NGSS. Despite this, some administrators may need to recalibrate their expectations of what they’ll see when they observe classrooms. What they might see is organized chaos happening: students out of their seats, students talking, students engaged in all different sorts of activities. This is what NGSS-aligned learning looks like.
To provide a clear focus on student-centered learning indicators, they can revise observation rubrics to align with NGSS, or make their lives easier and use this one. As administrators track their teachers’ NGSS implementation, it helps to monitor their confidence levels. There will always be early implementers who take something new and run with it, and these educators can be inspiring models for those who are less eager to change.
The overall goal for administrators is to make classrooms safe spaces for experimentation and growth. The more administrators understand about the NGSS, the better they can support teachers in implementing it. They may not know all the details of the DCIs, SEPs, and CCCs, but they must accept that the NGSS require students to be more active, with the teacher acting as more of a facilitator and guide, rather than the keeper of all the knowledge.
Based on my experience in both teaching and administration roles, I can say that constructivist science classrooms may look and sound different–with more student talk, more questioning, and more chaos. By understanding these differences and supporting teachers through this transition, administrators ensure that all California students develop the deeper scientific thinking that NGSS was designed to foster.
Nancy Nasr, Ed.D., Santa Paula Unified School District
Nancy Nasr is a science educator and administrator at Santa Paula Unified School District. She can be reached at [email protected].
Latest posts by eSchool Media Contributors (see all)
This week marks World Space Week, an international celebration of humankind’s last frontier launched by the United Nations in 1999. In more than 80 countries, people are celebrating through thousands of events.
One of the goals of space week is to let people know how many of the products we depend on down on earth came out of space exploration programs: Life support systems for miners, memory foam mattresses, scratch-resistant lenses, nutritional supplements, cordless tools and freeze-dried food.
Learning about outer space and space exploration excites young people and attracts them to science, technology, engineering and math fields.
But for News Decoder, it is the international cooperation we see in space exploration programs that excites us. When we look to the moon, our galaxy and beyond, we see the possibility for peace and cooperation here on Earth.
To celebrate World Space Week, check out some of the stories we’ve published about outer space and the people exploring it.
This audio is auto-generated. Please let us know if you have feedback.
The Senate confirmed Kimberly Richey as the next assistant secretary for civil rights at the U.S. Department of Education in a 51-47 vote along party lines late Tuesday afternoon. The approval came as part of a resolution allowing senators to consider for confirmation Richey and over 100 other federal nominees at once.
Richey served as acting assistant secretary at the Education Department under the first Trump administration — first for the Office of Special Education and Rehabilitative Services and then for the Office for Civil Rights — and also worked at OCR under the George W. Bush administration.
Her approval had been nothing short of expected, considering the slight Republican majority in the Senate and President Donald Trump’s nomination in February to head the Education Department’s civil rights arm.
As assistant secretary of OCR, Richey will be responsible for overseeing investigations into alleged civil rights complaints, protecting all students’ civil rights, and drafting and implementing civil rights regulations, including but not limited to Title IX, Title VI and Section 504.
She was confirmed to steer a ship that is functioning at half of its previous capacity, with OCR down to five out of 12 of its offices. She faces a backlog of over 12,000 open investigations and more than 25,000 complaints, and a pared down staff as a result of Trump and U.S. Education Secretary Linda McMahon’s efforts to wind down the department.
She’s also entering the office as the Education Department is embroiled in a lawsuit that, until recently, required OCR be restored to its previous capacity by returning laid off workers to their jobs. Just as the Education Department began returning OCR staffers back to the job in waves, the federal district court order requiring its restoration was overturned in September by the 1st U.S. Circuit Court of Appeals.
The Education Department, most of whose staff is furloughed as part of the government shutdown, has not responded to K-12 Dive’s requests about what that means for the over 80 staffers who had already returned to their old posts.
Before the Senate’s Health, Education Labor and Pensions Committee confirmed Richey’s nomination in June, Sen. Patty Murray, D-Wash., shared that attorneys at OCR are juggling on average 115 cases, more than double the previously reported caseload of 42 cases per person.
Richey said she would “always advocate for OCR to have the resources to do its job.” However, she dodged questions about whether OCR, under Trump’s first administration, had enough resources to do its job.
“I’m going to have to be really strategic if I’m confirmed, stepping into this role, helping come up with a plan where we can address these challenges,” she said about OCR’s reduced resources under the current administration.
Among her first steps, Richey said, would be to evaluate the current caseload and determine where complaints stand in their investigative timelines. She would also examine the staff distribution and organizational structure of OCR, she said.
Richey said that rather than put certain investigations on pause, as has been the case under the second Trump administration, she would prioritize all complaints that fall at OCR’s footsteps.
After the mass layoffs at the agency that left OCR gutted along with other department offices, the Education Department told K-12 Dive in March that OCR was undergoing organizational changes and said it would deliver on its statutory responsibilities.
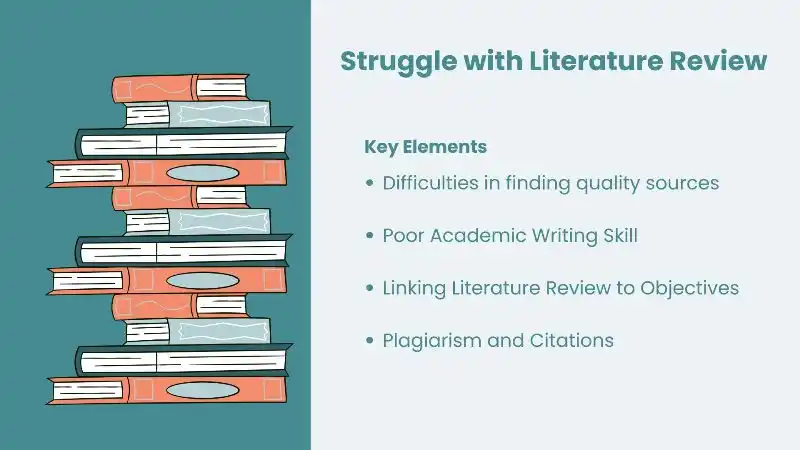
Understanding the Topic: Even before starting to write a student should be having a full clarity about the research title, the objective of the study and the research problems.
Searching for Relevant Literature: Students should search the academic libraries like Google Scholars, Research Gate, JSTOR or Scopus.
Evaluating Sources: Once relevant sources are collected students should analyze, evaluate the objective, findings and limitation of those studies.
Grouping of Literature: Collected literature should be grouped as per the subheading of the required studies.
Write Critically: Literature review should be written critically and analytically relevant to the study .
Identify the Research Gap: Students should analyze and find the research gap and specify where his study will add value to those gaps.
Cite & Reference: Students should use formats like APA (7th edition) or Havard Referencing style while using in text citing.