The University of Michigan hired dozens of private investigators to go undercover on campus and surveil pro-Palestinian student protesters,The Guardian reported Friday.
Some of the investigators, who work for a Detroit-based security firm, were caught on camera trailing, recording and harassing students; one reportedly drove a car at one student, who had to jump out of the way.
“It’s so insane that they have spent millions of dollars to hire some goons to follow campus activists around,” one student who’d been followed by agents told The Guardian. “It’s just such a waste of money and time.”
A spokesperson for the university did not deny hiring the investigators in responses to The Guardian’s questions and defended “security measures” as essential to “maintaining a safe and secure campus environment.”
Through this work, and in collaboration with international partners, we have identified what genuinely supports inclusion and what simply pays lip service to it. While AI is often heralded as a tool for levelling the educational playing field, our research shows that without intentional support structures and inclusive design, it can reinforce and even widen existing disparities.
Supporting mature students’ AI literacy is, therefore, not just a pedagogical responsibility; it is an ethical imperative. It intersects with wider goals of equity, social justice, and sustainable digital inclusion. If higher education is to fulfil its mission in an age of intelligent technologies, it must ensure that no learner is left behind, especially those whose voices have long been marginalised.
Why Mature Students Matter in the AI Conversation
Mature students are one of the fastest-growing and most diverse populations in higher education. They bring a wealth of life and work experience, resilience, and motivation. Yet, they are often excluded from AI-related initiatives that presume a level of digital fluency not all possess. However, they are often left out of AI-related initiatives, which too frequently assume a baseline level of digital fluency that many do not possess. Media portrayals tend to depict older learners as technologically resistant or digitally inept, reinforcing deficit narratives that erode confidence, undermine self-efficacy, and reduce participation.
As a result, mature students face a dual barrier: the second-order digital divide—inequity in digital skills rather than access—and the social stigma of digital incompetence. Both obstruct their academic progress and diminish their employability in a rapidly evolving, AI-driven labour market.
Principles that Support Mature Learners
The QAA-funded project, developed in partnership with five universities across the UK and Europe, embedded AI literacy through three key principles—each critical for mature learners:
Accessibility
Learning activities were designed for varying levels of digital experience. Resources were provided in multiple formats (text, video, audio), and sessions used plain language and culturally inclusive examples. Mature students often benefited from slower-paced, repeatable guidance and multilingual scaffolding.
Collaboration
Peer mentoring was a powerful tool for mature students, who often expressed apprehension toward younger, digitally native peers. By fostering intergenerational support networks and collaborative projects, we helped reduce isolation and build mutual respect.
Personalised Learning
Mature students frequently cited the need for AI integration that respected their goals, schedules, and learning styles. Our approach allowed learners to set their own pace, choose relevant tools, and receive tailored feedback, building ownership and confidence in their digital journeys.
Inclusive AI Strategies That Work – Based on What Mature Learners Told Us
Here are four practical strategies that emerged from our multi-site studies and international collaborations:
1. Start with Purpose: Show AI’s Relevance to Career and Life
Mature learners engage best when AI tools solve problems that matter to them. In our QAA project, students used ChatGPT to refine job applications, generate reflective statements, and translate workplace policies into plain English. These tools became career companions—not just academic add-ons.
‘When I saw what it could do for my CV, I felt I could finally compete again,’ shared a 58-year-old participant.
2. Design Age-Safe Learning Spaces
Many mature students fear embarrassment in digital settings. We created small, trust-based peer groups, offered print-friendly guides, and used asynchronous recordings to accommodate different learning paces. These scaffolds helped dismantle the shame often attached to asking for help.
3. Make Reflection Central to AI Literacy
AI use can be empowering or alienating. We asked students to record short video reflections on how AI shaped their thinking. This helped them develop critical awareness of what the tool does, how it aligns with academic integrity, and what learning still needs to happen beyond automation.
4. Use Media Critique to Break Stereotypes
Drawing on my research into late-life workers and digital media, we used ageist headlines, adverts, and memes as classroom material. Mature learners engaged critically with how society depicts them, transforming deficit narratives into dialogue, and boosting confidence through awareness.
How We Measured Impact (and Why It Mattered)
We evaluated these strategies using mixed methods informed by both academic and lived-experience perspectives:
Self-reflective journals and confidence scales tracked growth in AI confidence and self-efficacy
Survey data from mature students (aged 55+) in the UK and Albania (from my older learners study) revealed the key role of peer support, professional experience, and family encouragement in shaping digital resilience
Narrative mapping, developed with COST DigiNet partners, was used to document shifts in learners’ digital identity—from anxious adopter to confident contributor
Follow-up interviews three months post-intervention showed sustained engagement with AI tools in personal and professional contexts (e.g., CPD portfolios, policy briefs)
Policy and Practice: Repositioning Mature Learners in AI Strategy
As highlighted in our Tirana Policy Workshop (2024), national and institutional policy often fails to differentiate between age-based needs when deploying AI in education. Mature students frequently face a “second-order digital divide,” not just in access, but in relevance, scaffolding, and self-belief.
If UK higher education is serious about digital equity, it must:
Recognise mature learners as a distinct group in AI strategy and training
Fund co-designed AI literacy programmes that reflect lived experience
Embed inclusive, intergenerational pedagogy in curriculum development
Disrupt media and policy narratives that equate older age with technological incompetence
Conclusion: Inclusion in AI Isn’t Optional – It’s Foundational
Mature learners are not a marginal group to be retrofitted into digital learning. They are core to what a sustainable, equitable, and ethical higher education system should look like in an AI-driven future. Designing for them is not just good inclusion practice—it’s sound educational leadership. If we want AI to serve all learners, we must design with all learners in mind, from the very start.
Belonging and mattering are crucial for creating educational environments where learners feel connected to their department and classmates (Hale et al., 2019). Student success has become a major outcome measure for many academic units(Accreditation Council for Occupational Therapy Education, 2005 and Commission on Accreditation in Physical Therapy Education, 2025). Researchers have found that learners’ sense of belonging enhances psychological flexibility, learner satisfaction, motivation, and professional identity, thereby increasing student success (Carter et al., 2023 and Tejero-Vidal et al., 2025). Measuring a learner’s perception of belonging can be challenging for educators. To support this effort, a social-ecological model has been developed to conceptualize the different layers that contribute to a learner’s sense of belonging(Johnson, 2022). The Departmental Sense of Belonging (DeSBI) tool specifically measures this sense within the context of department and peer relationships(Knekta et al., 2020).
I explored how an increased involvement in the belonging social-ecological model was associated with learners’ sense of belonging within their department. The goal was to help departments refine their model to enhance learners’ connection to faculty and peers, thereby increasing learners’ success. The hypothesis was that higher interactions in the social-ecological model would correlate with a higher sense of belonging. Sixty-eight learners from three allied health programs completed the survey, which found the results a statistically significant association between the learner’s involvement in the belonging social ecological model and a learner’s sense of belonging to a department.
Practical Application of the Belonging Social-Ecological Model
The study underscores the pivotal role of departmental culture and environment in shaping a learner’s sense of belonging. This is an essential consideration for departments when evaluating the factors provided to learners at each level of the belonging social ecological model.
Intrapersonal Level
Activities within the interpersonal level are journaling, professional development, and mental health practices. It is crucial for faculty to consider encouraging learners to journal at the end of a class session or to include journaling as a graded activity within their course. Supporting learners in building these habits helps foster psychological flexibility and self-awareness. This approach can also provide an opportunity strengthen the therapeutic alliance between individual faculty.
Interpersonal Level
Activities within this level include meals with classmates and faculty, physical activities, and social gatherings. Faculty should strongly consider whether their academic space provides the area for learners to study and have meals together. If your department lacks such space, advocating for one in or near your department should be a priority. If your academic unit has the gathering space, it will be important for faculty to evaluate if it will attract learners to use it effectively, or if learners will avoid the areas because of its set-up and location. Ensuring a dedicated space is not only available but actively used is a critical step for faculty when evaluating their effectiveness in fostering a sense of belonging within the department.
Additionally, faculty should encourage learners to spearhead the organization of social events outside the department so to strengthen connections between one another. With mentorship and engagement from faculty, learners will be empowered to create inclusive events that help all feel welcome.
Institutional Level
The institutional level considers what activities are offered by the university to the learners. Every university, regardless of its size, hosts various events each week for its learners. It is crucial for faculty to consider how their learners are engaging with university announcements about these events. Faculty should consider how the department reinforces these activities on its own announcement board. Should faculty hang signs near the department, or employ other creative strategies to ensure learners are fully informed about campus activities?
Community and Societal Level
The social ecological model is the community and society encompasses activities that extend beyond campus and occur within the community and at the society level. Each university is an integral part of the community in which it is located. Therefore, it is important for faculty to consider how learners are kept informed about the events occurring within the community they live. Ensuring the department highlights events, beyond the favorite coffee shop, restaurant, or activity spot, is crucial for fostering a sense of belonging. Considering each community offers unique experiences, making sure learners are aware of these activities is important. By combining the dissemination of institution activities with community events, faculty can address two domains with one strategic plan.
Physical and Virtual Space
Physical and virtual spaces are in the outer most layer in this social-ecological model and include the structure of class breaks, classroom setup, and online activities. Faculty should consider how physical and virtual learning environments impact social connections. For example, it is important for faculty to thoughtfully consider how breaks are structured – not just when they are given. Encouraging learners to leave the room for a short walk outside with peers, play a quick game of four-square, or throw a frisbee is beneficial, as it promotes learners to be active shift their mindset, and foster conversations beyond classroom content.
A final consideration involves the layout of the classroom. Is the classroom arranged traditionally with everyone facing forward, or can it be reorganized into pods or small groups, which will facilitate discussion during group projects? If the goal is to engage the entire room, can the seating be arranged into a large circle to allow learners to see each other’s body language while speaking? These small yet significant environmental factors can impact the learning environment and the sense of belonging for each learner in the room.
Conclusion
Increased engagement across all layers of the belonging social-ecological model significantly enhances the learners’ sense of connection and inclusion. This sense of belonging is not a peripheral benefit – it is foundational to learner motivation, participation, and overall success. Faculty play a key role in implementing thoughtful strategies that promote belonging at every level of the belonging social ecological model. In doing so, they help create a dynamic and inclusive learning community where every learner can thrive – leading to greater success and personal fulfillment in their learners’ academic journey.
Dustin Cox, PT, DPT, PhD, is an Associate Professor at Augusta University and a licensed physical therapist with advanced certifications in therapeutic treatment for Parkinson’s and lymphedema. He received his Doctor of Physical Therapy in 2011 and his Ph.D. in Health Sciences in 2023 from Northern Illinois University. Since 2016, Dustin has been dedicated to helping learners achieve their goals in becoming effective healthcare practitioners. Currently, Dustin teaches in a DPT program and clinically works with clients that are in the pediatric stage of life and clients with bleeding disorders.
Carter, B. M., Sumpter, D. F., and Thruston, W. (2023). Overcoming Marginalization by Creating a Sense of Belonging. Creative nursing, 29(4), 320–327. https://doi.org/10.1177/10784535231216464
Hale, A. J., Ricotta, D. N., Freed, J., Smith, C. C., and Huang, G. C. (2019). Adapting Maslow’s Hierarchy of Needs as a Framework for Resident Wellness. Teaching and learning in medicine, 31(1), 109–118. https://doi.org/10.1080/10401334.2018.1456928
Johnson, Royel. (2022). A socio-ecological perspective on sense of belonging among racially/ethnically minoritized college students: Implications for equity-minded practice and policy. New Directions for Higher Education, Spring 2022, pages 59 – 68. https://doi.org/10.1002/he.20427
Knekta, E., Chatzikyriakidou, K., and McCartney, M. (2020). Evaluation of a Questionnaire Measuring University Students’ Sense of Belonging to and Involvement in a Biology Department. CBE life sciences education, 19(3), ar27. https://doi.org/10.1187/cbe.19-09-0166
Tejero-Vidal, L. L., Pedregosa-Fauste, S., Majó-Rossell, A., García-Díaz, F., and Martínez-Rodríguez, L. (2025). Building nursing students’ professional identity through the ‘Design process’ methodology: A qualitative study. Nurse education in practice, 83, 104256. https://doi.org/10.1016/j.nepr.2025.104256
Blue-sky research is the basis for the successful development of future technologies. The evidence that UK universities are global leaders in this is clear – the Australian Strategic Policy Institute (ASPI) ranks the UK university system as third in the world on this basis.
Yet it has often been said the UK has not capitalised enough on its world-leading research to drive economic growth. Now though, the UK has, at last, a coherent and comprehensive industrial strategy that can realise the huge potential of this global advantage.
Previous industrial strategies identified some of the right industries, but the new strategy has a far more comprehensive approach. It recognises the breadth of sectors that are likely to be at the forefront of global technology-led growth, not just the fashionable few like AI or pharmaceuticals. Crucially, place has now taken a central role. A myriad of global growth “hot spots” show us that this is key to understanding the detailed collaborations that will deliver growth in different UK regions, cities and innovation districts.
In that sense this industrial strategy is the welcome and long needed economic policy that the UK economy has been lacking. Universities and their research are an essential core component, but all stakeholders across higher education, industry and government need to engage in a step-change in joined-up working if the UK is to translate the real advantage its research system has into a new level of growth and prosperity. There will need to be effective partnerships and collective momentum between universities, industry and government at both national and local levels.
Yet risks remain in successfully translating this strategy into the growth the government wants – particularly in the persistence of certain myths about university research.
Busting myths
A key myth is that blue sky research only equates to growth in the long term, when the government wants growth sooner. In fact, it does not work like that. Blue sky research delivers growth both now and later. Long term gains may be greater overall, but even in the short term research brings in highly skilled global scientists, attracts leading global firms, and is a draw to medium-sized firms who want to be at the forefront of the next innovation wave.
Research also builds place-based specialised skills that are essential for other industries and sectors, as can be seen in the Oxbridge Arc, Imperial’s White City innovation district, Manchester’s Sister district or Glasgow City Innovation District. Fostering research excellence across the UK’s places is an effective short and long-term growth strategy.
A second myth is about the breadth of impact of university research on growth. It is natural for policymakers to focus on university spin-outs and commercialisation, but in many ways these are a small, if important, part of the story. The lesson from successful university-based growth ecosystems around the world is that the role of large global firms and their relationship with university research and innovation is much more important.
There is understandable and laudable excitement at the prospect of nurturing UK-born unicorns, but in a globally competitive economy around future technologies it is large global firms that very often have substantial research and innovation capability. They employ global leading talent, have great market reach and also can absorb some of the risk necessary for success in future technology-based growth. They also have the interest in, and capacity and capability to partner with universities around research – as we see with Microsoft in Cambridge, Novartis in Imperial’s White City campus, Cranfield’s industry research with Airbus, AstraZeneca in Glasgow or Legal & General’s partnerships with Edinburgh and Newcastle.
In my own university, Brunel, we have long standing research relationships with Jaguar Land Rover and Constellium, one of Europe’s largest aluminium alloy firms. Yet there needs to be much more focus on increasing the number and deepening these relationships. These are near and long term relationships that will lock in longer term growth.
Third, is the misconception that university research exists in any freestanding way in just a small number of universities. It is certainly true that the UK’s leading research universities are absolutely key, but the research system operates in a much more complex, distributed and symbiotic way. Different types of universities play different but equally important roles, and they can and will contribute to the industrial strategy. Whether that is applied research, skills development in the workforce or building entrepreneurial capacity in a region, the university research and innovation system as a whole is key to making sure the benefits of cutting edge technology research are realised for the UK.
The government must not underestimate the centrality of university research and its contribution to future technology-led growth to any industrial strategy worldwide, let alone the UK’s. The industrial strategy is bold and ambitious, and UK universities are well positioned to propel its implementation. However, global competition in the development of future technologies is fierce. The UK cannot afford to underplay or misapply one of its core strategic assets. The opportunity with this strategy is greater than at any time for decades, but it is not going to succeed without harnessing the power of university research.
In February, we launched our commuter student series, seeking to uncover how universities are responding to the increasing numbers of commuter students – students who continue to live at home whilst studying, rather than relocating to attend university, in contrast to “traditional” residential students.
We sought to increase the visibility of commuters and share best practice, responding to demand for thought leadership and evidence-based interventions, with the aim of influencing pedagogy, practice and policy, within institutions and nationally.
In our final article we look back at the series, reflecting on key learnings, before looking forward, setting out a change agenda for commuters that will make higher education more accessible, attractive and available to all.
Commuter students are everywhere yet invisible
Commuter students are part of every UK university.
The proportion of commuters varies by institution – research by Susan Kenyon using 2022 HESA data, shows a range from 12 to 85 per cent.
As such commuters need to be counted and made visible, acknowledged in pedagogy, policy and processes and, where necessary, considered as communities at risk in Access and Participation Plans (APPs) in England.
And despite being everywhere, commuters can often be invisible and underserved.
Earlier in the series Val Yates and Carolyn Oulton discussed how to build an institutional agenda for change by making commuters visible. Their agenda was one where commuters are embedded across the institution. Commuters don’t interact only with their lecturers – supporting commuters lies with academics, across professional services and into teams like IT and sustainability.
We explored the diverse definitions of commuters in APPs, which often makes measuring progress difficult. In supporting commuters, it’s important we know we’re talking about the same group of students. Expanded definitions have considered those who live locally, use transport, have the same term time and home address but also those who relocate but live further away due to cost and housing pressures.
Commuters need to be visible to their institution first before making them visible to each other through access programmes, networks and student societies.
Commuter students are valuable
Our series also reveals the cultural, educational and social value of commuters to our learning community.
Commuters are passionate, engaged and committed. They bring diverse perspectives, experience and expertise to the classroom. As Martin Lowe, Adrian Wright and Mark Wilding write, they “are not just students, they are employees, caregivers, and active members of their communities,” bringing skills such as time management and the ability to balance multiple responsibilities, alongside discipline and an internal motivation to learn that can inspire and influence other students.
And as Emma Maslin highlighted, there is a tendency to see commuters from a deficit perspective, as a disadvantaged group, whose experience needs to be “fixed.”
Our authors don’t deny the academic, financial and social difficulties of being a commuter in a world designed for residential students, particularly when, as Elise Thornton discusses, commuting is often a financial necessity, rather than an active choice.
But the opportunity to attend university as a commuter student can allow students to maintain community, employment and relationships that they value, whilst learning.
Articles by Molly Pemberton and Susan Preston emphasise how valuable commuter students are to the wider student community. Commuters are campaigning for changes in policy, practice and spaces that reshape the university experience and bring benefits to all students.
A common theme running throughout the series is that changes made to pedagogy, policy and processes, which initially aim to create a more inclusive environment for commuter students, benefit all students. And a lot of the time, they’re changes driven by students themselves.
In designing services and learning for commuters, we’ve seen Tom Perou discusses the universal benefits of podcasts, which provide bite-sized learning in an alternative format; Kulvinder Singh described the importance of enhancing belonging in the classroom; and Susan Kenyon and Flic Lindo stressed the importance of improving information on the “rules of the game” and demystifying the “hidden curriculum.”
Commuters are in the city
In the traditional residential model, students remain largely in their defined area. But commuter students are integrated into the wider fabric of communities.
Finding out where commuters are is often a good first step. David Kernohan analysed HESA data to help us understand what constitutes a local student and if local students aren’t going to your provider, where are they going?
It’s common that local authorities don’t know how many students live locally, have relocated or are registered to vote, all of which inhibits the design of services to meet students’ needs. In the context of transport providers, bus fares and transport routes often don’t serve commuters because they don’t first understand that population.
Joel Dowson’s article takes this further, outlining how universities and their students’ unions can leverage the financial value of students to transport providers, in terms of revenue and potential gains from reduced road congestion. At the Greater Manchester Student Partnership they have been lobbying for an improved commuter student experience, influencing the affordability and availability of transport services, to the benefit of all students.
A commuter change agenda
The aim of this series was to empower everyone in HE, whatever their role, to have a better understanding of the needs of commuter students.
And as our contributions have evidenced, work happens everywhere – in professional services, in the classroom, in regional advocacy and with students.
When thinking about where the work starts, it might be at your desk. There’s four categories to our change agenda, drawing on contributions from authors across the series: in the classroom, at the institution, with students and in national policy.
In the classroom
Supporting commuters in the classroom is about making them feel seen and making them visible to each other. Active pedagogies develop belonging and on-commute learning options such as podcasts, pre-recorded lectures or flipped learning are examples of inclusive learning delivery. Creating a reason to attend and articulating the benefits to students is important to sustain engagement.
At the institution
Institutions need to count commuters, then research, listen and review policies to ensure they work for all students. Practical steps include things like student-centric timetabling, consistent and empathetic attendance policies, providing clear information to commuters on application and offering accommodation options so that students can engage beyond the classroom. Institutions have influence with local governments and transport authorities and can be an effective conduit for making the city more commuter student friendly. And institutions can work towards building institutional empathy so colleagues understand that a lack of engagement may not be laziness, it may be a delayed bus or a train fare hike.
With students
Many APP interventions included co-creating solutions with students rather than for them which is undoubtedly the best step forward. It was students who led the way to making a commuter student lounge at Leeds University through the sharing of university rooms, giving them ownership, space and agency. In any project, involving commuters beyond consultation leads to successful interventions and outcomes.
On a national level
Measuring progress is difficult with different and diverse definitions, the sector needs to start with a shared agreement of who this student group is and how to measure them.
The engagement barriers universities face are often tied to the cost of living crisis. Transport fares are expensive, so commuters make tactical, tough decisions about when and how to engage. Responding to consultations and calls for evidence on key transport policy with commuters helps shift transport service design in favour of students. And institutions are key agents in making change on a national level – at Sheffield Hallam SU, it was their VC support that got students in the room with their mayor to discuss bus prices.
Whether it’s student-centric timetables, creating a commuter student lounge or working with the local transport authority, individuals across institutions want to feel empowered to enhance the commuter student experience themselves. So as institutions better understand, count and make visible the commuter student experience, the next step is for the work to start. And small things make a difference, simply talking about commuters in the classroom helps build community. Students experience enough delays on public transport, they don’t want to see the same delays happening with support at their institutions.
Since publication, John Blake, Director for Fair Access and Participation at the Office for Students told us:
Commuter students can sometimes get forgotten in the discourse around higher education. Yet they make up a significant proportion of the student body at all institutions, and at some comprise over three quarters of students. That’s why I really welcome Wonkhe’s focus on this issue. This series has helped identify who commuter students are, the enormous amount they add to the institutions where they study, and the work institutions are doing to support commuter students to get the most from their studies. The OfS has included commuter students in our equality of opportunity risk register, and a number of institutions are working with these students to develop creative solutions to some of the challenges they might face to access and succeed in higher education.
Thank you to all the contributors to the series, if you would like to discuss supporting commuters in more detail, please do reach out to Susan Kenyon.
In her letter to the sector last November, Secretary of State Bridget Phillipson said that she expects universities to play a stronger role in expanding access and improving outcomes for disadvantaged students.
Her letter noted that the gap in outcomes from higher education between disadvantaged students and others is unacceptably large and is widening, with participation from disadvantaged students in decline for the first time in two decades.
She’s referring to the Free School Meals (FSM) eligible HE progression rate – 29 percent in 2022–23, down for the first time in the series.
Of course in 2023–24, or this year, the numbers for FSM and any number of other factors could be much worse – but on the current schedule, we won’t be seeing an update to OfS’ access and participation data dashboard until “summer or autumn 2025”, and even then only for 2023–24.
If you’re prepared to brave the long loading times – which for me generate a similar level of frustration to that I used to experience watching Eurovision national finals 20 years ago – you can drill down into that dashboard by provider.
It’s a mixed picture, with a lot of splits to choose from. But what the data doesn’t tell us is how providers are doing when compared to their signed off targets in their (mainly 2020–21 to 2024–25) access and participation plans.
The last time OfS published any monitoring data was for the 2020–21 academic year – almost three years ago, in September 2022.
That means that we can’t see how well providers are doing against their targets, and nor do we have any sense of any action that OfS may (or may not) have taken to tackle underperformance.
So I decided to have a go. I restricted my analysis to the Russell Group, and extracted all of the targets from the 2020–21 to 2024–25 plans that were measurable via the dashboard.
I then compared the 2022–23 performance with the relevant milestone, and with the original baseline. Where the target was unclear on what type of student was in scope, I assumed FT, first degree students.
The results are pretty worrying.
Baseline
2022-23 Milestone
2022-23 Actual
Behind milestone?
Behind baseline?
PROG
Disabled
Percentage difference in progression to employment and further study between disabled and non-disabled.
3.00
2.00
0.10
N
N
PROG
Ethnicity
Percentage difference in graduate employability between white and black students
7.9
4.70
-2.50
N
N
CONT
Disabled
Percentage difference in non-continuation rates non-disabled and students with mental health conditions
7.00
5.50
1.80
N
N
CONT
Disabled
Percentage difference in continuation rates between disabled students and non-disabled students.
6.4
3
1.3
N
N
CONT
Low Participation Neighbourhood (LPN)
Percentage difference in non-continuation rates between POLAR4 quintile 5 and quintile 1 students.
5
3.5
2.3
N
N
CONT
Low Participation Neighbourhood (LPN)
Percentage difference in non-continuation rates between POLAR4 quintile 5 and quintile 1 students.
4
2.5
3.40
Y
N
CONT
Low Participation Neighbourhood (LPN)
Close the gap in non-continuation between POLAR 4 Q1 and Q5 undergraduate students from 3.8% in 2016/2017 to 1.5% in 2024/25
3.8
3
6.4
Y
Y
CONT
Low Participation Neighbourhood (LPN)
POLAR4 Q1 non-continuation gap v Q5 (relates to KPM3)
4
3.25
6.1
Y
Y
CONT
Low Participation Neighbourhood (LPN)
Percentage difference in non-continuation rates between POLAR4 quintile 5 and quintile 1 students
2.40
1.00
6.90
Y
Y
CONT
Low Participation Neighbourhood (LPN)
Percentage difference in continuation rates between the most (POLAR Q5) and least (POLAR Q1) representative groups.
2.4
1.5
3.1
Y
Y
CONT
Mature
Percentage point difference in non-continuation rates between young (under 21) and mature (21 and over) students.
10
9
6.8
N
N
CONT
Mature
Percentage difference in continuation rates of mature first degree entrants when compared to young students.
10.2
7
-0.4
N
N
CONT
Mature
Significantly raise the percentage of our intake from mature students
5.90
7.00
4.10
N
Y
CONT
Mature
Percentage difference in non-continuation rates mature and non-mature students
9.00
6.00
7.40
Y
N
CONT
Mature
Percentage difference in non-continuation rates between mature (aged 21+) and young (aged
8.00
5.00
5.10
Y
N
CONT
MATURE
Close the gap in non-continuation between young and mature full-time, first degree students from 7.8% in 2016/2017 to 4.4% in 2024/2025.
7.8
6.8
10.2
Y
Y
CONT
Mature
Mature v Young non-continuation gap
9
8.5
10.1
Y
Y
CONT
Mature
Close the gap in continuation rates between young and mature students (by 1pp each year) by 2024/25.
5
3
6.1
Y
Y
CONT
Mature
Percentage difference in non-continuation rates between mature and young students
5.30
3.80
5.80
Y
Y
ATTAIN
Disabled
Percentage difference in degree attainment (1st and 2:1) between disabled students and other students
2.60
1.72
0.9
N
N
ATTAIN
Disabled
Disabled students attainment gap v non-disabled
3
1.5
1.2
N
N
ATTAIN
Disabled
To significantly reduce the difference in degree attainment (1st and 2:1) between disabled students and students with no known disability
4.4
2
0.30
N
N
ATTAIN
Disabled
Percentage point difference in good degree attainment (1st and 2:1) between disabled and not known to be disabled students.
6
5
-2.2
N
N
ATTAIN
Disabled
To remove the absolute gap in degree outcomes for students with a disability (OfS KPM5).
4.0
2.0
-0.60
N
N
ATTAIN
Disabled
Percentage difference in degree attainment (1st and 2:1) between disabled and non-disabled students
3.90
2.00
3.60
Y
N
ATTAIN
Disabled
Percentage difference in degree attainment (1st and 2:1) between students with registered mental health disabilities and non-disabled students
5.80
3.00
4.7
Y
N
ATTAIN
Disabled
Percentage difference in degree attainment (1st and 2:1) between disabled students and non-disabled students
4.2
2.3
3.6
Y
N
ATTAIN
Ethnicity
Black students attainment gap v White (relates to KPM4)
20
15.5
11.2
N
N
ATTAIN
Ethnicity
By 2025, reduce the attainment gap between Asian and white students
8.4
5.2
4.80
N
N
ATTAIN
Ethnicity
Percentage difference in degree attainment (1st and 2:1) between black and white students (5 year rolling average).
12
8.6
4.60
N
N
ATTAIN
Ethnicity
Percentage difference in degree attainment (1st and 2:1) between white and asian students.
19
17
14.4
N
N
ATTAIN
Ethnicity
Percentage difference in degree attainment (1st and 2:1) between white and black students.
14.00
11.00
9.90
N
N
ATTAIN
Ethnicity
To close the gap between Black and White student continuation rates (reducing the gap by 4 percentage points, from 8% to 4%, by 2024/2025).
8
5.6
5.5
N
N
ATTAIN
Ethnicity
To close the gap between BME and White student attainment (reducing the gap by 3 percentage points from 11% to 8% by 2024/25).
17
13.1
11.6
N
N
ATTAIN
Ethnicity
Close the unexplained gap between proportion of BAME and white full-time, first degree students attaining a 2:1 or above from 12.7% in 2017/2018 to 5.5% in 2024/2025.
12.7
10.3
10.8
Y
N
ATTAIN
Ethnicity
Significantly increase the percentage of our intake from Black students
2.30
3.80
2.90
Y
N
ATTAIN
Ethnicity
Percentage difference in degree attainment (1st and 2:1) between white and black students
15.70
9.815
11.6
Y
N
ATTAIN
Ethnicity
Percentage difference in degree attainment (1st and 2:1) between white and Asian students
12.5
8.375
11.4
Y
N
ATTAIN
Ethnicity
Percentage difference in degree attainment (1st and 2:1) between black and white students.
20
15
19.00
Y
N
ATTAIN
Ethnicity
Percentage difference in degree attainment (1st and 2:1) between white and BME students.
5.20
2.00
4.60
Y
N
ATTAIN
Ethnicity
Percentage difference in degree attainment (1st and 2:1) between white and black students.
13.8
6
12.9
Y
N
ATTAIN
Ethnicity
Percentage difference in degree attainment (1st and 2:1) between BAME and White students.
7.00
4.00
7.50
Y
Y
ATTAIN
Ethnicity
Percentage difference in degree attainment (1st and 2:1) between white and black students
4.50
3.00
31.00
Y
Y
ATTAIN
Ethnicity
Percentage difference in degree attainment (1st and 2:1) between white and BAME students
9.50
6.00
11.60
Y
Y
ATTAIN
Ethnicity
By 2025, reduce the attainment gap between black and white students
8.7
5.9
10.70
Y
Y
ATTAIN
Ethnicity
To significantly reduce the difference in degree attainment (1st and 2:1) between white and black students
11.6
10
20.00
Y
Y
ATTAIN
Ethnicity
To significantly reduce the difference in degree attainment (1st and 2:1) between white and Asian students
10.6
10
14.50
Y
Y
ATTAIN
Ethnicity
Percentage point difference in good degree attainment (1st and 2:1) between white and black students.
18
14
22.1
Y
Y
ATTAIN
Ethnicity
Percentage difference in degree attainment (1st and 2:1) between white and black students.
17
15
22.9
Y
Y
ATTAIN
Ethnicity
Halve the gap in attainment that are visible between black and white students (OfS KPM4).
10.0
7.0
15.80
Y
Y
ATTAIN
Ethnicity
To close the gap between Black and White student attainment (by raising the attainment of Black students) reducing the gap by 8.5 percentage points from 17% to 8.5% by 2024/25
11
9.5
24
Y
Y
ATTAIN
Low Participation Neighbourhood (LPN)
Percentage difference in degree attainment (1st and 2:1) between POLAR4 quintile 5 and quintile 1 students
9.10
4.645
8.7
Y
N
ATTAIN
MATURE
Close the unexplained gap between proportion of mature and young full-time, first degree students attaining a 2:1 or above from 12.1% in 2017/2018 to 6.8% in 2024/2025.
12.1
8.8
12.6
Y
Y
ATTAIN
Socio-economic
Percentage difference in degree attainment (1st and 2:1) between students from most and least deprived areas (based on IMD)
10.20
6.00
12.30
Y
Y
ATTAIN
Socio-economic
To significantly reduce the difference in degree attainment (1st and 2:1) between the most and least advantaged as measured by IMD.
10.4
8.8
15.60
Y
Y
ATTAIN
Socio-economic
Reduce the gaps in attainment that are visible between IMD Q1 and Q5 (OfS KPM3).
10.0
7.0
13.70
Y
Y
ACCESS
Disabled
By 2025, increase the proportion of students with a declared disability enrolling from the baseline of 9% to 13%
9
11
15.70
N
N
ACCESS
Ethnicity
Significantly increase the percentage of our intake from Asian students
6.90
8.50
9.70
N
N
ACCESS
Ethnicity
Percentage of BAME entrants
10.10
12.50
12.70
N
N
ACCESS
Ethnicity
Increase percentage proportion of students identifying as black entering to at least match or exceed sector average (11%).
9.5
10.5
11.7
N
N
ACCESS
Ethnicity
To increase the proportion of Black, young, full-time undergraduate entrants by 1.2 percentage points, from 2.4% to 3.6% by 2024/25.
2.4
2.8
2.1
Y
Y
ACCESS
Low Participation Neighbourhood (LPN)
Ratio in entry rates for POLAR4 quintile 5: quintile 1 students
7.4:1
6:1
4.5
N
N
ACCESS
Low Participation Neighbourhood (LPN)
Reduce the ratio in entry rates for POLAR4 quintile 5: quintile 1 students
3.9:1
3.4:1
3.4:1
N
N
ACCESS
Low Participation Neighbourhood (LPN)
By 2025, reduce the gap in access between those from the highest and lowest POLAR4 quintiles enrolling from the baseline of 49% to 41%
49
45
41.00
N
N
ACCESS
Low Participation Neighbourhood (LPN)
Ratio of students from POLAR Q1 compared to POLAR Q5.
01:14
01:11
8.5
N
N
ACCESS
Low Participation Neighbourhood (LPN)
Close the gap in access between Q1 and Q5 students from a ratio of 5.5 in 2017/2018 to 3.5 by 2024/2025.
5.5
3.64
4.2
Y
N
ACCESS
Low Participation Neighbourhood (LPN)
Reduce ratio in entry rates for POLAR4 quintile 5: quintile 1 students
12:1
8:1
8.5
Y
N
ACCESS
Low Participation Neighbourhood (LPN)
To reduce the gap in participation and ratio in entry rates for POLAR 4 Quintile 5: Quintile 1 students
Ratio Q5:Q1 of 5.2:1
500 students from POLAR 4 Q1
4.5 or 500
Y
N
ACCESS
Low Participation Neighbourhood (LPN)
LPN determined by POLAR 4 data. Looking specifically at increasing the intake for LPN Quintile 1 students, and thereby reduce the ratio of Q5 to Q1. (Target articulated as both a percentage and number).
8.0%, 391
10%, 490
8.6, 400
Y
N
ACCESS
Low Participation Neighbourhood (LPN)
Ratio in entry rates for POLAR4 quintile 5: quintile 1 students.
7.4:1
5.5:1
6.9
Y
N
ACCESS
Low Participation Neighbourhood (LPN)
Ratio in entry rates for POLAR4 quintile 5: quintile 1 students. All undergraduates.
6.2:1
5.1:1
6.3
Y
Y
ACCESS
Low Participation Neighbourhood (LPN)
Ratio in entry rates for POLAR4 quintile 5: quintile 1 students.
4.2:1
3.5:1
4.3
Y
Y
ACCESS
Low Participation Neighbourhood (LPN)
Ratio in entry rates for POLAR4 quintile 5: quintile 1 students. Reduce gap to 3.0 to 1.0 by 2024-25 (OfS KPM2).
5:2 to 1
4
5.2
Y
Y
ACCESS
Low Participation Neighbourhood (LPN)
To increase the proportion of young, full-time undergraduate entrants from POLAR4 Q1 by 2.5 percentage points, from 7.8% to 10.3%, by 2024/25.
7.8
8.9
10.3
Y
Y
ACCESS
Low Participation Neighbourhood (LPN)
To increase the proportion of young, full-time undergraduate entrants from POLAR4 Q2 by 2.5 percentage points, from 12.4% to 14.9%, by 2024/25.
12.4
13.9
15.4
Y
Y
ACCESS
Mature
Percentage of mature entrants
5.80
7.20
3.70
Y
Y
ACCESS
Mature
Percentage of mature students as part of the overall cohort.
9.2
11.0
6.70
Y
Y
ACCESS
Multiple
Increase the proportion of BME students from Q1 and Q2 backgrounds
5.2
8
7.6
N
Y
ACCESS
Socio-economic
Eliminate the IMD Q5:Q1 access gap by 2024/25.
5
2
-4.5
N
N
ACCESS
Socio-economic
By 2025, reduce the gap in access between those from the highest and lowest IMD quintiles from the baseline of 16.4% to 10.4%
16.4
13.5
7.00
N
N
ACCESS
Socio-economic
Percentage point difference in access rates between IMD quintile 1 and 2 and quintile 3, 4 and 5 students.
51.8
43.8
53.4
Y
Y
Milestones and baselines
If we start with access, of the 25 targets that can be analysed, 14 behind milestone – and 10 show a worse performance than the baseline.
On continuation, 11 of the 17 are behind milestone, and 9 are behind the baseline. And on attainment, 25 of the 38 are behind milestone, and 14 behind baseline.
Notwithstanding that some of the other targets might have been smashed, and that in all cases the performance may well have improved since then, that looks like pretty poor performance to me.
It’s the sort of thing that we might have expected to result in fines, or at least specific conditions of registration being imposed.
But as far as we know, nothing beyond enhanced monitoring has been applied – and even then, we don’t know who has been under enhanced monitoring.
And the results are a problem. When OfS launched this batch of plans, it noted that young people from the most advantaged areas of England were over six times as likely to attend one of the most selective universities – including Oxford, Cambridge and other members of the Russell Group – as those from the most disadvantaged areas, and that that gap had hardly changed despite a significant expansion in the number of university places available.
At the rates of progress forecast under those plans, the ratio was supposed to be less than 4:1 by 2025. It was still at 5.44 in the Russell Group in 2022–23.
It was supposed to mean around 6,500 extra students from the most disadvantaged areas attending those universities each year from 2024-25 onwards. The Russell Group isn’t the whole of “high tariff” – but it had only increased its total of POLAR1 students by 1350 by 2022/23.
OfS also said that nationally, the gap between the proportion of white and black students who are awarded a 1st or 2:1 degree would drop from 22 to 11.2 percentage points by this year. As we’ve noted before on the site, the apparent narrowing during Covid was more of a statistical trick than anything else. It was up at 22.4 in 2022–23.
And the gap in dropout rates between students from the most and least represented groups was supposed to fall from 4.6 to 2.9 percentage points – it was up at 5.3pp in 2022–23.
Of course, much has happened since January 2020. To the extent to which there were challenges over the student life cycle, they were likely exacerbated by the pandemic and a subsequent cost of living crisis.
But when you’re approving four year plans, changes in the external risk environment ought to mean that it revises what it now calls an Equality of Opportunity Risk Register to reflect that – and either allows providers to revise targets down, or requires more action/investment to meet the targets agreed.
Neither of those things seem to have happened.
It’s also the case that OfS has radically changed how it regulates in this area. Back then, the director for fair access and participation was Chris Millward. It’s now John Blake. And the guidance, nature of the plans expected and monitoring regimes have all been revamped.
But when we’re dealing with long-term plans, a changing of the guard does run the risk that the expectations and targets agreed under any old regime get sidelined and forgotten about – letting poor performers off the hook.
It certainly feels like that’s the case. And while John Blake is widely respected, it’s hard to believe that he’ll still be the director for fair access and participation by the end of the latest round of plans – 2029.
Hindsight is a wonderful thing, of course, but notwithstanding the external environment changes, few anticipated that any of the gaps, percentages or ratios would worsen for any of the targets set back in 2019.
That matters because of that OfS aggregation issue. It’s not just that some providers can drag down the performance of the sector as a whole. It’s that no provider was set the target of not getting any worse on the myriad of measures that it didn’t pick for its plan.
For all we know, while a certain number of providers might have set and agreed a target, say, on POLAR1 access or IMD attainment, performance could have worsened in all of those that didn’t – and that poses a major problem for the regulator and the design of the thing.
It remains the case that we’re lacking clarity on the way in which the explosion of franchised, urban area business provision has impacted the stats of both the providers that have lit that blue touch paper, and the sector’s scores overall. For me, improvements in access via that method look like cheating – and declines in continuation, completion or progression ought to mean serious questions over funding policy within the Department for Education.
We don’t really know – but need to know – the impact of other providers’ behaviour on an individual provider’s external environment. If, for example, high tariff universities scoop up more disadvantaged students (without necessarily actually narrowing the gap), that could end up widening the gap elsewhere too. There’s only so many moles to whack when you’re looking at access.
We still can’t see A&P performance by subject area – which has always been an issue when we think about access to the professions, but is an even bigger issue now that whole subject areas are being culled in the face of financial problems.
And the size and shape question lingers too. UCAS figures at the close of clearing suggested that high tariff providers were set to balance the books by expanding in ways they claimed were impossible when the “mutant algorithm” hit in 2020.
Much of continuation, completion and progression appears to be about the overall mix of students at a provider – something that’s made much more challenging in medium and lower tariff providers if high-tariff ones lower theirs.
In the forthcoming skills white paper, we should expect exhortations from ministers that the sector improves its performance on access and participation. It will have choices on provider type, subject area, the types of disadvantage to focus on, and the mix of measures between things inside its control in the external environment, and things within providers’ control (or at least influence) that OfS should expect.
Whatever it chooses, on the evidence available, it will have real problems judging either its own performance, its regulator’s, groups of providers or even individuals’. If you think the sector still has some distance to go on fairness, that just won’t do.
In a stunning escalation that has drawn comparisons to authoritarian crackdowns, former President Donald Trump has ordered 2,000 California National Guard troops into Los Angeles to quell protests sparked by ICE raids across the region. Despite opposition from California Governor Gavin Newsom and local officials, Trump bypassed state authority by invoking federal powers under Title 10 of the U.S. Code—stopping short of the more drastic Insurrection Act but still raising serious constitutional questions.
The protests began after ICE agents detained dozens of individuals in workplace raids across South L.A. County. The response from the public was immediate and fierce, with large demonstrations erupting near ICE facilities and federal buildings. As tensions grew, federal officers deployed tear gas and non-lethal weapons against demonstrators, while arrests mounted and reports of detainee mistreatment surfaced.
What makes this moment particularly alarming is the way Trump has redefined protest as “rebellion,” authorizing military support for federal law enforcement without a state request. Defense Secretary Pete Hegseth has even threatened to deploy active-duty Marines from Camp Pendleton—a move unseen since the 1992 Rodney King unrest. Legal experts and civil rights advocates have sounded the alarm, calling the federal takeover of California’s National Guard unprecedented and chilling.
The implications for higher education, especially for undocumented and mixed-status students, are profound. Campuses in Southern California are already on edge, with many students fearing ICE presence and military escalation. Faculty and staff in sanctuary campuses and immigrant advocacy networks warn that the militarization of civil immigration enforcement could further chill free speech, academic freedom, and student organizing.
Law professors like Erwin Chemerinsky have warned that Trump’s actions bypass both precedent and constitutional norms: “It is using the military domestically to stop dissent.” Georgetown’s Steve Vladeck noted that the National Guard’s role may technically be limited to support functions, but the symbolism and real-world consequences of armed troops on city streets are undeniable.
Trump’s invocation of rebellion in response to protest mirrors earlier moments of U.S. history where power was used to silence dissent. But this time, it is playing out amid a polarized political landscape, weakened democratic institutions, and a rising authoritarian movement—with the academy, once again, caught in the crossfire.
As protests continue, California’s colleges and universities—long sites of political activism—face renewed pressure. The presence of federal troops, surveillance, and threats of repression may signal a dangerous new phase in the government’s approach to dissent. What was once unthinkable is becoming reality: a nation where protesting immigration raids can be construed as rebellion, and soldiers patrol streets not in a time of war, but in a time of political theater.
LARAMIE—The Lab School is a family affair for Corelle Lotzer.
Not only did Lotzer enroll her daughter and son in the school, but she taught math here for over a decade. Her daughter, who thrived years ago as a student in the K-8 atmosphere, returned as an adult to work as a paraprofessional — just down the hall from her mom.
Because Lotzer took a year off to take care of an aging aunt, she lost tenure. So when the closure of the 138-year-old school became official this winter, she did not receive a contract with the district to continue working at one of its other schools.
Lotzer, who was raised in Laramie, instead accepted a position at Cheyenne East High School. In early May, she was still trying to figure out the logistics involved with working in Cheyenne while her other, younger kids continue their education in Laramie.
“It’s been tough,” Lotzer said in a second-story room in the Lab School. The shrieks and laughter of children at recess drifted in from an open window. “I would have rather stayed in Albany County.”
Lotzer is one of 11 Lab School teachers without tenure, Principal Brooke Fergon said. “That’s probably been the most difficult challenge, that our tenured teachers have been placed in other schools throughout the district, and our teachers who do not have tenure … were not initially placed in positions.”
It’s not the only pain point involved in closing a school that predates the state of Wyoming itself. Many people fought to keep the Lab School open, and the past year has been a rollercoaster of emotions for school staff, students and their families as hopes have been raised and dashed, Fergon said. The school, which sits on the University of Wyoming campus, started as an educational learning site for college students studying to be teachers. It’s beloved for its experiential and outdoor-based approach to learning and emphasis on inclusivity.
Kindergarten students in Victoria Wiseman’s Lab School class raise their pencils to signify they have completed an exercise in May 2025. (Katie Klingsporn/WyoFile)
But the school’s future was thrown in doubt last summer as the university and Albany County School District 1 hit a stalemate over a lease agreement. School advocates pleaded to keep it open by some means and floated ideas that didn’t stick. The Lab School no longer served its former functions, university and district officials said, and issues from maintenance costs for the 75-year-old building to district-wide enrollment trends factored into closure talks.
The final Hail Mary came during the Wyoming Legislature. A bipartisan bill sponsored by Laramie Democrat Chris Rothfuss would have required UW and a coordinating district to operate a K-8 public lab school. The bill passed out of the Senate, but House lawmakers killed it in February, and that was pretty much that for the Lab School.
In the last year, Fergon said, “I think we’ve really been sitting in a place of uncertainty, just with all of the different avenues that could have kept the school going, and so that did feel kind of like a final door closing.”
And for her staff, she said, “even though we’re not happy to say goodbye to the school, and we didn’t want to see the school close, I think that having some certainty and a path forward … feels better than just sitting in limbo.”
With the school year ending Thursday, Lab School students will be saying goodbye to their classrooms and dispersing to other schools in the district. Some teachers will too, but others are starting new jobs or moving out of Laramie entirely. The school community spent the last couple of months bidding farewell, some with regret about how it ended.
Students enjoy warm weather during a May 2025 farewell celebration of the Lab School in Laramie. (Zach Agee/WyoFile)
“We love the school,” said Lindsey Rettler, a parent with two elementary students in Lab. Rettler was experiencing a mixture of emotions, she said in May. “Surprise, a little bit of shock, really, really sad, super disappointed and honestly, quite betrayed by those who are supposed to be leading people based on what’s best for the people.”
End of an era
The school was established in 1887 as the Preparatory School to serve secondary education students from counties without access to high school. In 1913, it transitioned to the Training Preparatory School, used as a learning laboratory by UW’s College of Education.
In 1999, the private school partnered with the Albany County School District to become a district public school. The Lab School then operated as a “school of choice,” meaning any district family could enter a lottery to enroll their kids.
College of Education students continued to train in its classrooms, but they also did so in classrooms across the district, state and beyond.
Historically, UW and the school district operated with a memorandum of understanding laying out terms of tenancy. Efforts to renew that MOU, however, failed to produce an updated agreement. Instead, the university announced last summer it was pursuing an extension only for the 2024-’25 school year, meaning the school would have to find a new home if it was to continue beyond that.
Margaret Hudson, a former principal at the Lab School, leads a school tour during a May 2025 farewell celebration of the school. (Zach Agee/WyoFile)
Among the major sticking points: whether the district or UW should pay for things like major maintenance in the aging building. UW also cited the fact that the school “no longer serves a significant role for teacher training in UW’s College of Education,” along with security challenges regarding having a school-district-operated facility located on university grounds; the Lab School’s incongruence with the state’s public funding model and the fact that the school district “has excess capacity in its existing facilities to accommodate current Lab School students.”
Concerned residents bemoaned the decision, and Albany County state lawmakers took notice. Sen. Rothfuss’ bill was the product of that concern. The bill brought together strange bedfellows, with co-sponsors ranging from Freedom Caucus-aligned lawmakers like Ocean Andrew to Laramie Democrat Karlee Provenza. Both serve in the Wyoming House of Representatives.
The issue raised questions about the state’s role in local education and what constitutes a situation so exceptional that lawmakers should meddle. Lab School supporters argued its unique role as a teaching laboratory and its century-plus of education history made it a place worth saving.
“This legislation is not about saving a school,” Rep. Andrew, R-Laramie, said on the House floor on Feb. 28. “It is about protecting a legacy and educating future generations of Wyoming teachers.”
Librarian Cathy Dodgson greets a former student during a Lab School celebration in May 2025. The student remembered spending many hours reading in the library. (Zach Agee/WyoFile)
True local control reflects the wishes of the people in the community, he continued, “and in this case, the overwhelming support for keeping the Lab School open has been ignored. The people of Wyoming, the parents and the students have spoken, and they have been met with indifference by those in power.”
But others said the state should not interfere in a matter of local concern.
“This really feels like we’re being asked to micromanage a local school,” said Rep. Art Washut, R-Casper. “I don’t think this is the proper role of the state legislature.”
The body ultimately killed the measure on a 24-32 vote.
Moving on
With that, school staff began the work of transition, making plans with its 145 students to help them figure out transfer schools and options, Fergon said.. The school counselor even brought in a “transition curriculum” to help students navigate and cope with the stress of such significant change.
There was also a staff of roughly 20 teachers along with employees like janitors and paraprofessionals. Many say they are sad to leave a school community that felt like family.
Some, like Fergon, are continuing to work in the district. She will be an assistant principal at another high school.
June 8, 2025, by Dean Hoke: Intercollegiate athletics occupy a powerful and unique place in American higher education—something unmatched in any other country. From the massive media contracts of Division I football to the community pride surrounding NAIA and NJCAA basketball, college sports are a defining feature of the American academic landscape. Unlike most nations, where elite athletic development happens in clubs or academies, the U.S. integrates competitive sports directly into its college campuses.
This model is more than tradition; it’s an engine of opportunity. For many high school students—especially those from underserved backgrounds—the chance to play college sports shapes where they apply, enroll, and succeed. According to the NCAA, 35% of high school athletes say the ability to participate in athletics is a key factor in their college decision [1]. It’s not just about scholarships; it’s about identity, community, and believing their talents matter.
At smaller colleges and two-year institutions, athletics often serves as a key enrollment driver and differentiator in a crowded marketplace. International students, too, are drawn to the American system for its academic-athletic fusion, contributing tuition revenue and global prestige. Undermining this model through sweeping changes to federal financial aid, without considering the downstream effects, risks more than athletic participation. It threatens a distinctively American approach to education, access, and aspiration.
A New Threshold with Big Impacts
Currently, students taking 12 credit hours per semester are considered full-time and eligible for the maximum Pell Grant, which stands at $7,395 for 2024-25 [2]. The proposed House budget raises this threshold to 15 credit hours per semester. For student-athletes, whose schedules are already packed with training, competition, and travel, this shift could be devastating.
NCAA academic standards require student-athletes to maintain full-time enrollment (typically 12 hours) and make satisfactory academic progress [3]. Adding another three credit hours per term may force many to choose between academic integrity, athletic eligibility, and physical well-being. In sports like basketball, where teams frequently travel for games, or in demanding STEM majors, completing 15 credit hours consistently can be a formidable challenge.
Financial Impact on Student-Athletes
Key Proposed Changes Affecting Student-Athletes:
Pell Grant Reductions: The proposed budget aims to cut the maximum Pell Grant by $1,685, reducing it to $5,710 for the 2026–27 academic year. Additionally, eligibility criteria would become more stringent, requiring students to enroll in at least 15 credit hours per semester to qualify for full-time awards. These changes could result in approximately 700,000 students losing Pell Grant eligibility [4].
Elimination of Subsidized Loans: The budget proposes eliminating subsidized federal student loans, which currently do not accrue interest while a student is in school. This change would force students to rely more on unsubsidized loans or private lending options, potentially increasing their debt burden [5].
Cuts to Work-Study and SEOG Programs: The Federal Work-Study program and Supplemental Educational Opportunity Grants (SEOG) are slated for significant reductions or elimination. These programs provide essential financial support to low-income students, and their removal could affect over 1.6 million students [6].
Institutional Risk-Sharing: A new provision would require colleges to repay a portion of defaulted student loans, introducing a financial penalty for institutions with high default rates. This could strain budgets, especially at smaller colleges with limited resources [7].
Figure 1: Total student-athletes by national athletic organization (NCAA, NAIA, NJCAA).
While Figure 1 highlights the total number of student-athletes in each organization, Figure 2 illustrates how deeply athletics is embedded in different types of institutions. NAIA colleges have the highest ratio, with student-athletes comprising 39% of undergraduate enrollment. Division III institutions follow at approximately 8.42%, and the NJCAA—serving mostly commuter and low-income students—relies on athletics for 8.58% of its total student base [8].
Even Division I, with its large student populations, includes a meaningful share (2.49%) of student-athletes. These proportions underscore how vital athletics are to institutional identity, especially in small colleges and two-year schools where athletes often make up a significant portion of campus life, retention strategy, and tuition revenue.
Figure 2: Percentage of student-athletes among total undergraduate enrollment by organization (NCAA Divisions I–III, NAIA, NJCAA).
The Pell Grant Profile: Who’s Affected
Pell Grants support students with the greatest financial need. According to a 2018 report, approximately 31.3% of Division I scholarship athletes receive Pell Grants. At individual institutions like Ohio State, the share is even higher: 47% of football players and over 50% of women’s basketball players. In the broader NCAA system, over 48% of athletes received some form of federal need-based aid in recent years [9].
There are approximately 665,000 student-athletes attending college. The NCAA reports that more than 520,000 student-athletes currently participate in championship-level intercollegiate athletics across Divisions I, II, and III [10]. The National Association of Intercollegiate Athletics (NAIA) oversees approximately 83,000 student-athletes [11], while the National Junior College Athletic Association (NJCAA) supports around 60,000 student-athletes at two-year colleges [12].
The NAIA and NJCAA systems, which serve many first-generation, low-income, and minority students, also have a high reliance on Pell Grant support. However, exact figures are less widely published.
The proposed redefinition of “full-time” means many of these students could lose up to $1,479 per year in aid, based on projections from policy experts [13]. For low-income students, this gap often determines whether they can afford to continue their education.
Fewer Credits, Fewer Dollars: Academic and Athletic Risks
Another major concern is how aid calculations based on “completed” credit hours will penalize students who drop a class mid-semester or fail a course. Even if a student-athlete enrolls in 15 credits, failing or withdrawing from a single 3-credit course could drop their award amount [14]. This adds pressure to persist in academically unsuitable courses, potentially hurting long-term academic outcomes.
Athletic departments, already burdened by compliance and recruitment pressures, may face added strain. Advisors will need to help students navigate increasingly complex eligibility and aid requirements, shifting focus from performance and development to credit-hour management.
Disproportionate Effects on Small Colleges and Non-Revenue Sports
The brunt of these changes will fall hardest on small, tuition-dependent institutions in the NCAA Division II, Division III, NAIA, and NJCAA. These colleges often use intercollegiate athletics as a strategic enrollment tool. At some NAIA schools, student-athletes comprise 40% to 60% of the undergraduate population [8].
Unlike large Division I schools that benefit from lucrative media contracts and booster networks, these institutions rely on a patchwork of tuition, modest athletic scholarships, and federal aid to keep programs running. A reduction in Pell eligibility could drive enrollment declines, lead to cuts in athletic offerings, and even force some colleges to close sports programs or entire campuses.
Already, schools like San Francisco State University, Cleveland State, and Mississippi College have recently announced program eliminations, citing budgetary constraints [15]. NJCAA institutions—the two-year colleges serving over 85,000 student-athletes—also face a precarious future under this proposed budget.
Economic Importance by Division
Division I: Athletics departments generated nearly $17.5 billion in total revenue in 2022, with $11.2 billion self-generated and $6.3 billion subsidized by institutional/government support or student fees [16]. Many Power Five schools are financially resilient, with revenue from TV contracts, merchandise, and ticket sales.
Division II: Median revenue for schools with football was around $6.9 million, but generated athletic revenue averaged only $528,000, leading to significant deficits subsidized by institutional funds [17].
Division III: Division III schools operate on leaner budgets, with no athletic scholarships and total athletics budgets often under $3 million per school. These programs are typically funded like other academic departments [18].
NAIA and NJCAA: These schools rely heavily on student-athlete enrollment to sustain their institutions. Athletics are not profit centers but recruitment and retention tools. Without Pell Grants, many of these athletes cannot afford to enroll [11][12].
Figure 3: Estimated number of NAIA, Division III, and NJCAA programs by state.
Unintended Tradeoffs: Equity and Resource Redistribution
Attempting to offset lost federal aid by reallocating institutional grants could result in aid being shifted away from non-athletes. This risks eroding equity goals, as well as provoking internal tension on campuses where athletes are perceived to receive preferential treatment.
Without new revenue sources, institutions may also raise tuition or increase tuition discounting, potentially compromising their financial stability. In essence, colleges may be forced to choose who gets to stay in school.
The High-Stakes Gamble for Student-Athletes
Figure 4: Estimated impact of Pell Grant changes on student-athletes, including projected dropouts and loan default rates.
For many student-athletes, especially those from low-income backgrounds, the Pell Grant is not just helpful—it’s essential. It makes the dream of attending college, competing in athletics, and earning a degree financially feasible. If the proposed changes to Pell eligibility become law, an estimated 50,000 student-athletes could be forced to drop out, unable to meet the new credit-hour requirements or fill the funding gap [19]. Those who remain may have no choice but to take on additional loans, risking long-term debt for a degree they may never complete. The reality is sobering: Pell recipients already face long-term student loan default rates as high as 27%, and for those who drop out, that figure climbs above 40% [20]. Stripping away vital support will almost certainly drive those numbers higher. The consequences won’t stop with individual students. Colleges—particularly smaller, tuition-dependent institutions where athletes make up a significant share of enrollment—stand to lose not just revenue, but the very programs and communities that give purpose to their campuses.
Colleges, athletic associations, policymakers, and communities must work together to safeguard opportunity. Student-athletes should never be forced to choose between academic success and financial survival. Preserving access to both education and athletics isn’t just about individual futures—it’s about upholding a uniquely American pathway to achievement and equity.
Dean Hoke is Managing Partner of Edu Alliance Group, a higher education consultancy. He formerly served as President/CEO of the American Association of University Administrators (AAUA). With decades of experience in higher education leadership, consulting, and institutional strategy, he brings a wealth of knowledge on small colleges’ challenges and opportunities. Dean is the Executive Producer and co-host for the podcast series Small College America.
Congressional Budget Office. (2025). Reconciliation Recommendations of the House Committee on Education and the Workforce. Retrieved from https://www.cbo.gov/publication/61412
NJCAA, NAIA, and NCAA. (2023). Student-Athlete Participation Reports.
The breadth of what we expect from the public sector is such that expertise needs to be distributed around the civil service.
There are numerous costly initiatives, allocations, and activities fueled by state spending – all of them have advocates and skeptics, and hidden pitfalls and tensions.
Even if there was a single brain that had a grasp of everything, how would that person weigh up the costs and benefits of spending on lifesaving drugs against maintaining housing benefits? Or expanding school breakfast clubs against meaningful support for public libraries? Or properly maintaining research infrastructure against properly maintaining flood defences?
A spending review is an exercise in compromise – a search for the least worst answer – that almost by design disappoints nearly everyone. If there’s good news in one area of spending, there is pain coming elsewhere.
Where did spending reviews come from?
The idea of taking the time every few years to gather together all current public sector spending demands and assess the possibilities for savings feels like it has been around for ever.
In fact, the first multi-year spending review took place as recently as 1998.
Before this, UK spending and taxation was decided based on prevailing economic conditions – leading to accusations of short-termism in government thinking. After all it is difficult to plan sustainable programmes of spending with only one year of funding confirmed.
The first multi-year comprehensive spending review was a Gordon Brown innovation – coming off the back of two years with public sector finance (politically) constrained by the previous government’s last year of allocations, it represented (in the language of the time) an opportunity for a newish Labour government to demonstrate ongoing “prudence”.
By looking not just at what government spends but at what government does, the review has identified the modernisation and savings that are essential. The first innovation of the Comprehensive Spending Review is to move from the short-termism of the annual cycle and to draw up public expenditure plans not on a one year basis but on a three year basis. And the review‘s second conclusion is that all new resources should be conditional on the implementation of essential reforms, money but only in return for modernisation
Labour stuck a pattern of three year reviews throughout their last period of office – including another comprehensive spending review in 2007. Under Conservative-led administrations the pattern became more irregular (largely for reasons of political expediency, but also to respond to one off events like the Covid-19 pandemic). The last spending review was in 2021 – three governments (and three Prime Ministers) ago.
How a spending review works
The specifics may vary, but the review is a series of conversations conducted by the treasury (usually under the auspices of the Chief Secretary to the Treasury) and each department. Starting with officials modelling the impact of broad-brush cuts at various levels and arguing about what constitutes the work their department is required to do (the ambit) and what (for non-zero based spending reviews) the baseline funding should be, the process ends with ministers taking the argument directly to the treasury – or overhead to the prime minister and via carefully placed stories in the press.
Eventually – the key date this year was as recent as late May – ministers and the Chancellor will come to a final agreement over what will be allocated and what, in broad terms, it will be spent on.
Those who have been closely involved tend not to be enamoured of the process – former DfE adviser Sam Freedman recently described it as “demented” and “not a good or strategic way to make decisions about government spending”.
In 2024
The current iteration kicked off straight after the 2024 election, with the first part of it announced by Rachel Reeves alongside the autumn budget. Alongside some punchy political lines (that “£22bn black hole” for one) she confirmed the overall envelope for the spending review:
Day to day spending from 2024-25 onwards will grow by 1.5 per cent in real terms, and total departmental spending, including capital spending, will grow by 1.7 per cent in real terms.
We also got some broad promises on education spending – an extra £300m for further education, a £2.3bn increase in the schools core budget and a reform of special educational needs provision. However, the Institute for Fiscal Studies is warning that given other promises, most notably on defence and health, “unprotected” DfE recurrent spending (which would include spending on higher education) is likely to fall by around 3 per cent over the three years the review covers – and significant schools and FE spending (which the government is likely to want to protect) also appears within that bucket.
Higher education is by no means alone in facing a very tight multi-year settlement – but it suffers in terms of public salience. While, thanks to the efforts of universities and trade unions, there is a general consensus that the sector is struggling it is neither as totemic (NHS, schools, defence) or visible (local services, adult skills, social care) as the recipients of other public spending. There’s been a lot of work done in making the arguments for investment, but these arguments are never going to be as strong as they need to be.
That’s (flat) capital
What Reeves appears to be promoting in the run up to the review is the availability of capital. Traditionally, spending reviews have only addressed departmental expenditure limits (DEL) – recurrent funding that can reasonably be controlled by the department in question – involving capital spending only really started in 2020 and 2021. Changes to, for example, eligibility rules for benefits can also have an impact on recurrent annual managed expenditure (AME) and spending reviews have moved further in that direction in recent times.
Capital is more traditionally allocated and spent in fiscal events – it makes for big numbers and eyecatching infrastructure investments and doesn’t usually form a part of the spending reviews, but it was always in scope for 2024 to set capital budgets for at least five years.
And the big sector-focused news has been about research and development funding. While by no means all R&D funding goes to universities, a substantial proportion will end up there – and the news that the overall allocation for R&D will keep pace with inflation until 2029-30 is undoubtedly good in the context of a very tight overall recurrent settlement. As my colleague James Coe sets out elsewhere on Wonkhe, there are other calls on R&D beyond the traditional UKRI allocations (though we know UKRI allocations will be broadly stable this year): there are calls for increased spending in defence research, there will be small (£30m to each current mayoral strategic authority) regional allocations, and there will likely be funding streams attached to each of the government’s missions.
Recall also, the manifesto promise of ten-year funding settlements for some research activity. Five years of flat (inflation-compensated) funding represents exactly the kind of stable and predictable income that some parts of the sector have been asking for – if there are people unhappy with that, promising stability for ten years isn’t going to feel much different.
Teaching funding
Fans of the national accounts will know that the majority of funding allocated to teaching in higher education (the student loan outlay) is, in fact, AME capital. There has been some initial hope that the portion that isn’t (the recurrent DEL that is allocated via the grant letter to the Office for Students) would form a part of the long promised review of funding – but this looks less likely than a commitment to continue inflationary fee-cap uplifts alongside measures to improve efficiency in spending (rooting out fraudulent applications and suchlike, promoting shared services).
The parallel is with funding for 16-19 students – an extra £190m will push per-student funding up an inflation-busting 5.9 per cent next year, to £5,105. The recurrent funding simply isn’t there to do anything like that for direct higher education funding, but using an increase in capital spending offers a release valve via the tuition fee loan mechanisms.
Fee increases would be unpopular (a tax on aspiration, if you like) with young people and their parents. The temptation would be to favourably tweak the conditions of repayment, and there may be some headroom here – if you recall last year’s earnest and sporadically understood talk around PSNFL in the fiscal rules, one of the upshots was that loans count as assets, and the more loans we have the more (in the short-to-medium term at least) assets we have. While this could fuel a further expansion of the sector, the current policy weather suggests that this flexibility could instead be used to offer young people a better loan deal.
On the day
While a multi-year spending review is an exercise in demonstrating the long term planning capacity of a government, the event itself has to interface with the short-term news cycles. There needs to be some good news in there – and the pre-announced transport capital, R&D capital, and above-inflation settlement for health are part of that.
Good news could also take the form of announcing popular savings. Very few people will be disappointed in cuts to bureaucracy (at least in the short term, people do tend to become very upset when waiting times rise and services become less effective) and measures to address fraud. Here we’ve already heard a lot of mood music around fraud within the higher education funding system – the very high profile case of Oxford Business College suggests that ministers see the opportunity to better manage the current allocations of funding, and there is a consultation response ready to drop. We’d assumed this would come alongside the promised white paper, but I wouldn’t be surprised to see at least headline proposals sneak out earlier.
Finally we have the broader favourite that is “efficiency” savings. Universities have been very engaged with this agenda ever since the HE Reform letter – the conjunction of the Universities UK report, the release of TRAC data (slightly delayed over last year), and the spending review may not be entirely coincidental.


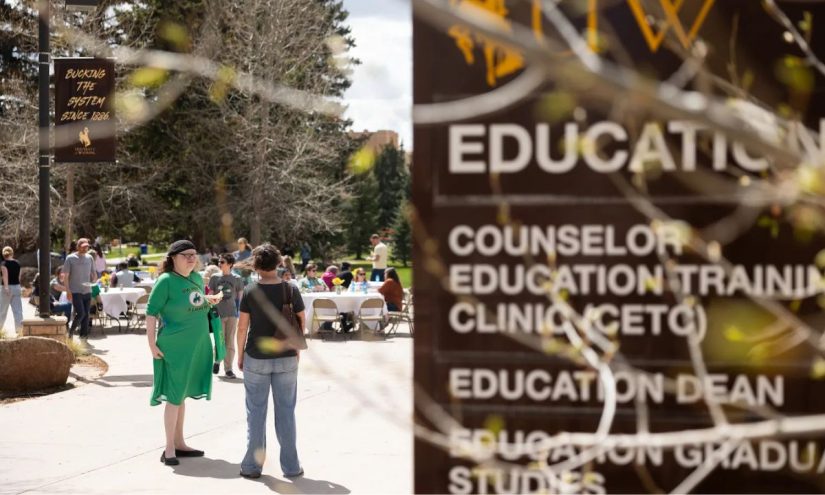
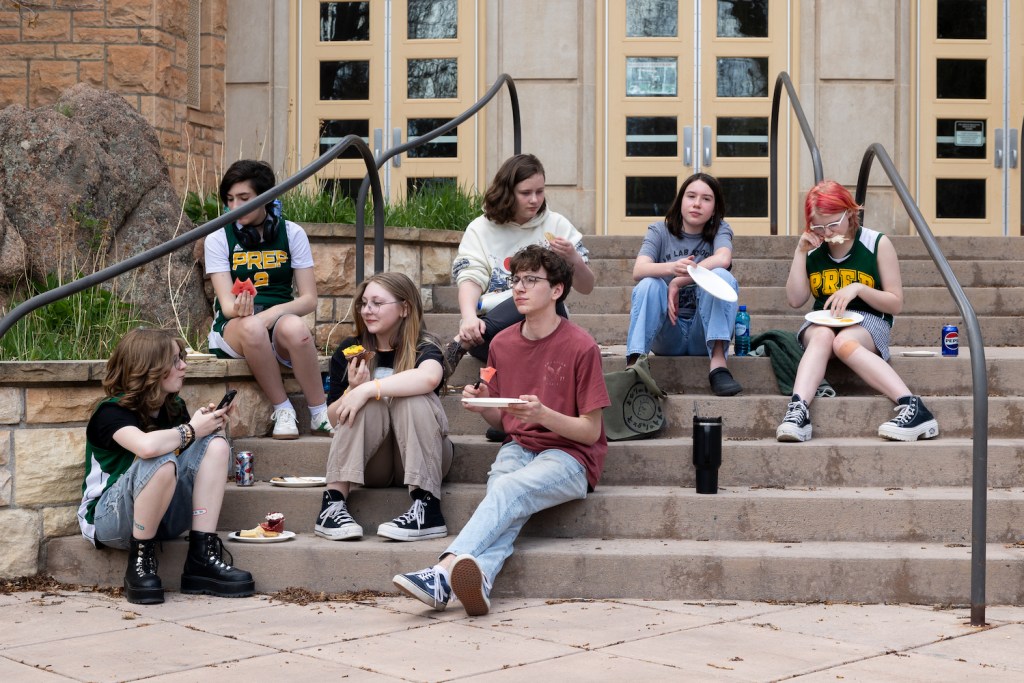
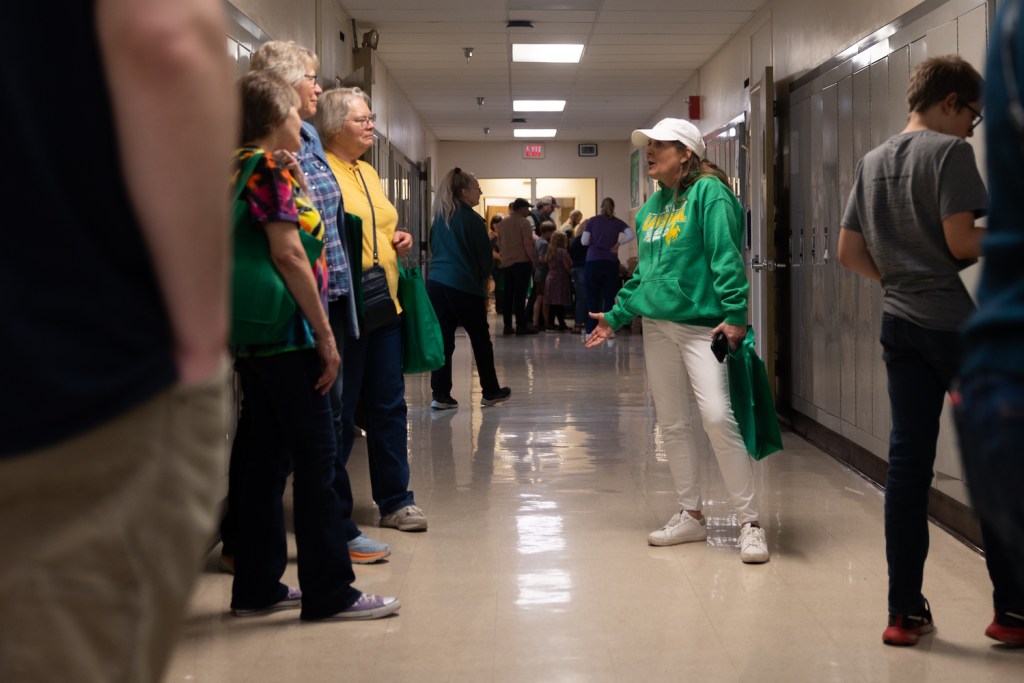
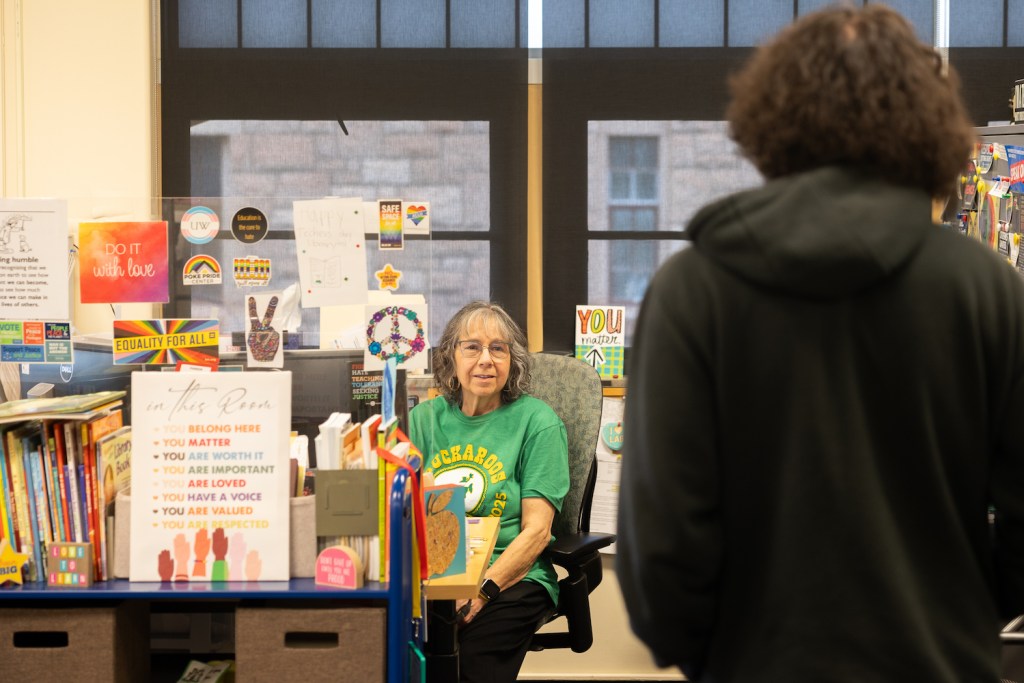
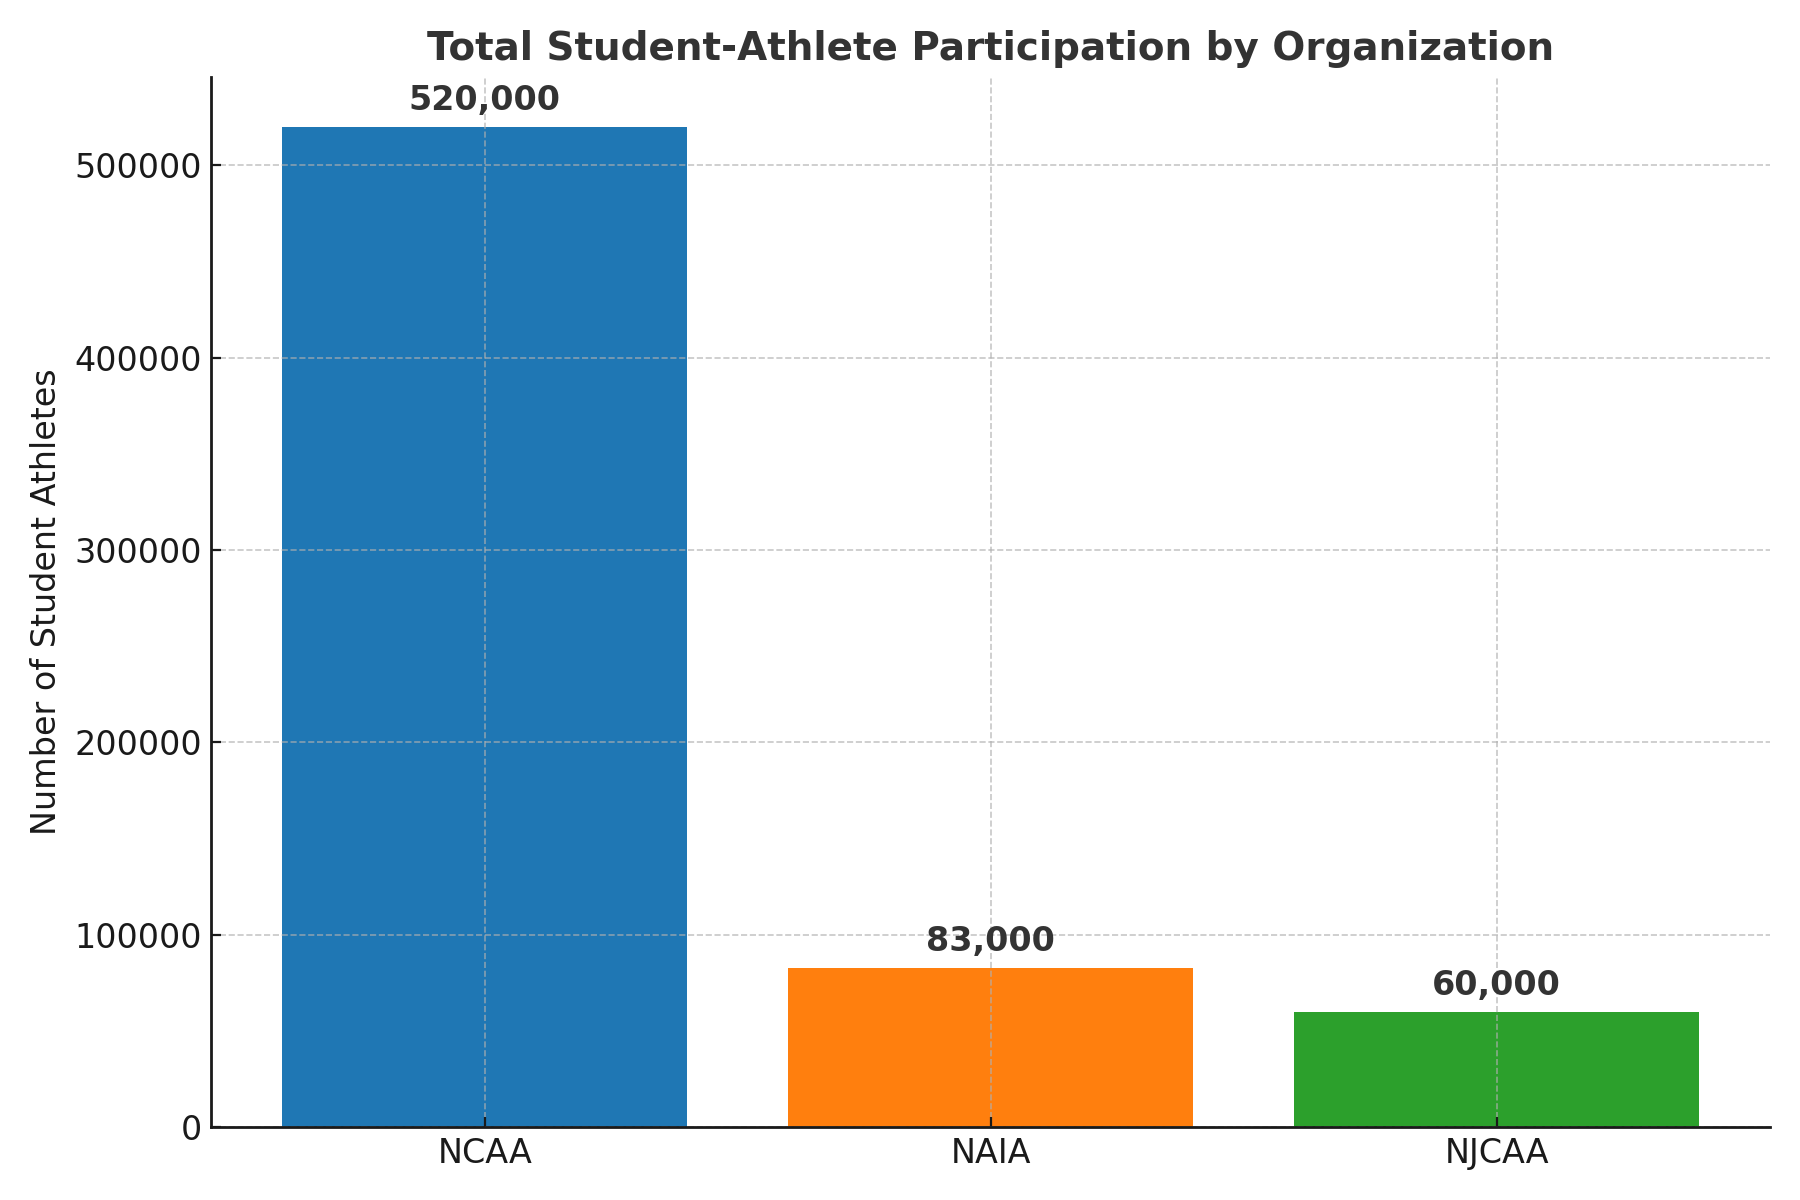


