Category: achievement gaps

  • New Jersey’s $40 Billion Education Machine Is Not Built to Teach

    New Jersey’s $40 Billion Education Machine Is Not Built to Teach

    Evan Scott is a lifelong New Jersey resident, a veteran, and a retired military service member. He holds a bachelor’s degree in education and was elected to his hometown’s Board of Education in 1988. Now living in Evesham Township, NJ, he continues to advocate for fair and transparent school funding.

    New Jersey spends about $40 billion each year on public education for roughly 1.3 million children. That’s one of the highest per-pupil spending levels in the country. We have a constitutional guarantee of a “thorough and efficient” education, a sophisticated school funding formula, a powerful state department of education, and layer upon layer of regulations and oversight.

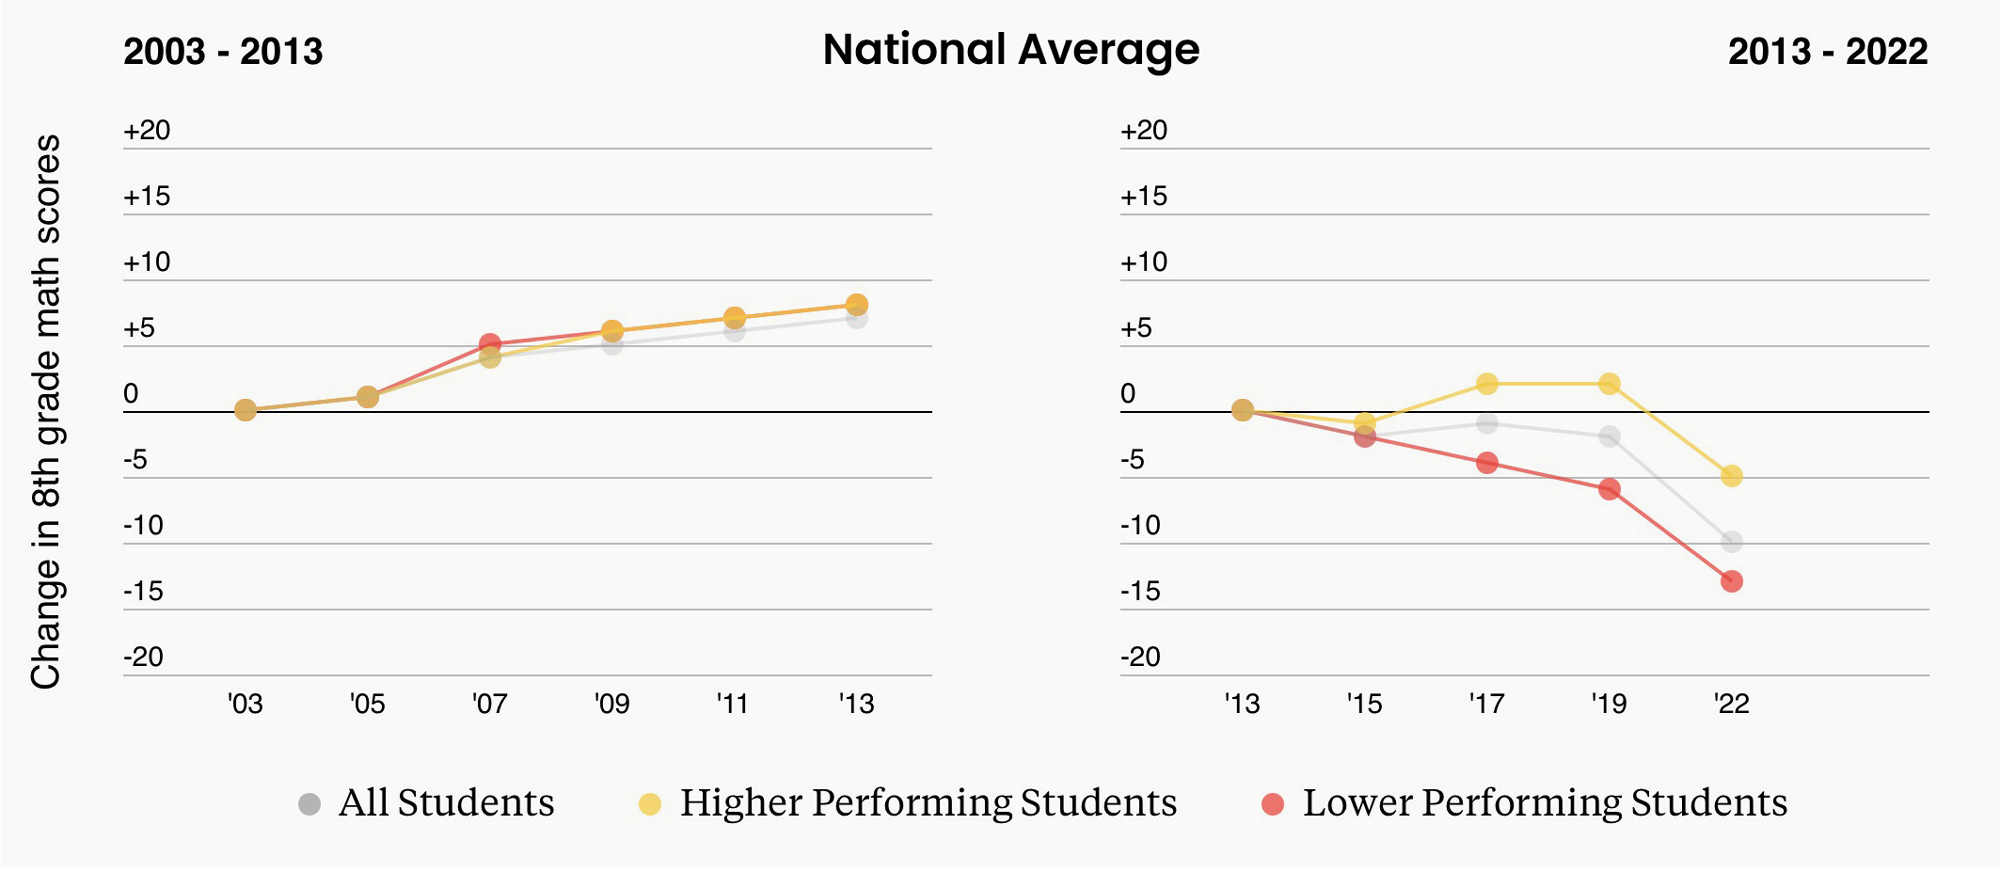
    And yet: our statewide test scores are still below pre-pandemic levels. Achievement gaps by race, income, disability, and language remain enormous. In some grades and subjects, they’re widening.

    If you built a machine to spend this much money and still fail to close gaps year after year, it would look exactly like New Jersey’s education system.

    The System Optimizes for the Wrong Thing

    On paper, New Jersey’s education system is supposed to deliver a thorough and efficient education for every child, with equity across race and income, leading to college and career readiness.

    In practice, the system optimizes for compliance with regulations, political stability, and avoiding lawsuits and strikes.

    The proof is everywhere. We produce beautiful policy documents, voluminous regulations, complex aid tables, and endless reports. But ask a simple question — “what exactly are we doing differently in classrooms to get more third graders reading on grade level?” — and the answers get vague fast.

    We have built a machine to show we are doing something. We have not built a machine engineered to maximize student learning.

    $40 Billion Is Not $40 Billion of Teaching

    That enormous figure pays for instruction, sure. But also: support services, administration, operations and maintenance, transportation and food, debt, pensions, and legacy costs. Nationally, barely half of K-12 spending reaches the classroom as direct instruction. New Jersey is no exception.

    The problem isn’t that buses or nurses are wasteful. The problem is this: we are spending tens of billions of dollars through a system that does not prioritize the highest-impact instructional uses of the next dollar.

    New money goes first to contractual raises, benefit increases, new programs layered on old ones without evaluation, and rising facility costs. Almost none of this is evaluated through the brutal question a serious system would ask: “If we invest this next $100 million, what evidence says it will move reading and math outcomes for our most vulnerable students?”

    We don’t ask that. We just roll the machine forward.

    The State Knows Better—But Only in Science

    The Department of Education has already shown us what a more serious approach looks like. On its own website, NJDOE concedes that less than 20 percent of classroom materials are aligned to standards in science, and has responded by building a Model Science Curriculum around vetted, high-quality resources.

    In other words: the Department knows that standards alone are not enough. Teachers need specific, evidence-based materials, and many districts aren’t getting them on their own.

    But why only science? Our most urgent gaps are in early reading and middle-grades math. If the Department can curate model units for science, it can create a K-3 literacy framework aligned with the science of reading and a model math sequence built around proven materials.

    Instead, New Jersey treats curriculum as a hyper-local, 600-district procurement hobby — and then acts surprised when quality is all over the map and only half our students read or do math on grade level.

    600 Districts, Zero Instructional Coherence

    New Jersey has hundreds of school districts, each with its own superintendent, business administrator, HR department, and curriculum staff. Many are tiny. Above them sits NJDOE and county superintendents, responsible for standards, accountability, and oversight.

    What does the state actually control? It sets standards, not curriculum. Districts must “align” to the New Jersey Student Learning Standards, but the state does not mandate or approve specific programs.

    The result: strong standards and a huge compliance apparatus at the top. A fragmented, district-by-district free-for-all in curriculum and instruction at the bottom.

    Contrast that with Mississippi and Louisiana, which have seen real gains in early reading. Their state agencies didn’t stop at standards. They rated and recommended specific curricula aligned to the science of reading. They tied professional development to those exact materials. They used state power to make instructional coherence non-negotiable in early grades.

    New Jersey has allowed 600 different answers to “what does reading instruction look like in K-3?” and then acts surprised when results are uneven and gaps persist.

    Our administrative machine is big enough to boss districts around on paperwork and testing windows. It is somehow too shy to insist on evidence-based literacy instruction for six-year-olds.

    SFRA: A Formula Without a Steering Wheel

    New Jersey’s School Funding Reform Act is, in theory, a rational way to calculate how much each district needs, with extra weights for poverty, language, and special education.

    But SFRA answers “how much?” It says almost nothing about “for what?”

    You can be billions closer to full funding and still have districts spending above adequacy with mediocre outcomes, districts below adequacy left on their own to figure out interventions, and no systematic connection between spending patterns and student outcomes.

    SFRA is a clever formula for filling tanks. It is not a steering wheel.

    A System That Protects Itself Better Than It Protects Children

    Step back and the obscenity becomes stark:

    We tolerate enormous fixed administrative overhead spread across hundreds of districts that could consolidate or share services. We accept a patchwork of curricula in early literacy even as other states prove you can do better. We pour in new money with minimal discipline about which interventions actually work. We allow graduation standards to be quietly lowered so statistics look smoother.

    All of this is defended in the name of “local control,” “flexibility,” and “respecting stakeholders.”

    Meanwhile, a third grader in Trenton is still far less likely to read on grade level than a third grader in a wealthy suburb — despite living in one of the highest-spending education systems on Earth.

    New Jersey’s system is extremely good at sustaining itself. It is not nearly good enough at changing itself when children are not learning.

    What a First-Principles Reset Would Look Like

    If we were designing a $40 billion system for learning, rather than inheriting a $40 billion system of habits:

    Clear, public goals. By 2030: 80% of third graders reading proficiently, with racial and income gaps below 10 percentage points. By 8th grade: 70% proficient in math, same gap constraint. By graduation: diplomas tied to real college and career readiness benchmarks.

    Evidence-based spending rules. The next billion in state aid goes first to high-dosage tutoring for students below proficiency, smaller K-3 class sizes in high-poverty schools, literacy and math coaches tied to vetted curricula, and high-quality pre-K expansion. Not to automatic expansion of everything we already do.

    State leadership on curriculum. NJDOE should review and rate K-8 ELA and math curricula and publish a short list of high-quality options. Professional development should be built around those choices. Districts can still choose — but from good choices.

    Rationalized administration. Require consolidation and shared services where appropriate. Reinvest savings into classroom-facing roles: teachers, aides, interventionists, counselors.

    Real accountability for results. Public dashboards showing, for each district: spending per pupil broken out by category, proficiency rates and gaps by subgroup, and whether things are improving. Tie flexibility and funding to demonstrated ability to turn dollars into learning.

    The Courage We Actually Need

    New Jersey doesn’t need one more glossy plan or press release celebrating “investments in education.” It needs the political courage to admit that our current system is not designed to do the thing we say we value most.

    It will take courage to challenge the sacredness of local administrative fiefdoms. To tell high-spending districts that dollars above adequacy must be justified by outcomes. To insist that early literacy is not a matter of preference but of evidence. To rebuild NJDOE from compliance cop to instructional engine.

    We are not a poor state. We are not a low-spending state. Our children’s struggles are not about scarcity. They are about design — the design of a system that has learned to protect adults, institutions, and routines more effectively than it has learned to teach children to read, write, and think.

    Source link

  • Taking Intermittent Quizzes Reduces Achievement Gaps & Enhances Online Learning – The 74

    Taking Intermittent Quizzes Reduces Achievement Gaps & Enhances Online Learning – The 74

    Inserting brief quiz questions into an online lecture can boost learning and may reduce racial achievement gaps, even when students are tuning in remotely in a distracting environment.

    That’s a main finding of our recent research published in Communications Psychology. With co-authors Dahwi Ahn, Hymnjyot Gill and Karl Szpunar, we present evidence that adding mini-quizzes into an online lecture in science, technology, engineering or mathematics – collectively known as STEM – can boost learning, especially for Black students.

    In our study, we included over 700 students from two large public universities and five two-year community colleges across the U.S. and Canada. All the students watched a 20-minute video lecture on a STEM topic. Each lecture was divided into four 5-minute segments, and following each segment, the students either answered four brief quiz questions or viewed four slides reviewing the content they’d just seen.

    This procedure was designed to mimic two kinds of instructions: those in which students must answer in-lecture questions and those in which the instructor regularly goes over recently covered content in class.

    All students were tested on the lecture content both at the end of the lecture and a day later.

    When Black students in our study watched a lecture without intermittent quizzes, they underperformed Asian, white and Latino students by about 17%. This achievement gap was reduced to a statistically nonsignificant 3% when students answered intermittent quiz questions. We believe this is because the intermittent quizzes help students stay engaged with the lecture.

    To simulate the real-world environments that students face during online classes, we manipulated distractions by having some participants watch just the lecture; the rest watched the lecture with either distracting memes on the side or with TikTok videos playing next to it.

    Surprisingly, the TikTok videos enhanced learning for students who received review slides. They performed about 8% better on the end-of-day tests than those who were not shown any memes or videos, and similar to the students who answered intermittent quiz questions. Our data further showed that this unexpected finding occurred because the TikTok videos encouraged participants to keep watching the lecture.

    For educators interested in using these tactics, it is important to know that the intermittent quizzing intervention only works if students must answer the questions. This is different from asking questions in a class and waiting for a volunteer to answer. As many teachers know, most students never answer questions in class. If students’ minds are wandering, the requirement of answering questions at regular intervals brings students’ attention back to the lecture.

    This intervention is also different from just giving students breaks during which they engage in other activities, such as doodling, answering brain teaser questions or playing a video game.

    Why it matters

    Online education has grown dramatically since the pandemic. Between 2004 and 2016, the percentage of college students enrolling in fully online degrees rose from 5% to 10%. But by 2022, that number nearly tripled to 27%.

    Relative to in-person classes, online classes are often associated with lower student engagement and higher failure and withdrawal rates.

    Research also finds that the racial achievement gaps documented in regular classroom learning are magnified in remote settings, likely due to unequal access to technology.

    Our study therefore offers a scalable, cost-effective way for schools to increase the effectiveness of online education for all students.

    What’s next?

    We are now exploring how to further refine this intervention through experimental work among both university and community college students.

    As opposed to observational studies, in which researchers track student behaviors and are subject to confounding and extraneous influences, our randomized-controlled study allows us to ascertain the effectiveness of the in-class intervention.

    Our ongoing research examines the optimal timing and frequency of in-lecture quizzes. We want to ensure that very frequent quizzes will not hinder student engagement or learning.

    The results of this study may help provide guidance to educators for optimal implementation of in-lecture quizzes.

    The Research Brief is a short take on interesting academic work.

    This article is republished from The Conversation under a Creative Commons license. Read the original article.

    Source link

  • Across All Ages & Demographics, Test Results Show Americans Are Getting Dumber – The 74

    Across All Ages & Demographics, Test Results Show Americans Are Getting Dumber – The 74


    Get stories like this delivered straight to your inbox. Sign up for The 74 Newsletter

    There’s no way to sugarcoat it: Americans have been getting dumber.

    Across a wide range of national and international tests, grade levels and subject areas, American achievement scores peaked about a decade ago and have been falling ever since. 

    Will the new NAEP scores coming out this week show a halt to those trends? We shall see. But even if those scores indicate a slight rebound off the COVID-era lows, policymakers should seek to understand what caused the previous decade’s decline. 

    There’s a lot of blame to go around, from cellphones and social media to federal accountability policies. But before getting into theories and potential solutions, let’s start with the data.

    Until about a decade ago, student achievement scores were rising. Researchers at Education Next found those gains were broadly shared across racial and economic lines, and achievement gaps were closing. But then something happened, and scores started to fall. Worse, they fell faster for lower-performing students, and achievement gaps started to grow.

    This pattern shows up on test after test. Last year, we looked at eighth grade math scores and found growing achievement gaps in 49 of 50 states, the District of Columbia and 17 out of 20 large cities with sufficient data.

    But it’s not just math, and it’s not just NAEP. The American Enterprise Institute’s Nat Malkus has documented the same trend in reading, history and civics. Tests like NWEA’s MAP Growth and Curriculum Associates’ i-Ready are showing it too. And, as Malkus found in a piece released late last year, this is a uniquely American problem. The U.S. now leads the world in achievement gap growth.

    What’s going on? How can students here get back on track? Malkus addresses these questions in a new report out last week and makes the point that any honest reckoning with the causes and consequences of these trends must account for the timing, scope and magnitude of the changes.

    Theory #1: It’s accountability

    As I argued last year, my top explanation has been the erosion of federal accountability policies. In 2011 and 2012, the Obama administration began issuing waivers to release states from the most onerous requirements of the No Child Left Behind Act. Congress made those policies permanent in the 2015 Every Student Succeeds Act. That timing fits, and it makes sense that easing up on accountability, especially for low-performing students, led to achievement declines among those same kids.

    However,  there’s one problem with this explanation: American adults appear to be suffering from similar achievement declines. In results that came out late last year, the average scores of Americans ages 16 to 65 fell in both literacy and numeracy on the globally administered Program for the International Assessment of Adult Competencies. 

    And even among American adults, achievement gaps are growing. The exam’s results are broken down into six performance levels. On the numeracy portion, for example, the share of Americans scoring at the two highest levels rose two points, from 10% to 12%, while the percentage of those at the bottom two levels rose from 29% to 34%. In literacy, the percentage of Americans scoring at the top two levels fell from 14% to 13%, while the lowest two levels rose from 19% to 28%. 

    These results caused Peggy Carr, the commissioner of the National Center for Education Statistics, to comment, “There’s a dwindling middle in the United States in terms of skills.” Carr could have made the same comment about K-12 education —  except that these results can’t be explained by school-related causes.

    Theory #2: It’s the phones

    The rise of smartphones and social media, and the decline in reading for pleasure, could be contributing to these achievement declines. Psychologist Jean Twenge pinpointed 2012 as the first year when more than half of Americans owned a smartphone, which is about when achievement scores started to decline. This theory also does a better job of explaining why Americans of all ages are scoring lower on achievement tests.

    But there are some holes in this explanation. For one, why are some of the biggest declines seen in the youngest kids? Are that many 9-year-olds on Facebook or Instagram? Second, why are the lowest performers suffering the largest declines in achievement? Attention deficits induced by phones and screens should affect all students in similar ways, and yet the pattern shows the lowest performers are suffering disproportionately large drops.

    But most fundamentally, why is this mostly a U.S. trend? Smartphones and social media are global phenomena, and yet scores in Australia, England, Italy, Japan and Sweden have all risen over the last decade. A couple of other countries have seen some small declines (like Finland and Denmark), but no one has else seen declines like we’ve had here in the States.

    Other theories: Immigration, school spending or the Common Core

    Other theories floating around have at least some kernels of truth. Immigration trends could explain some portion of the declines, although it’s not clear why those would be affecting scores only now. The Fordham Institute’s Mike Petrilli has partly blamed America’s “lost decade” on economic factors, but school spending has rebounded sharply in recent years without similar gains in achievement. Others, including historian Diane Ravitch and the Pioneer Institute’s Theodor Rebarber, blame the shift to the Common Core state standards, which was happening about the same time. But non-Common Core states suffered similar declines, and scores have also dropped in non-Common Core subjects.

    Note that COVID is not part of my list. It certainly exacerbated achievement declines and reset norms within schools, but achievement scores were already falling well before it hit America’s shores.

    Instead of looking for one culprit, it could be a combination of these factors. It could be that the rise in technology is diminishing Americans’ attention spans and stealing their focus from books and other long-form written content. Meanwhile, schools have been de-emphasizing basic skills, easing up on behavioral expectations and making it easier to pass courses. At the same time, policymakers in too many parts of the country have stopped holding schools accountable for the performance of all students.

    That’s a potent mix of factors that could explain these particular problems. It would be helpful to have more research to pinpoint problems and solutions, but if this diagnosis is correct, it means students, teachers, parents and policymakers all have a role to play in getting achievement scores back on track. 


    Get stories like these delivered straight to your inbox. Sign up for The 74 Newsletter

    Source link