Category: Budgets

  • Provincial Budgets 2025-26 | HESA

    Provincial Budgets 2025-26 | HESA

    Ok everyone, all the provincial budgets are in and so it’s time for our annual look at what another round of irresponsible pan-partisan political leadership has wrought for our sector for the next twelve months.

    Figure 1 shows the province-by-province breakdown of this year’s budgets, showing the change in transfers to institutions in real dollars over 1 year and 5 years for each of the ten provinces. In most provinces, collecting this data is pretty easy—you just look at the Main Estimates. In Ontario it is more difficult because due to the Ministry of Finance’s crapulous incompetence, it is the one province in the country where Estimates do not appear on the day of the budget (it takes them several months to put out the detailed data; and while prior to 2018 the Ministry of Colleges and Universities was able to give out actual expenditure data on the day of the Budget, the Government no longer chooses to provide such information because shovel, manure, mushrooms, etc.). So in Ontario what you have to do is collect the previous year’s data, add the announced changes in expenditure, and then make some assumptions about the way funds are phased in (because the communications jackals who have taken over public budgeting in this province insist on phrasing spending as “$750 million over five years” to make numbers as big as possible, rather than explaining how the $750 million will be phased in on an annual basis). Which is all to say, these numbers are all pretty accurate except for Ontario, where there is a bit of a margin of error.

    Figure 1: 1-year and 5-year Changes to Budgeted Provincial Transfers to Institutions, Canada, 2025-26 Budget Year

    The one province that shows big change for 2025-26 is Prince Edward Island, which dropped a lot of money on UPEI this year in order to start a new medical school. Five other provinces (British Columbia, Alberta, Manitoba, Ontario, and Newfoundland and Labrador saw real increases (that is, increases greater than the rate of inflation) this year of between 1 and 4%. Four other provinces (Saskatchewan, Quebec, New Brunswick, and Nova Scotia) saw real declines of between 1% and 3%. Altogether, that combined nationally for real growth in provincial spending of about 0.9%.

    Over a five-year horizon, things are a bit different. The oil provinces—Alberta, Saskatchewan, and Newfoundland and Labrador—have all shown double digit declines in real expenditures (19%, 11%, and 18%, respectively), the “big two” (Quebec and Ontario) are down seven and six per cent respectively, while Nova Scotia and New Brunswick are down eight and two percent respectively. The only provinces that are up are Manitoba, where just before leaving office the Tories reversed a huge portion of their cuts of the previous eight years or so, British Columbia, which build a new med school at Simon Fraser and decided to give hefty wage increases to university and college staff (which did not, in the end, leave universities and college much better off—see Vancouver Island University for evidence), and the afore-mentioned PEI. Nationally, the drop in spending after inflation was 4%, and obviously would have been much higher without that anomalous BC result.

    So what does the overall picture look like nationally? Well, take a look at Figure 2. Basically, the picture is one of long-term stagnation.

    Figure 2: Total Budgeted Provincial Expenditures on Post-Secondary Education, 2006-07 to 2025-2025, in Billions of Constant 2025 dollars

    I suppose I should also update some charts I first made available earlier this year, looking at expenditures on post-secondary education as a percentage of total government expenditures, which I do below in Figure 3. Across the country, these percentages are down a long way over the past fifteen years, particularly in Alberta, which has gone from being by far the biggest spender in 2008 to being below the national average now.

    Figure 3: Budgeted Provincial Expenditures on Post-Secondary Education as a Percentage of Total Budgeted Provincial Expenditures, Canada and selected provinces, 2006-07 to 2025-26.

    Now, your brain might be whirring a bit trying to would out how Figures 2 and 3 can both be true. Overall spending is down only gently, but PSE expenditures as a percentage are crashing? It’s easy to explain, but not intuitive if you believe all the left-wing CBC nonsense about how governments are in austerity mode. This is nonsense: Canadian provincial governments are absolutely NOT in austerity mode. In most provinces, overall spending is wayyy up. It’s just that they are not choosing to spend any of that on postsecondary education. Since COVID, overall government expenditure is up 20% after inflation; since 2008-09, when post-secondary education peaked as a percentage of total expenditures, it’s up 59% after inflation.

    Figure 4: Real Change in Total Provincial Expenditures vs. Provincial Expenditures on Post-Secondary Education 2006-07 to 2025-26 (2006-07 = 100)

    Got it? Provinces are still spending. They just aren’t spending on postsecondary education.

    Anyways, just to finish things off, figure 5 shows changes in overall provincial spending on student assistance programs. It’s up a bit this year mainly because of Ontario. Unclear why there has been a rise, though I suspect it has something to do with the ongoing crappiness in the youth job market (something I will get back to in a blog next week) and the need for student aid to backfill.

    Figure 5: Total Budgeted Provincial Expenditures on Student Financial Assistance, Canada 2006-07 to 2025-26, in Billions of Constant 2025 Dollars

    So that’s your 2025-26 budget round up. Not as bad as some previous years but man, our sector is in a bit of a whole and just can’t get out of it. The message, as always, is: no one is coming to save us.

    Source link

  • Probably not the next Laurentian, but…..

    Probably not the next Laurentian, but…..

    As I noted yesterday, there are only two institutions in Canada which have run deficits in each of the last five years: St. Thomas University (STU) and Vancouver Island University (VIU). In both instances, these institutions have had deficits averaging between 4 and 5% of their total income over the course of those five years. By any definition, this puts them on some kind of watch list.

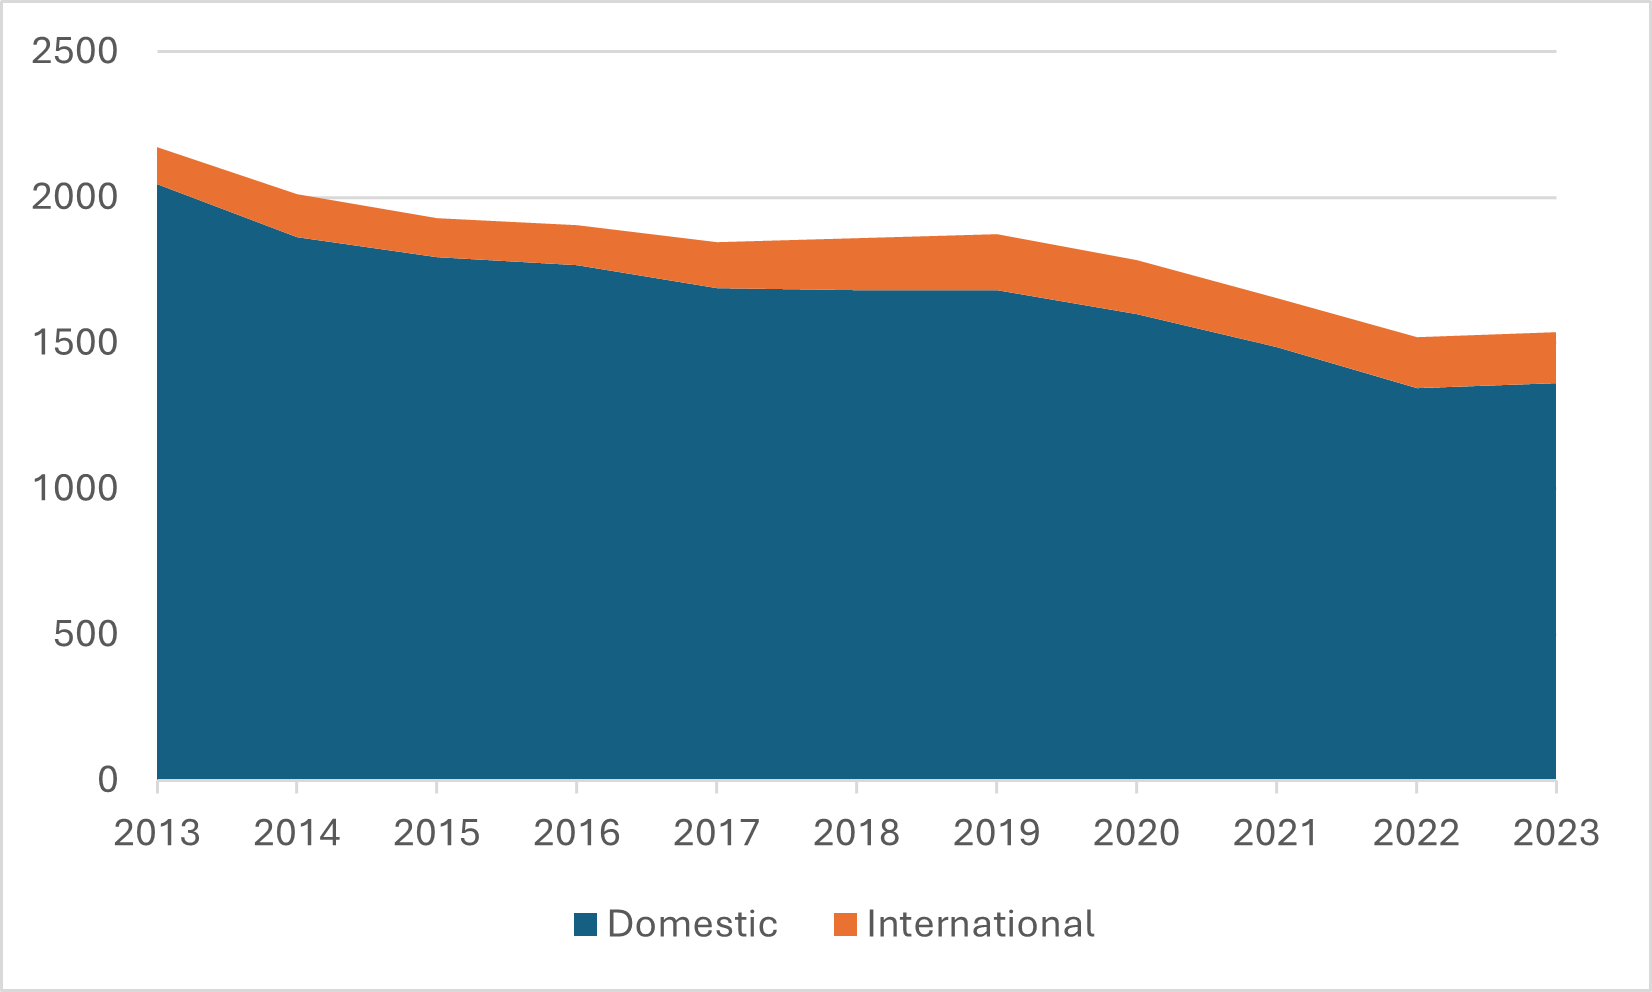
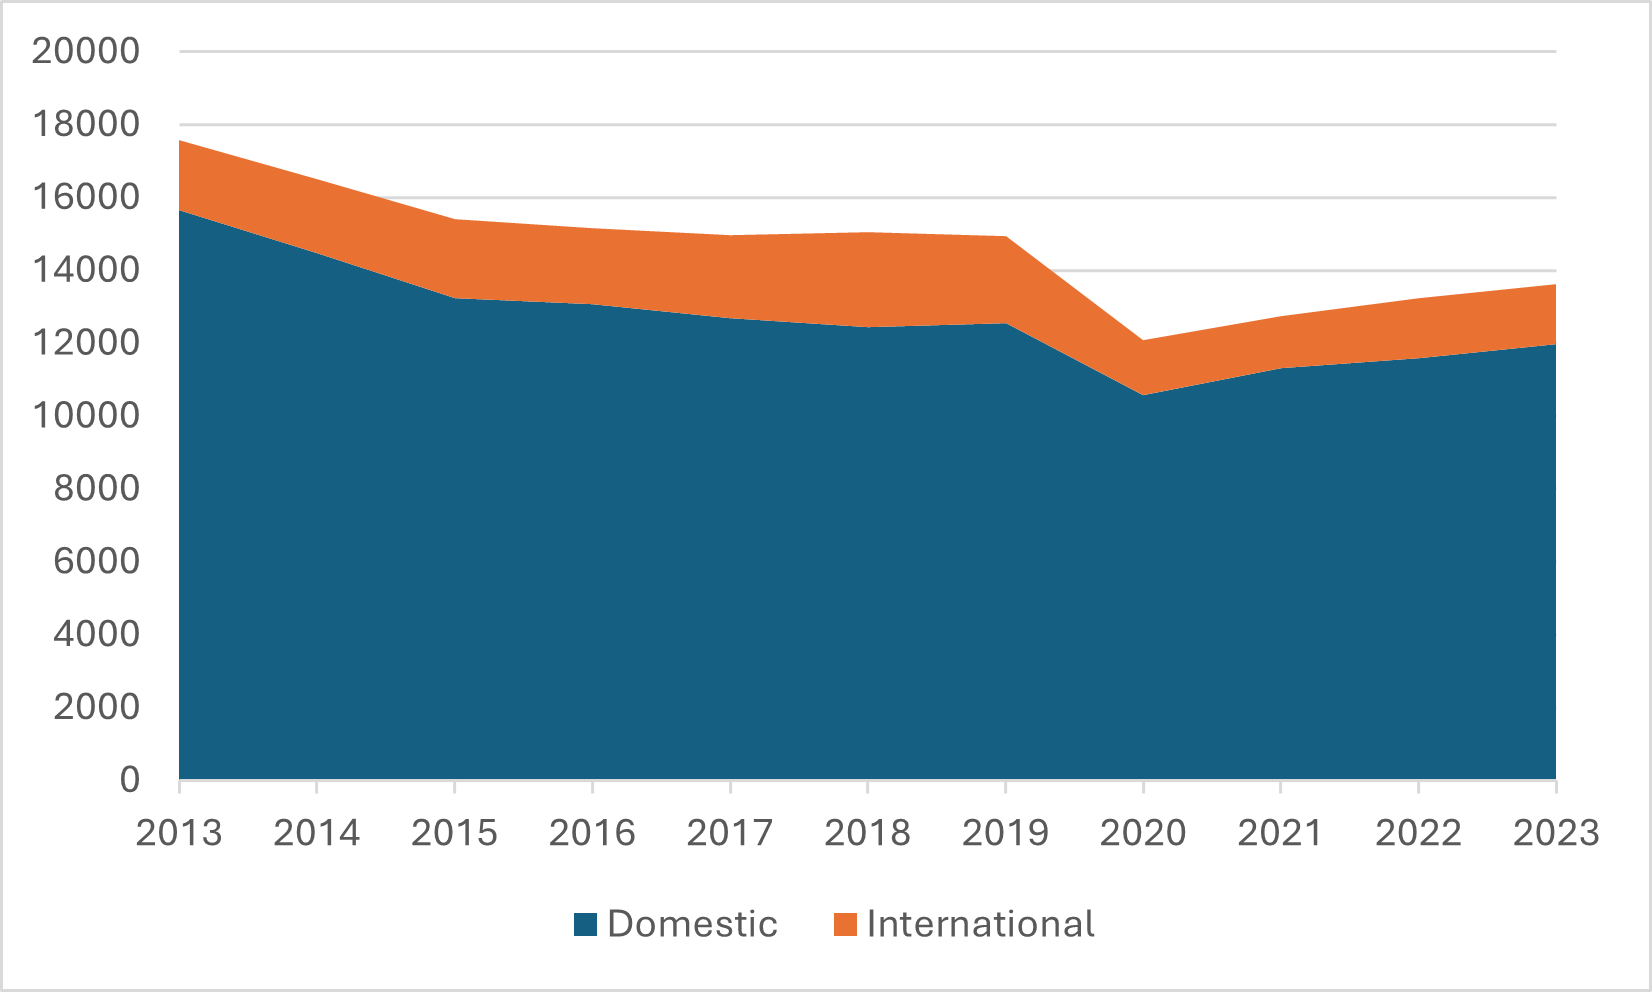
    As Figures 1 and 2 show, the root cause of both institutions’ problems is the same—namely, a big two-stage decline in enrolment. The first stage came in the early 10s, when the domestic youth population was shrinking, and the second came during Covid. The numbers are particularly bad at VIU, where the number of international students is down by over 35%. If these institutions could just get their enrolment numbers back to where they were in 2018, then STU’s tuition income would be about $3 million higher, while VIU’s would rise by roughly $20 million. In both cases, that would be enough to put the institutions well into the black. The much larger numbers at VIU are not just because it is a larger institution, but because the recent fall in student numbers is happening disproportionately on the international student side.

    Figure 1: Domestic and International Enrolment, St Thomas University, 2012-12 to 2022-23

    Figure 2: Domestic and International Enrolment, Vancouver Island University, 2012-12 to 2022-23

    At this point, folks, I am going to have to do something which some might find triggering, which is to invoke the L-word, because I am quite certain that everyone remembers the extent to which falling enrolment and a drop in tuition revenue were among the key elements in the collapse at Laurentian. I am not going to do this because I necessarily think either of these institutions is following the Laurentian path exactly. One very big dissimilarity is that neither STU nor VIU has any long-term debt, which was another of the key factors at work at Laurentian. Rather, I am doing it because I think at least some of the same dynamics are at play, particularly at VIU, which just happens to be about the same size as Laurentian in terms of enrolment and budget size, albeit without some of Laurentian’s big ambitions with respect to research. In fact, given the VIU/Laurentian similarity, I will concentrate the rest of this analysis on this west coast institution. I might come back to STU sometime, but for the moment, I will leave it aside.

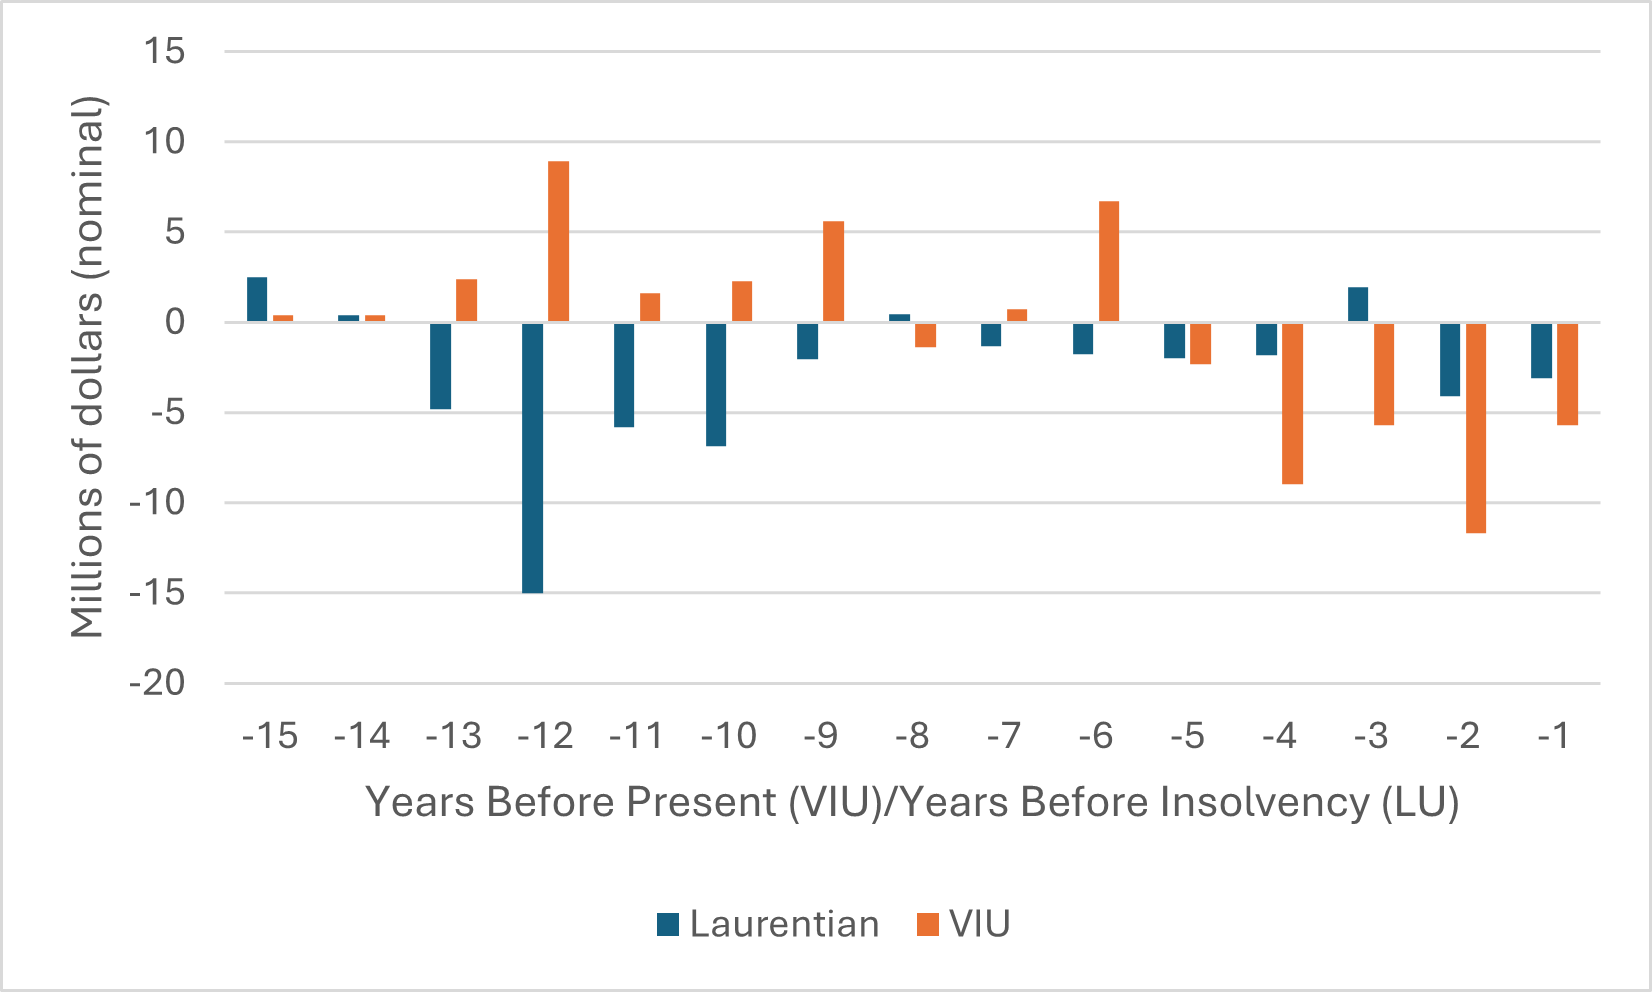
    Let’s start by looking at budget surpluses over time at VIU and Laurentian. Figure 3 shows the last fifteen years of VIU’s surpluses/deficits and compares them to the fifteen years prior to the insolvency declaration at Laurentian. Based simply on the last five years or so, there is no question that VIU is actually worse than Laurentian. The institution has spent $34 million more than it earned in the last five years; Laurentian, in contrast, was only $9 million in the red over a similar period prior to insolvency. But shift your eyes to the left of that graph for a minute, and you’ll see another difference: Laurentian ran deficits basically for most of the fifteen years prior to its events, whereas VIU was in pretty good shape. What that meant was that when the bad times started five years ago, VIU had a decent accumulated surplus to draw from. That is why the institution has been able to carry on over the past few years, but since it has now drawn down well over half of its accumulated surplus ($30.6 million in 2024, down from $78 million in 2018), that strategy doesn’t really have any more room to run.

    Figure 3: Long-term Record of Surpluses/Deficits, in Millions, Laurentian vs VIU

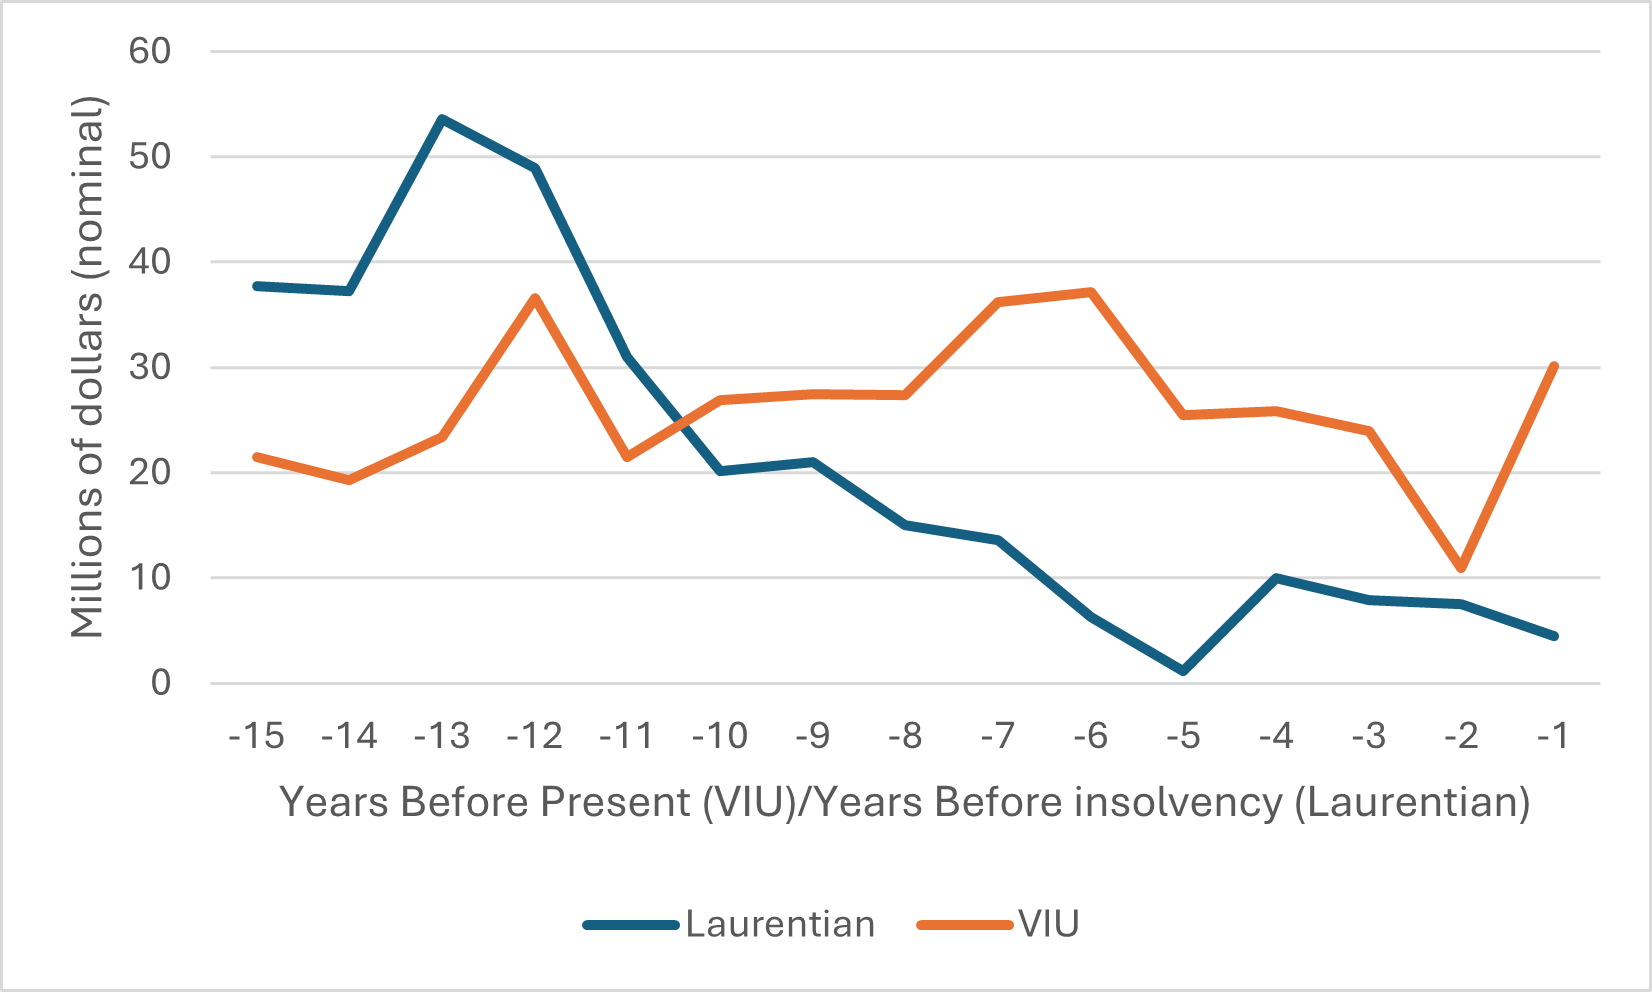
    There are also significant differences between the two institutions when you look at cash balances, as below in Figure 4. Laurentian was basically out of gas and surviving on fumes for several years prior to the collapse, with cash reserves barely enough to cover a couple of weeks of operating expenditures; VIU has never been anywhere near that point. However, note the big dip in VIU’s cash last year. It reversed itself, but only because the institution sold off a big chunk of portfolio investments precisely (I think) to boost cash reserves. There are warning signs here for sure, albeit nothing like Laurentian’s blaring klaxons.

    Figure 4: Long-term Record of Cash Position at End of Fiscal, in Millions, Laurentian vs VIU

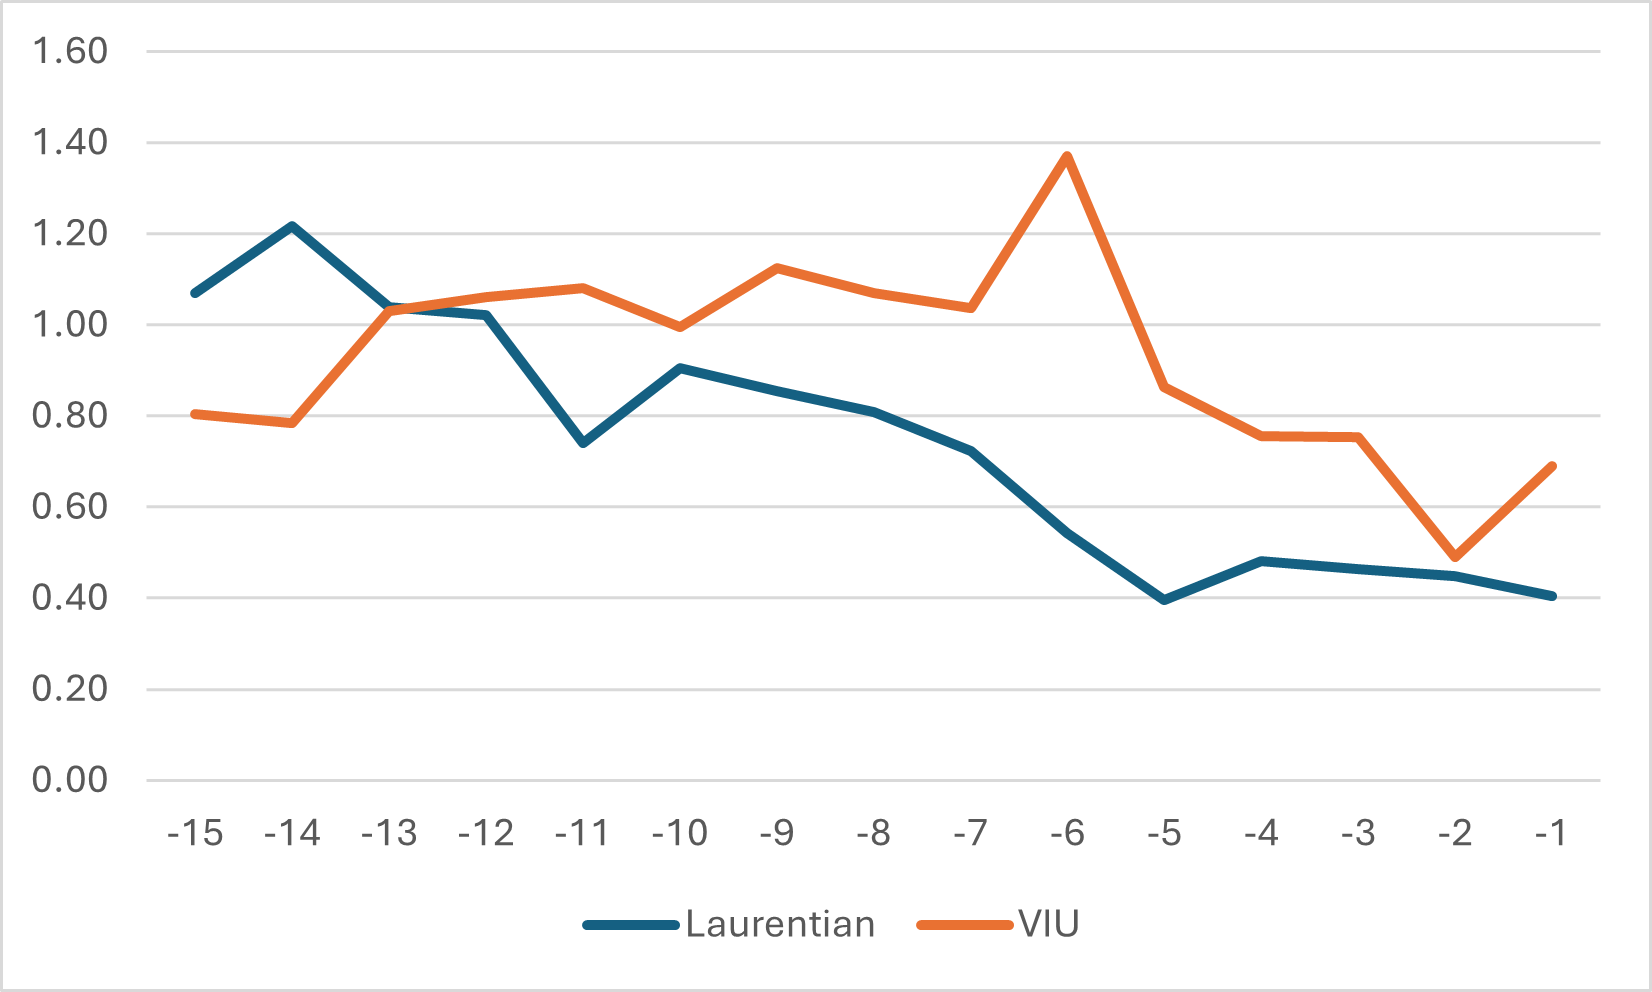
    The final comparison I want to make has to do with what is known as the “working capital ratio.” This is one of the key financial tests that the Government of Ontario uses to identify institutions in financial trouble, and it is the ratio between “current assets” (basically, cash plus accounts receivable) to current liabilities plus deferred contributions for research. Anything below a ratio of 1 puts you in the “high-risk” category.

    (Nota bene: some people think this ratio is not very useful because in a liquid market, institutions can move “long-term” investments to short-term fairly easily—as indeed VIU seems to have done last year when it sold off some of its portfolio investments in order to recharge cash reserves. However, since it’s an official government metric, it’s probably due a little respect, so I am using it here anyway.)

    One challenge in comparing VIU and Laurentian on the working capital metric is that they don’t quite calculate their liabilities identically, mainly because their respective provincial governments don’t ask them to categorize balance sheets in the same way. Specifically, VIU does not break out “current” from long-term liabilities, and also it lists substantial sums of tuition fees owed as “deferred revenue” while Laurentian does not. My read of this is therefore that to make the two sets of data on current liabilities comparable, one has to exclude from VIU’s numbers both “deferred capital contributions” and “deferred revenue”. Which is what I have done below in Figure 5.

    What Figure 5 shows is arguably similar to what Figure 3 shows: a metric in which a) neither institution looks particularly good, but b) Laurentian’s position is on the whole worse, and c) Laurentian’s deterioration is long and gradual while VIU’s is rather sharp.

    Figure 5: Long-term Record of Working Capital Ratios, Laurentian vs VIU

    To be crystal clear: I don’t think VIU is really on the verge of Laurentian-ing. It has no long-term debt. It has had a bigger cushion to fall back on. The province is on the verge of a youth boom, which should help a bit in bringing student numbers and revenues back up. It is working for a provincial government which is far more proactive than the frequently clueless one in Queen’s Park. And in fall 2023, it adopted a fairly aggressive if not especially strategic program of cost-cutting (ten percent for all units over three years), which in theory was supposed to right the ship.

    However:

    1. Even if VIU is not Laurentian, many of its key financial indicators look awfully familiar. From deficits to cash levels, to working cash ratios, it all seems very Mark Twain: history does not repeat, but it rhymes.
    2. That aggressive deficit reduction package didn’t reckon with Marc Miller, whose cuts to visas and policy of publicly crapping on the quality of Canadian institutions is likely to result in further drops in international student numbers and therefore reductions in income in the millions of dollars. There could still be problems ahead (I assume this may be what has been behind this week’s decision to consider suspending and/or cancelling roughly twenty programs at the diploma, undergraduate and graduate levels).
    3. The VIU community appears to be only dimly aware of how bad things are. When VIU President Deborah Saucier recently resigned, it was—according to CBC at least—because the VIU community would not support further cuts because they were not “supported by evidence.” Now, there may have been more to it than that (Lord knows CBC can be pretty crapulous at fact-checking post-secondary stories), but if it is anywhere near the truth, then the VIU community is clearly having some trouble facing a pretty serious reality, and that complicates any revival plan.

    Vancouver Island needs a second, flourishing undergraduate university and that can only be achieved through a strong financial base. Best wishes, therefore, to the folks at VIU as they grapple with these issues.

    Source link

  • Post-COVID University Surpluses (Deficits) | HESA

    Post-COVID University Surpluses (Deficits) | HESA

    Ok, everyone, buckle up. For I have been looking at university financial statements for 2023-24 and the previous few years, and I have Some Thoughts.

    In this exercise, I examined the financial statements from 2017-18 onwards for the 66 Canadian universities which are not federated with a larger institution and had income over $20 million. L’Université du Québec was excluded from the analysis below because it has yet to release financial statements for 2023-24.

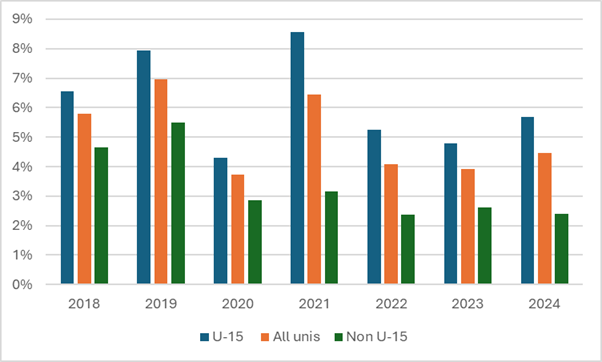
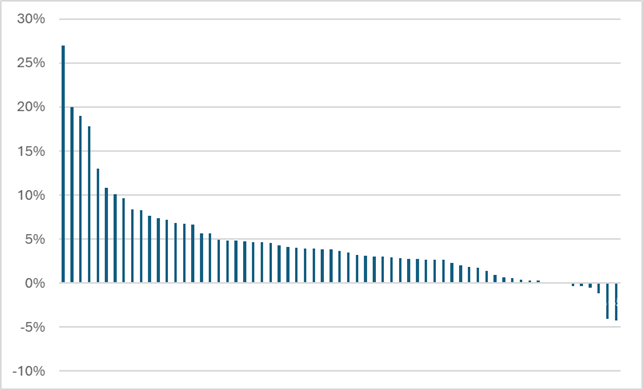
    Figure 1 shows the average net surplus (that is, total income minus total expenditures as a percentage of total income) across all institutions for the fiscal years 2017-18 to 2023-24. As is evident from the graph, fiscal years 2018 through 2021 were all pretty good, apart from 2020 (the stock market did its COVID tank right at the end of the fiscal year and radically reduced investment returns that year), and overall surpluses were in the 6% range, which is not bad. But post-COVID, things got a bit rough, and the returns dropped to about 4%. Note, though, that there is a significant gap between the “big beasts” of the Canadian university scene and everyone else. In the good years, U15 institutions, which in financial terms represent about 60% of the system, saw surpluses about two percentage points higher than non-U15 institutions. Since 2022, the gap has been about three percentage points.

    Figure 1: Average Surpluses as a Percentage of Total Income, Canadian Universities, Fiscal Years 2018 to 2024

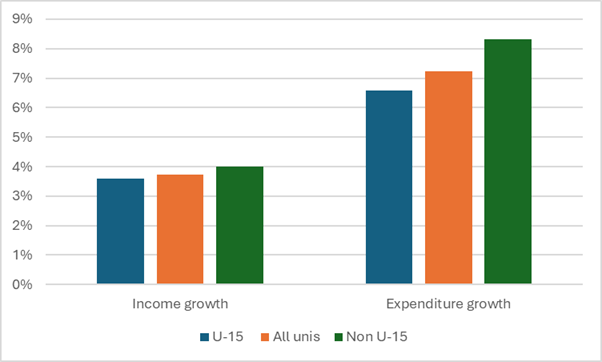
    Why have surpluses shrunk in the past few years? No surprise here: it is simply that costs have increased by about 7% in real terms for the past five years (that is about 1.4% above inflation each year), while revenues have only grown 3.7% (0.75% above inflation each year). Income growth has been pretty similar across U15 and non-U15 institutions, but expenditure growth has been significantly larger at non-U15 institutions.

    Figure 2: 5-year real change in Income and Expenditure, Canadian Universities, 2018-19 to 2023-24

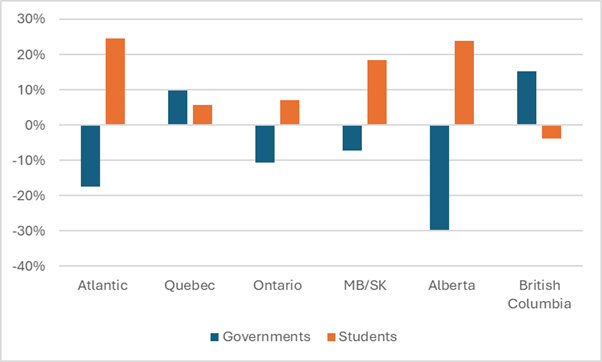
    It is worth pointing out here, though, that all of this data is from before any of the effects of the international student visa cap of 2024 come into play. In eight out of ten provinces, it has been income from students that has driven universities’ revenue growth over the past five years. Only in Quebec and British Columbia has government spending been the main driver (and yes, I know, the idea that revenue from students is declining in British Columbia was a bit shocking to me too, but I triple-checked and its true—this is the one part of the country where international student revenue was falling even before Marc Miller started swinging his axe around).

    Figure 3: 5-year real change in Income by Source and Region, Canadian Universities, 2018-19 to 2023-24

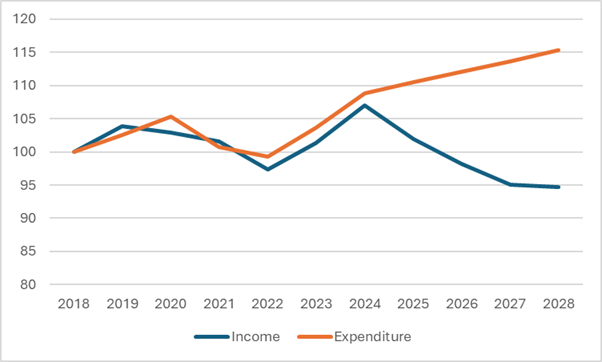
    If you assume that international student numbers overall drop by 40% over three years (which is roughly what the government says it wants to achieve), then what we are likely is a decrease of about 11% in total university revenues between now and 2027 (assuming no other changes in enrolment or tuition fees, and an annual increase in government expenditures of inflation plus 1% which is what we saw in last year’s budget cycle but I wouldn’t necessarily bet on it for the future). Meanwhile, if we keep expenditures increasing at inflation plus 1.5%, we will see an increase in expenditures of about 6% by 2028. The result is what I would call a trulyyawning financial gap over the next four years. And it is precisely this that keeps senior admins up at night.

    Figure 4: Projected changes in Income and Expenditure, Canadian Universities, 2017-18 to 2027-28, Indexed to 2017-18

    Now to be clear, I don’t expect the sector to be posting multi-billion dollar gaps implied by Figure 4 (for clarity: while Figure 4 displays changes in projected income and expenditure in index terms, if the gap that opens up between 2024 and 2028 is as depicted here, the change in net position for universities will be equal to about $7 billion in 2028, which given current surpluses of $2 billion/year implies aggregate deficits of about $5 billion/year or about 11% of total income). The income drop will probably not be quite this bad, both because I expect institutions to raise fees on international students, and because I suspect international student numbers will not fall quite this far because provinces will re-distribute spots going unused by colleges (due to the reduction in enrolments that will ensure from last fall’s changes to the post-graduate work visa program). Similarly, the increase in expenditures won’t be this high either because institutions are going to do all they can to “bend the curve” in anticipation of a fall in revenues. But bottom line: there’s a looming $5 billion income gap that has to be closed just to stay in balance, and larger if we want the system to have at least some surpluses for rainy (rainier?) days in future.

    Anyways, back to the present. We can, of course, drill down to the institutional level, too. At this point in the exercise, I have chosen to exclude two more institutions from my calculations. The first is Concordia because it has a unique (and IMHO really irritating) practice of splitting its financial reporting between the institution and its “Foundation” (don’t ask), with the result that the institution’s financial statements alone tend to show the institution as worse off than it really is. The second is Royal Roads, which uniquely took a stonking great write-down on capital investments in 2024 and so frankly looks a lot worse than I think it should.

    So with our sample now down to just 63 institutions, Table 1 shows that in fact most universities have been doing OK over the past few years. Of the institutions included in this part of the analysis, 39 have been deficit-free since 2021-22, and 28 have not shown a deficit in any of the last five years. However, there are three institutions where it might be time to start worrying: Carleton, which has posted three consecutive deficits, and St. Thomas and Vancouver Island University, which have posted deficits in each of the past five years. Carleton is a little bit less worrisome than the other two because it socked away some huge surpluses in the years prior to 2022 and so has a little bit more runway. I’ll come back to the other two in a moment.

    Years in deficit Since 2019-20 Since 2021-22
    5 2
    4 0 n/a
    3 6 3
    2 13 7
    1 16 16
    0 28 39

    Figure 5, below, shows combined net surplus over the past five fiscal years (2019-20 to 2023-24) as a percentage of total revenues. There are eight institutions which have net losses over the past five years, and another eight with surpluses between 0 and 2% of total revenues, which I would characterize as “precarious.” There are another 29 institutions with combined five-year surpluses, which are between 2 and 5% of total revenues, which are not great but not in the immediate danger zone either. Finally, there are 18 institutions with surpluses of 5% or more, which I would characterize as being “safe,” including two (Algoma and Cape Breton) which have five-year surplus rates of over 20% (this is what happens when your student body is 75%+ international)

    Figure 5: Distribution of 5-year aggregate net surpluses, Canadian Institutions, 2019-20 to 2020-24

    But note the right-hand side of that graph. There are two institutions that have five-year deficits equal to more than 4% of their total revenues. And those two are the same two that have posted deficits for each of the past five years: St. Thomas University in New Brunswick and Vancouver Island University in British Columbia. I’ll talk about them in a bit more depth tomorrow.

    Source link

  • Check-in on Administrative Bloat, 2025 Edition

    Check-in on Administrative Bloat, 2025 Edition

    Check-in on Administrative Bloat, 2025 Edition

    It’s been a little over five years since I took a serious dive into the question of “administrative bloat,” which apparently exists everywhere but in the statistics. Still, always good to check assumptions every once in a while, and I thought five years was long enough to make a new look at the data worthwhile. So here goes:

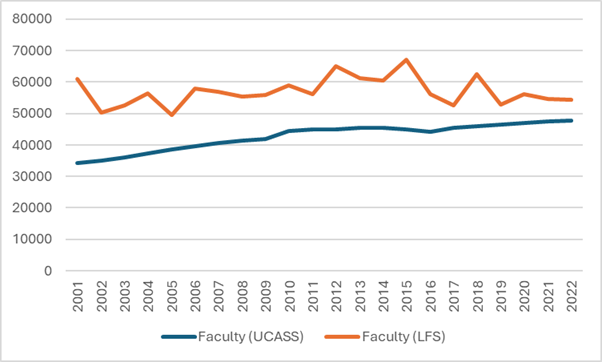
    Let’s start by reviewing what we can and cannot know about staffing at Canadian universities. StatsCan tracks the number of permanent ranked faculty pretty accurately through its University and College Academic Staff Survey (UCASS), and in a loosey-goosier fashion through the Labour Force Survey. The latter gives much higher numbers than the former, as shown below in Figure 1, which compares the number of “ranked” academics from UCASS with the number of permanent, full-time academics from the LFS.

    Figure 1 – Full-time Academic Staff Numbers According to LFS and UCASS

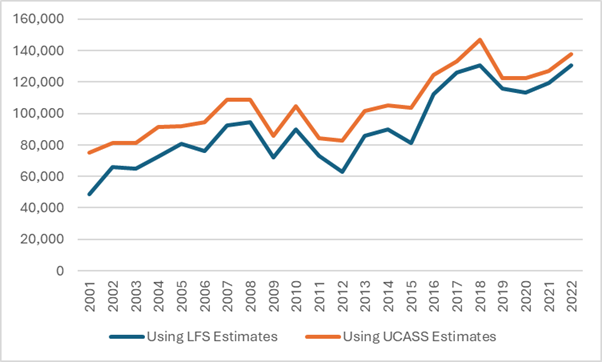
    StatsCan also tracks the total number of employees—both salaried and hourly—in the university sector using the Survey of Employment, Payroll and Hours (SEPH). However, in theory, if you subtract the number of FT academic staff from the number of total staff, you should be able to get the total number of non-academic staff, right? Well, unfortunately, this is where the discrepancy between UCASS and LFS runs into some problems. In Figure 2, I show the implied number of non-academics using both methods. The growth rates are different because of the difference in observations in the early period, but the two estimates do both converge on the observation that there are about 130,000 non-academic staff at Canadian universities, or about two and a half times the complement of academic staff.

    Figure 2 – Implied Non-Academic Staff Numbers using SEPH, LFS and UCASS

    So, that’s evidence of bloat, right? Well, maybe. Personally, what I take from Figure 2 is that either (or both) the LFS numbers and the SEPH numbers are probably flaming hot garbage. There’s simply no way that the number of non-academic staff has increased by 170% in the past twenty years, as a combination of the SEPH and LFS data suggests. For reasons that will become apparent shortly, I also have serious doubts that it’s increased by 85% either, as the combination of SPEH and UCASS suggests. Because there is a second set of data available to look at this question, one that shows expenditure on salaries, and it shows a much different picture.

    The annual FIUC survey shows how much money is spent on wages for ranked academics as well as how much is spent on non-academics (it also shows wages for instructional staff without academic rank,” but I exclude this here for ease of analysis). Over the past three years, it is true that non-academic salary mass has risen, and academic ones have not (score for the bloat theory!), but looked at with a 25-year lens, Figure 3 shows that the rate of increase is about the same (score one against).

    Figure 3 – Total Expenditures on Salaries by Employee Group, in millions of $2023

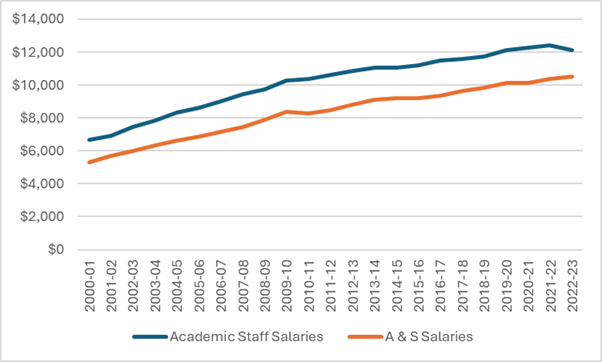
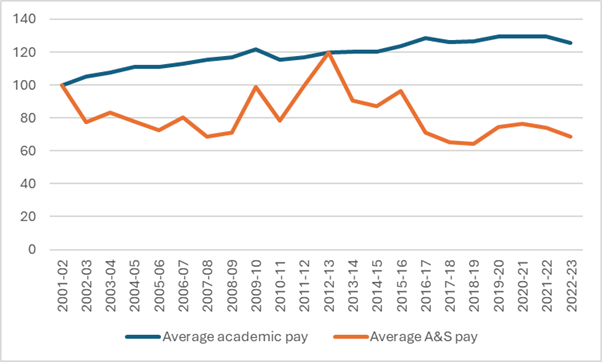
    Basically, the salary data in Figure 3 tells a completely different story than the SEPH/LFS/UCASS data in Figure 2. All you do is divide the spending data by the implied headcounts to see what I mean (which I do below). Figure 4 shows the implied change in average academic pay and average A&S pay, dividing total FIUC pay by the UCASS academic staff numbers and the A&S staff numbers implied by subtracting the UCASS numbers from the SEPH numbers, i.e., the orange line from Figure 2. To believe both sets of data, you have to believe that average academic salaries have increased substantially while average salaries for non-academics have declined substantially.

    Figure 4 – Change in Implied Average Pay, Academic Staff vs. A&S Staff, 2001-02 = 100

    In Figure 4, the blue line representing academic salaries is more or less consistent with the long-term trend in salaries we have seen by looking at salary survey data (which I last did back here): significant growth in the 00s and much slower growth thereafter. There are no staff salary surveys to use for comparison, but let’s put it this way: when people talk about “bloat” in non-academic staff positions, they normally mean it in the sense that the bloat is coming from expensive A&S staff, overpaid A&S staff, etc. For Figure 4 to be true, the growth in staff numbers would need to come almost entirely from more junior, less well-paid staff. It’s not impossible that this is true, but it’s not consistent with the general vibe about bloat, either

    So who knows, really? There’s a lot of contradictory data here, some of which argues strongly in favour of the bloat argument, but quite a bit of which points in the other direction. Better data is needed to answer this question probably isn’t forthcoming.

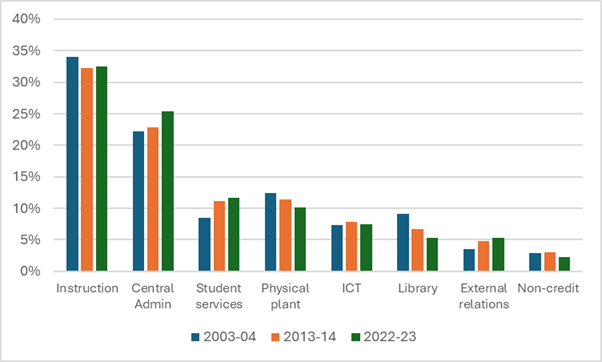
    Meanwhile, we can take one last look at A&S expenditure data. We can check to see if the pattern of A&S salary expenditures across university operating functions has changed over time. As Figure 5 shows, the answer is “a little bit.” Central Administration now takes up 25% of total A&S salary expenditures, up from 22% 20 years ago. Student services and external relations are up much more sharply in proportional terms, but since they were both starting from a low base, they don’t impact the overall numbers that much. Libraries, physical plant, and non-credit instruction are the categories losing share.

    Figure 5: Share of Total A&S Salary Mass by Function, Canadian University Operating Grants, Select Years

    And there you have it: more data than you probably needed on administrative bloat. See you back here again in 2030.

    Source link

  • Ontario in 2029 | HESA

    Ontario in 2029 | HESA

    Back in 2022, just after the last provincial election, I wrote a piece looking forward a few years and predicted that the years 2023-25 were going to be chaos for Ontario postsecondary institutions. And I was right, although I can’t claim to have anticipated any of the specifics. Given that we are now going back into an election, I thought I would try to look into a crystal ball and look at what the province’s postsecondary system will look like financially if our glorious premier is re-elected for another four years.

    To do this, of course, requires making a few assumptions, not just about what will happen in the future but, given the inevitable Canadian delays in producing data, what’s been happening in the past two years as well. Hard data on the student numbers which drive aggregate tuition income does not exist beyond 2022 because the provincial government is deliberately suppressing data on this subject. Yes, really. Until last year, Ontario had one of the best records in the country when it came to openness on enrolment stats, usually publishing quite detailed data within six months of end of the calendar year. As of today, it has now been twenty-one months since the last update. By complete coincidence, the data that has not been updated covers the exact period where provincial government was asleep at the wheel in terms of oversight of international student intake. Can’t have that data going out before an election, I guess.

    Anyways, that means the following projections require a bit more educated guess work than usual. For transparency, here are my assumptions:

    • I have based student number projections for 2023-24 and 2024-25 on data I could find from the Ontario Universities Application Centre (OUAC) and from federal open data on student visas issued up to fall 2024.
    • I am assuming that international student enrolment will bottom out in 2025-26 and resume 10% annual growth thereafter, and that domestic enrolment will grow 2% per year, in line with projected increases in the 18-21 population. The assumptions on international students might be too generous, in which case all my projections will be too optimistic. Keep that in mind as you read this.
    • I am assuming that the provincial government will not add any new funding to the system beyond what was announced in the run-up to the 2024 budget, but that the extra funding announced as a response to the Blue-Ribbon Panel will be maintained past 2027.
    • I am assuming the freeze on tuition will be maintained, but a gentle (but below-inflation) rise in average tuition will continue due to students switching from cheaper humanities courses to more expensive STEM ones.
    • I am going to focus on the main sources of institutional operating income, which are tuition fees and provincial operating government. I am excluding from this analysis anything to do with income from federal or private non-student sources.

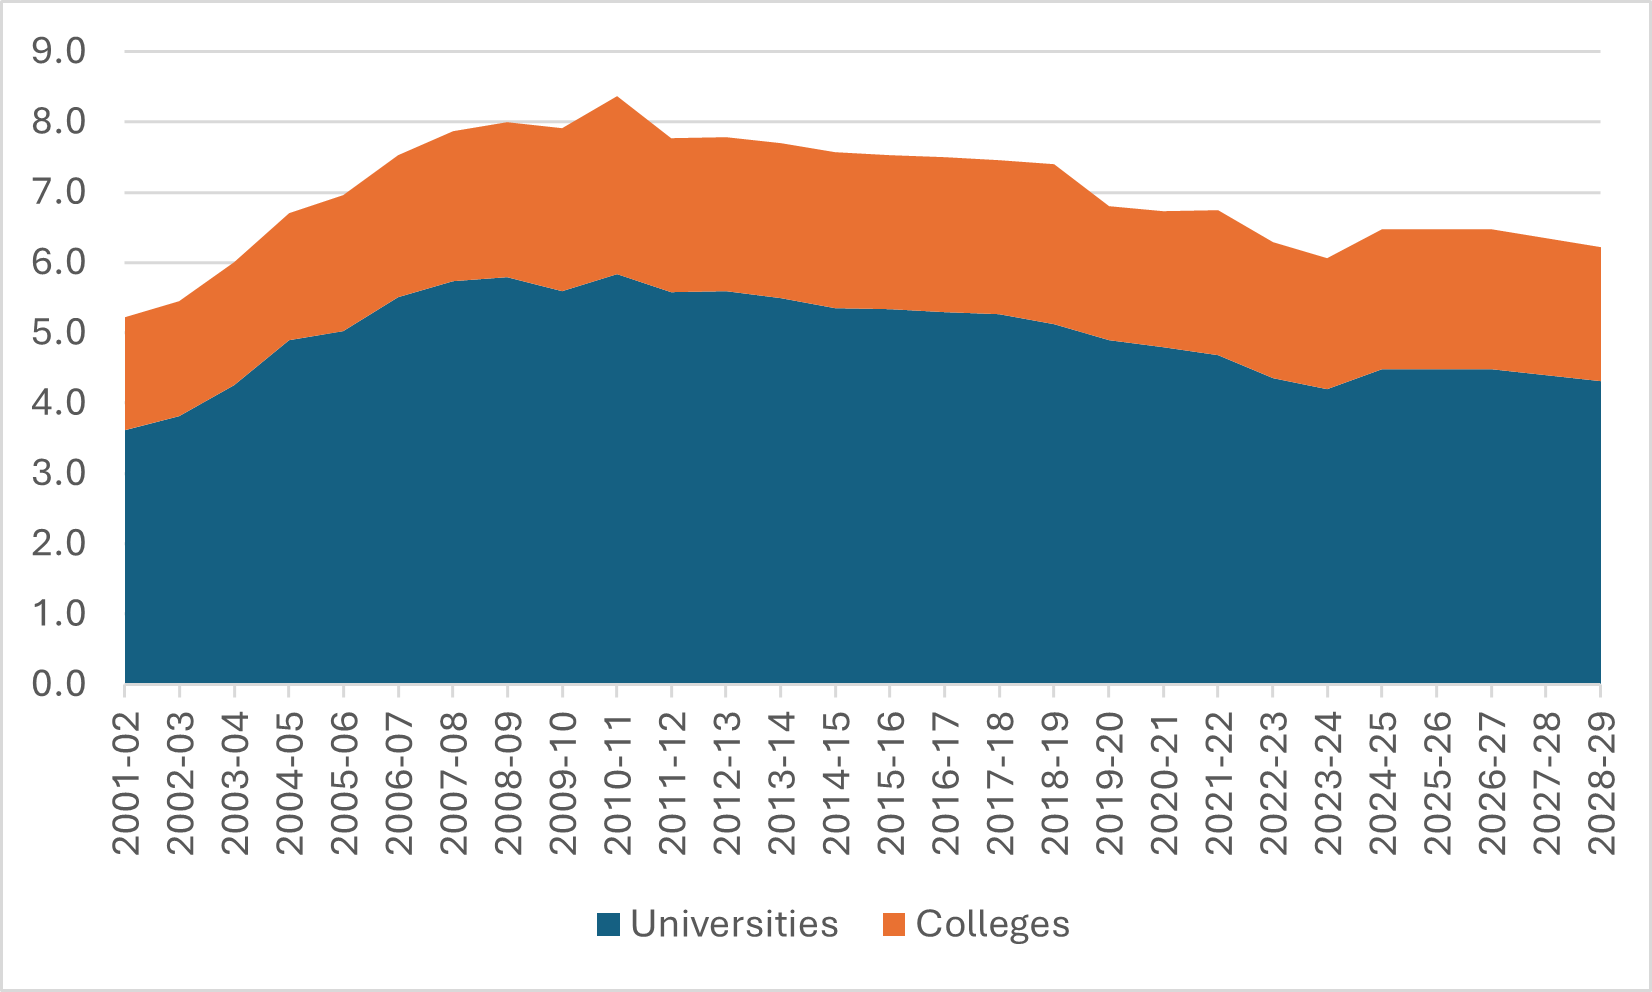
    Let’s start with public expenditures on postsecondary education. The problem of falling real public expenditures began well before Ford took power, but this trend has worsened under Ford. Until last year, he consistently allowed inflation to erode funding. The only time he increased institutional funding was in 2024, after the report of the blue-ribbon panel, and even then the three-year package he announced barely allows funding to keep up with inflation. When this new funding evaporates in 2027, the prospects for any new funding are uncertain: I think it is more likely that the government will revert to its previous practice of holding funding constant in nominal dollars but fail to provide any help to offset inflation. Assuming this is true, the path of government funding for Ontario postsecondary institutions will be as shown below in Figure 1.

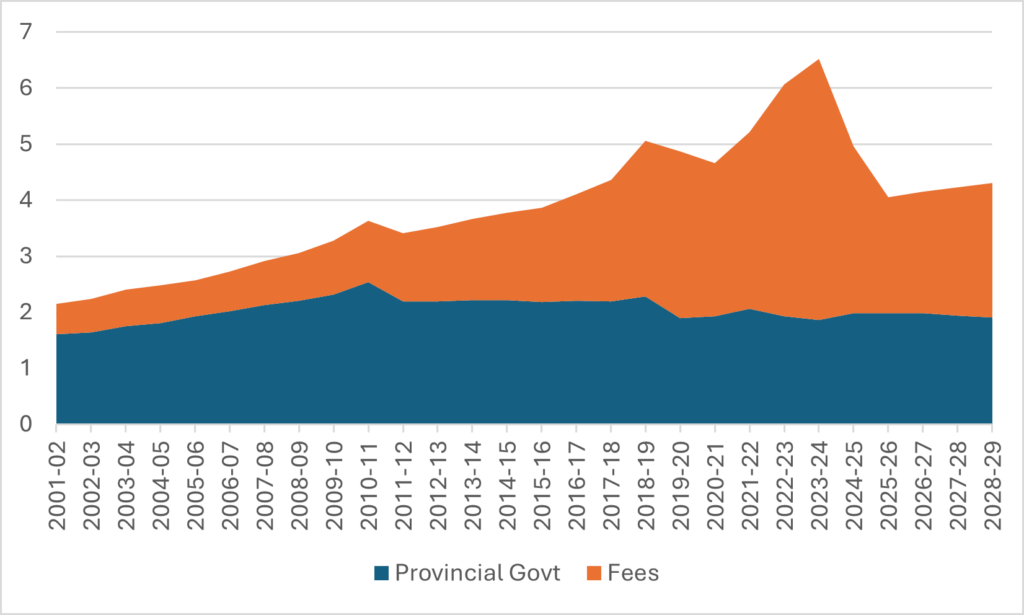
    Figure 1: Ontario Government Transfers to Post-Secondary Education, 2001-02 to 2028-29 (projected) in Billions of $2023

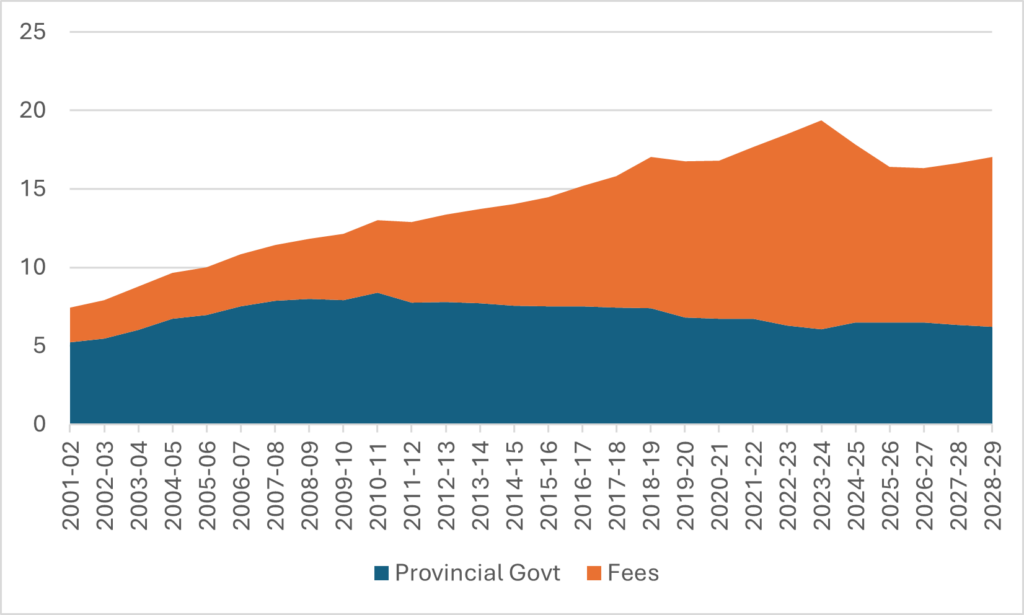
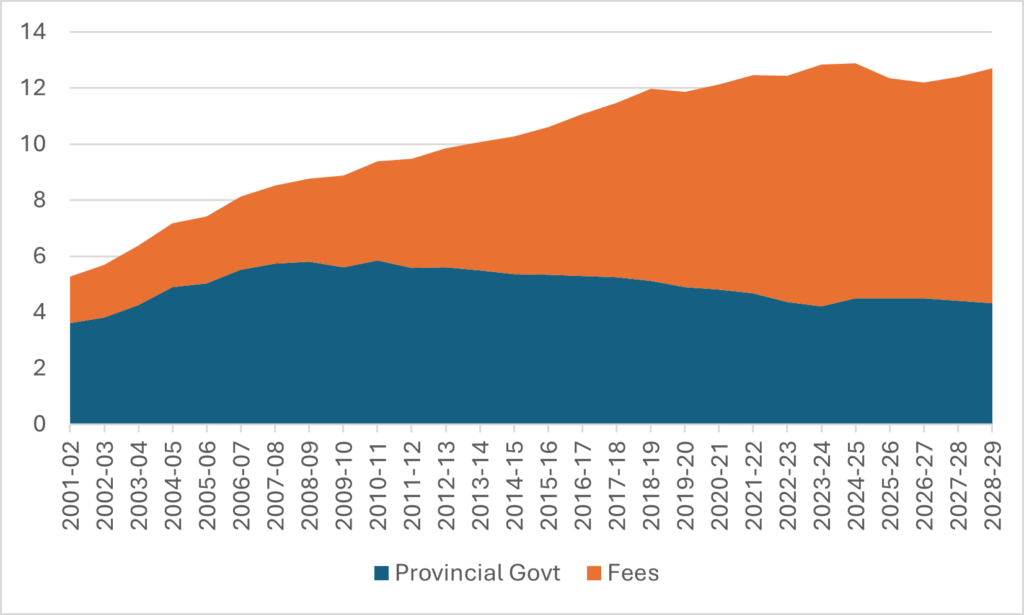
    Now of course, public funding only makes up about a third of total funding in Ontario postsecondary education. What happens when you include tuition fees? Well, it looks like the graph below, Figure 2. Again, as you can see, the “take-off” point for the system we have today clearly lies in the McGuinty/ Wynne period, but boy howdy did the Ford team double-down on the model it inherited.

    Figure 2: Total Operating Income by Source and Sector, Ontario Public Postsecondary Institutions, 2001-02 to 2028-29 (projected) in Billions of $2023

    Now, this is one of those cases where it helps to disaggregate what is going on in the system and look separately at what’s going on in the universities and colleges. Let’s start with colleges in Figure 3.

    Figure 3: Total Operating Income by Source, Ontario Colleges, 2001-02 to 2028-29 (projected) in Billions of $2023

    I’ve been writing about the big fall in college revenues for a few months now, but even I find this graph shocking. Total operating income to the college system is going to crash by about a third between 2023-24 and 2024-25 and then probably will start to recover thereafter. Basically, you should consider the period 2015-2025 as a huge fever dream that is now breaking and sending the system back to exactly where it was a decade ago, minus about 15% of its public funding and a similar drop in the number of students (domestic enrolment really crashed over the past decade).

    Figure 4 repeats the exercise for universities. This one might seem puzzling for many, because it appears to show very little drop in funding in the 2020s. I mean, yes, there’s a teeny dip in 2024, but absolutely nothing like what we see in the colleges—so why are universities screaming about their untenable financial positions?

    Figure 4: Total Operating Income by Source, Ontario Universities, 2001-02 to 2028-29 (projected) in Billions of $2023

    Well, the answer is that universities don’t have a revenue challenge so much as a cost challenge. Colleges have an enormous amount of freedom to rearrange or reduce staff. Universities, to put it mildly, do not, partly because of tenure and partly because collective agreements between universities and faculty contain clauses about layoffs and financial exigency which impose very high barriers and costs to any institution that tries to reduce academic headcount. This forces institutions to force as many cuts as possible on non-academic staff and services, but there are limits to how much you can do before students start turning away.

    Plus, of course, universities simply got in the habit of getting ever larger. Looke at what happened in the 18 years before the Ford government took power: 17 straight years where the average annual income growth after inflation was 5%. The internal political economy of Ontario universities simply evolved so that growth less than 5% was believed to be “austerity.” Since Ford came to power, annual growth has been effectively zero, even as institutions are dealing with the costs of accommodating the major shift in students from humanities to STEM. The gears inside universities are grinding to a halt and even going in reverse this year and next. And universities are—by design—poorly engineered to deal with a lack of growth.

    So, what can be done? Well, in the world we all wished we lived in, this situation would be attracting serious political attention. But it’s not. Ontarians quite like having world-class universities and colleges; they just don’t feel like paying for it. Had the cuts started a few weeks earlier, or had the election been called a few weeks later, the current Program Apocalypse (which seems more than on course to deliver the closure of over 1000 programs across the province) might have become what political animals call “a kitchen-table issue,” that is an issue so important than voters talk about it at the kitchen table. Kids not being able to get into the programs they want to get into because they have been shut due to budget cuts? Yeah, that’s a kitchen table issue. One that might yet have some impact on the election, though probably not a decisive one.

    Could institutions do more to make this a kitchen table issue? Yes, they could. At the university level, institutions could be more overt in saying they will no longer be able to support as many spots in expensive, high-demand programs. At the college level, institutions could be more aggressive about closing programs in the skilled trades. So far, they have been very reluctant to do this even though their high cost-per-student should probably lead a lot more of them to be on the chopping block if financial sustainability were a major issue. But institutions are reluctant to do this because it’s hard to play chicken with the government without seeming to play chicken with the general public. And the only way things could get worse for institutions right now is if they lose what’s left of the public sympathy they have. Which is to say: yes, they could be doing more, but it’s easy enough to explain their hesitation in doing so.

    Anyways, sorry to readers in the rest of the country for all the Ontario-centricity. If you’d like to know more about how the mess in Ontario—partly due to inept oversight by the Ford team and partly due to an inept response by federal immigration minister Marc Miller—affects the rest of the country (and it does), have a listen to my guest appearance on the Missing Middle podcast last week. Good fun.

    Source link

  • More Eating the Future | HESA

    More Eating the Future | HESA

    Morning everyone. Welcome back. Some statistical wonkery today, with respect to the analysis of government expenditures on postsecondary education.

    Many of you will recognize Figures 1 and 2 from earlier blogs or the State of Postsecondary Education 2024. They represent the two most-common ways to look at commitments to postsecondary education: the first in per-student terms, and the second in per-GDP terms.

    Figure 1: Provincial Expenditures per FTE Student by Sector, 2022-23

    Figure 2: Provincial PSE Expenditures, by Sector, as a Percentage of Provincial GDP, 2022-23

    These two approaches have their respective strengths and weaknesses, and not surprisingly they generate slightly different conclusions about how strong each jurisdiction’s efforts are writ to postsecondary education, one focused on the “recipients” of funding (students) and the other focused on the source of the funding (the local economy). Neither is definitive, both are useful.

    But there is another way to look at this funding, and that is not to look at how much institutions receive as a proportion of local jurisdictional output, but to look at what percentage of government spending is devoted to educational institutions. Examined over time, this figure tells you the changing status of postsecondary education compared to other policy priorities; examined across provinces, it can tell you which provinces put more emphasis on postsecondary education. Of course, no one tracks this in Canada, because it involves a lot of tedious mucking around in government documents, but what is this blog for if not precisely that? I wasn’t doing anything on my holidays anyways.

    So I decided to pair my long-term data series on provincial budgets (the most recent one posted back in April), with a new data series on total provincial spending which I derived simply by looking at consolidated expenditures in each province since 2006 and expressed in these same budgets. Usual disclaimers apply: provincial spending definitions aren’t entirely parallel (or at least they use different words to describe what they are doing) particularly with respect to capital, so inter-provincial comparisons are probably a tiny bit apples-to-oranges even if each province’s data is consistent over time. Take the exact numbers with a grain of salt but I think they will mostly stand up to scrutiny.

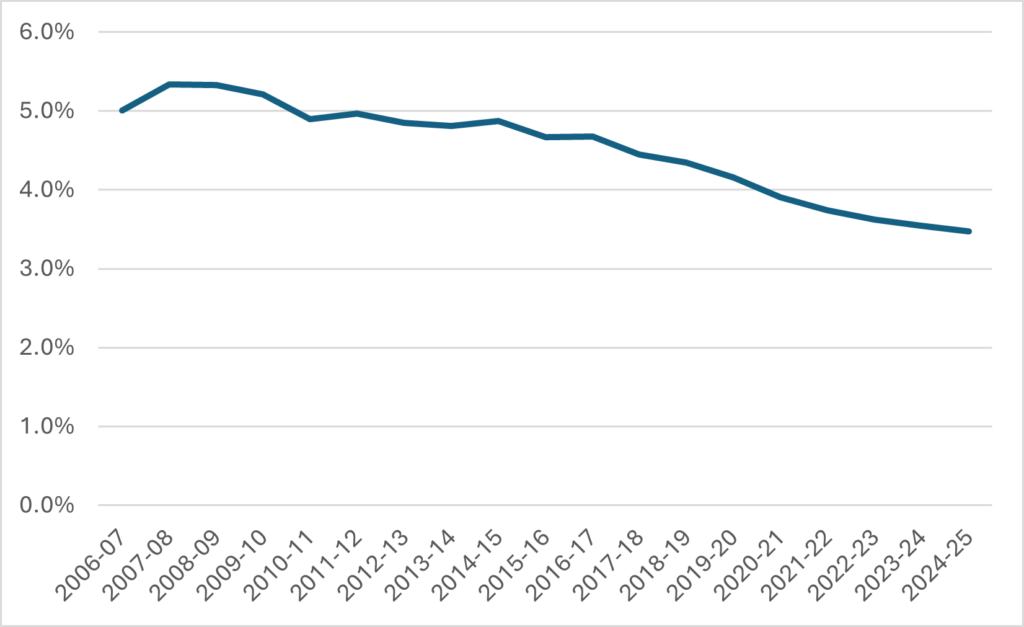
    Figure 3 shows provincial transfers on postsecondary institutions across all ten provinces as a percentage of total provincial spending. And it’s…well, it’s not good. As recently as 2011-12, provinces spent five percent of their budgets on postsecondary education. Now it’s three and a half percent. Or to put it another way, as a proportion of total spending, it’s down by about thirty percent.

    Figure 3: Provincial Spending on PSE as a Percentage of Total Provincial Spending, Canada, 2006-07 to 2024-25

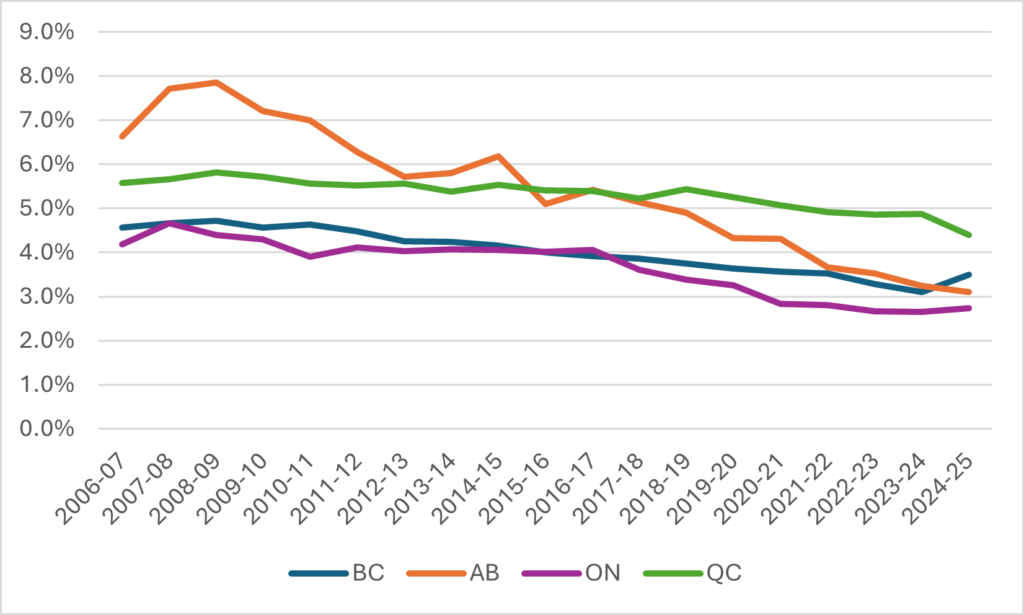
    Is this due to particular events in particular provinces? Not really. Let’s just take a look at the four big provinces (which make up 85% of the postsecondary system. The provinces all started in different places (Alberta, famously, spent a heck of a lot more than other provinces back in the day) and the slope of decline is gentler in Quebec than elsewhere, but the basic path of decline and the eventual destination is similar everywhere. Notable by its absence in any of the four provinces are any clear break-lines which coincide with a change in administration—these declines are pretty consistent regardless of whether governments are left, right, or centre. It’s not a partisan thing.

    Figure 4: Provincial Spending on PSE as a Percentage of Total Provincial Spending, Selected Provinces, 2006-07 to 2024-25

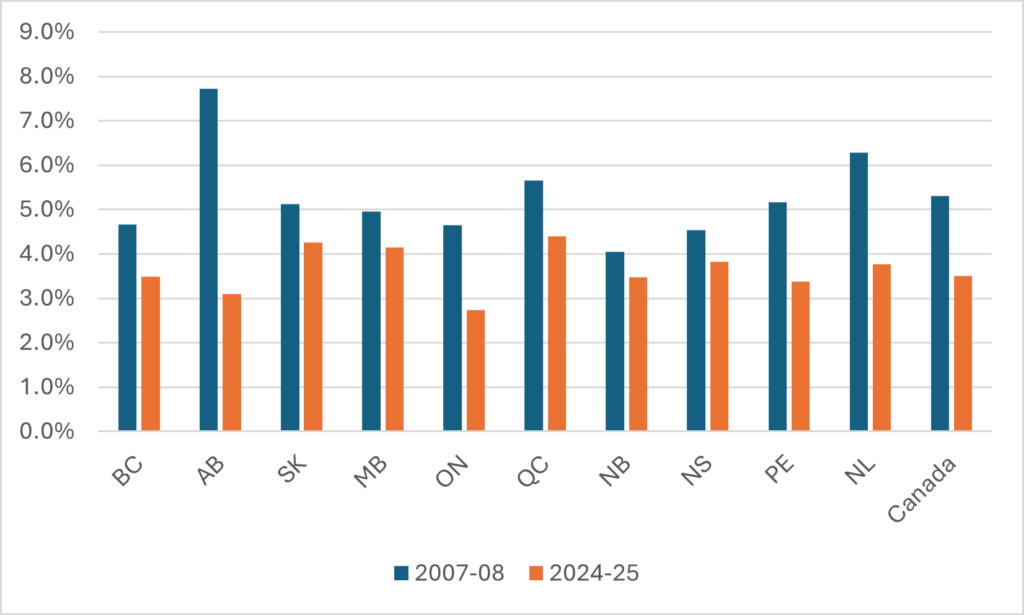
    Figure 5 shows each province’s performance both in 2006-07 and 2024-25. As can clearly be seen, every province saw a decline over the 18-year period. This was not especially driven by one or two provinces: all provinces seem to have come to an identical conclusion that postsecondary institutions are not worth investing in. The size of whatever drop was in most cases inversely proportionate to how high spending was back in the initial period. The biggest drops were in Alberta and Newfoundland, which back in the day were the two highest spenders, riding high as they were on oil revenues. The smallest drop was New Brunswick, which was the weakest performer back in 2006-07. Ontario…is Ontario. But basically, the entire country is converging on the idea that investments in postsecondary need to be in the 2.5%-4.5% range rather than in the 4-7.5% range as they did 20 years ago.

    Figure 5: Provincial Spending on PSE as a Percentage of Total Provincial Spending, by Province, 2006-07 vs 2024-25

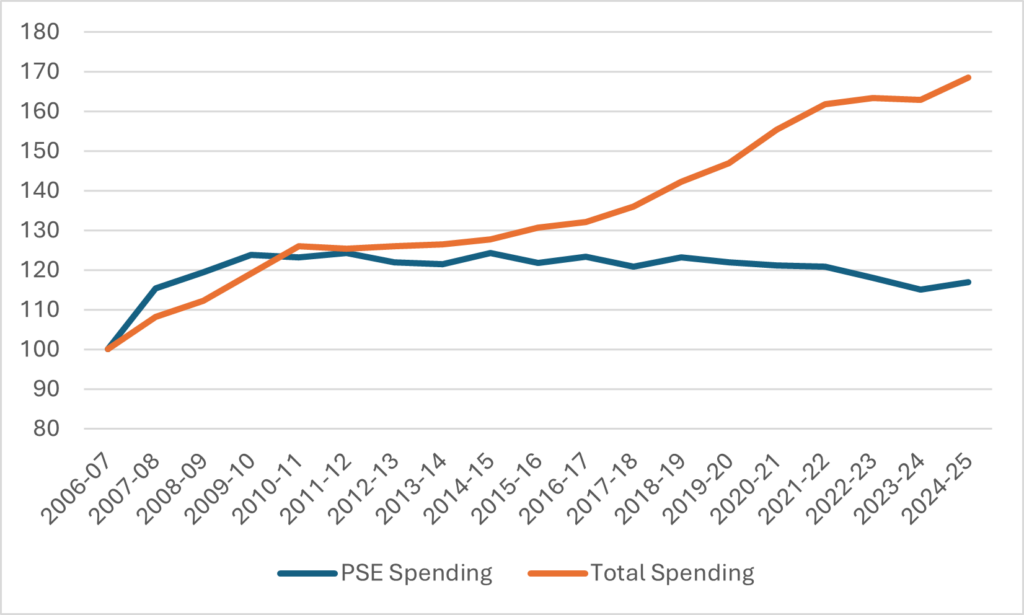
    Now, the obvious conclusion you might draw from this is “hey! Huge declines in public support for public postsecondary education!” But this is not quite correct. Remember: these are ratios we are looking at. Some of the delta will be due to changes in the numerator, some will be due to changes in the denominator. Figure 6 shows changes in both postsecondary spending and total provincial spending. And what’s clear is that the changes we have been examining in Figures 3 and 6 have more to do with the expansion of total spending rather than a decline in PSE spending.

    Figure 6: Real Change Provincial Spending on PSE Institutions vs Real Change Total Provincial Spending, Canada, 2006-07 to 2024-25 (2006-07 = 100)

    That increase in provincial spending in the last decade—30% over and above inflation—is wild. And deeply inconvenient for anyone who wants to build a narrative around generalized “austerity.” But what is clear here is:

    1. transfers to universities and colleges have trailed provincial spending everywhere and without reference to ideology of the governments in question, and
    2. ii) if transfers had not trailed general spending, they would be roughly $9.5 billion better off than they are today.

    And by a simply *amazing* coincidence, $9.5 billion–in real dollars—is almost identical to the increase in income  postsecondary institutions have seen in revenue from international students over the same period (it’s about a $9.2 increase from 2007-08 to 2022-23, the last year for which we have useful data—the 2024-25 is likely somewhat higher but we don’t know by how much).

    There a number of conclusions one could draw from this, but the ones I draw are:

    • Governments are spending more. A lot more. They just aren’t spending on PSE. Instead, they are spending it on an ageing population and other things that juice consumption. Eating the future, basically.
    • The drop in government support for PSE relative to overall spending increases is universal. No government provides any evidence of contrarian thinking. None of them think PSE is worth greater investment.
    • Changes of government are also almost irrelevant. They may change the “vibe” around postsecondary education, but they don’t change financial facts on the ground.
    • There is a really basic argument about the value of postsecondary education which somehow, postsecondary institutions are losing with governments and, I think by implication, the public. That, and nothing else, needs to be the focus of institutional efforts on external relations.

    Provincial governments are eating the future. But the data above, showing that the trend transcends geography and political ideology suggests that at base, the problem is that the Canadian public does not think postsecondary education is worth investing in. Working out how to reverse this view really needs to be job one for the whole sector.

    (Or, to be a bit cuter: the sector needs to do a lot less Government Relations and a lot more Community Relations.)

    Source link

  • The Meaning of 2025

    The Meaning of 2025

    So, was that a fun year, or what?

    From Marc “Tonya” Miller and the federal government knee-capping the postsecondary sector in January to Marc “Harding” Miller and the federal government coming back around in September to knee-cap the college sector specifically to Ontario college presidents calling each other whores and more…it was a year to remember. Heck of a ride.

    But as catastrophic as the current fall in revenue seems, it’s worth remembering a couple of things. First, we’re not alone in this. Australia, the UK, France, the Netherlands: they’re all going through something similar. So are some (primarily but not exclusively blue) US states. And second of all, Canada’s institutions are still on most measures better funded than those elsewhere in the OECD (although that advantage is getting narrower all the time). So there’s an argument to be made that there’s nothing special going on here, and in a way this is just reversion to the mean. Not a lot of comfort in that, obviously, but misery loves company, etc.

    There is, I think, a  world-wide phenomenon (though perhaps it does not capture the dynamics of low and middle income countries) which is: NOBODY WANTS TO PAY FOR IT. Higher education is expensive on a per-student basis and it now extends to a far higher percentage of the population than it has at any point in human history. The implicit assumption within higher education communities was that by broadening access to higher education, we would win more public approval for higher education finance. Instead, by making higher education the norm, we made the “gains” from higher education a lot harder for graduates to see since they weren’t as “exceptional” anymore. There’s a point where attempts to boost access to pos-secondary education ceases to feel like spreading opportunity and starts to feel like imposing chores. Beyond that point, public support for higher education falls.

    (More generally, the closer institutions come to being “universal,” the more they seem like utilities, and the fraction of the population that wants “world-class” utilities is vanishingly small. People just want utilities to work, quietly and properly, with no fuss—which is probably why evident dysfunction like months-long campus disruptions from encampments are so deeply unpopular.)

    In other words, we’ve spent 80 years building a system of higher education that is simply more expensive to run than the public is willing to support. Some countries have tried to get around this by financializing things a bit, imposing tuition fees but putting off the bill via student loans, and that helps somewhat as long as governments don’t use that as an excuse for continuing to reduce public funding (which, barring the UK, they mostly haven’t). Some, like Canada and Australia, have tried the neat trick of getting foreigners to pay for their higher education systems via international student tuition fees, but over-reliance on this tactic tends to run up against externalities in the housing market.

    Which means we finally have to confront the problem of nobody wanting to pay for the system we have created.

    There will be huge economic and geo-political ramifications to not paying for the system. Canadian universities depend on having fat margins in undergraduate and professional master’s degree to subsidize research. To a lesser but not insignificant extent, colleges depend on having fat margins in non-tech programs in order to cross-subsidize expensive programs in the trades programs. We don’t talk about these cross-subsidies much (in fact most institutions try to hide them as much as possible, which is a big reason that politicians and even public servants don’t really understand why universities and colleges behave the way they do), but they are fundamental to the way we organize institutions.

    Think about the consequences of reducing those cross-subsidies within universities at the exact moment when advances in technology are opening up huge potential advances in energy, materials science, and health. We (and the Brits, and the Aussies, and the Dutch) are simply going to cede advances in these areas to other countries who are not cutting back on science. China, probably. India and Turkey, maybe. And think about cutting the cross-subsidies in colleges at the exact moment when we need more and better-trained skilled tradespeople in order accelerate the construction of housing and other critical infrastructure.

    (Remember in 2016, when we could console ourselves that however big a disaster Trump was, at least Canada could profit by offering an attractive landing spot for international science and tech talent? Well, we aren’t saying that in 2024. We could be hiring up a storm of top talent, but the money isn’t there to do it, and the housing market is such a disaster we’re afraid to invite people in. Both levels of government have much to answer for.)

    Anyways, it’s easy to bitch about funding but as you’ve heard me say before, no one is coming to save us. There’s zero evidence that anyone in government is suddenly going to decide that Eating the Future is wrong, so the sector is going to have to work out solutions on its own. Non-enshittified solutions, that is. Maybe, just maybe, it’s time to re-think the whole model to make it less costly and more efficient. And that doesn’t just mean asking questions about whether we need this new building, or that academic program or this new executive position, or quite so many student services devolved to the faculty level (all of which are important!) but also some more fundamental questions, like:

    Is it integral to our model that undergraduate degrees be four years in length? (There are parts of Canada, like Manitoba, where it is not.)

    Are research and teaching really the complementary goods many claim they are, or would more specialization of effort be of benefit? (Equally: why should teaching cross-subsidize research, as it so plainly does in a variety of ways?)

    Do degrees need to be awarded along disciplinary lines (which have inconsistent relations to occupations and careers) or are there other ways to do it?

    What if, instead of giving research money to (mainly) universities and asking them to get matching funds from industry, we gave vouchers to industry to work with universities/colleges that they could either use or lose?

    What if colleges got out of skilled trades training altogether and handed it over to industry?

    Few people are going to like all the answers (or even the questions) here, but nevertheless these are the kinds of questions the post-secondary system should be asking not just itself but the rest of society as well.

    But that’s all for next year. In the meantime, happy and restful holidays to all. There will be a podcast tomorrow and our AI Newsletter on Friday, but this will be the final blog of 2024. Regular service will resume January 6. Be well

    The post The Meaning of 2025 appeared first on HESA.

    Source link

  • Fall and Rise | HESA

    Fall and Rise | HESA

    Fall and Rise

    The question I am getting more often than any other these days is: “what are you hearing about cuts at colleges and universities?” And my answer for the most part has been: “damned if I know.”

    The reason for my confusion is that publicly available details are few and far between. The HESA Towers team has been scouring the public record for details on institutional budget announcements; by our count, only 34 universities or colleges have so far announced anything concrete about their 25-26 budget plans and/or any planned cuts as a result of changing international student numbers. It’s possible more have been announced internally but just not caught the notice of the local press; we’ll be doing a lot more digging over the next couple of weeks. My guess is that many institutions are trying to avoid bad headlines by simply not going public about any plans to cut…but of course in the process, they are making it harder to convey to the public the magnitude of the downsizing being forced on the sector.

    (This is a really interesting version of the Tragedy of the Commons!).

    Some additional problems with the data: such information as one can glean from public sources is often skimpy and inconsistent: sometimes you get a figure for “loss of anticipated revenue,” sometimes you get a “projected deficit” (which sometimes is for 24-25, and other times for 25-26, and whether the figure is for operating budget or total budget take a bit of digging). Sometimes the numbers of programs being cut are announced but the identity of the programs is secret. Often you see that there will be budget cuts of $X million but there is no clarity about where those cuts will come from or the timeframe for the return to budget balance. In terms of job “cuts” as near as we can tell only five institutions have announced specific numbers for layoffs which have actually so far occurred, for a total of 214 lost jobs. You may have seen higher estimates from other sources, but these seem to include data on jobs which “will be affected” and it’s not 100% clear how many of these are permanent jobs which will be eliminated vs. permanent posts which will not be filled, or contract jobs which will not be renewed. All of these nuances may sound petty, but it’s really hard to get meaningful numbers unless you get this stuff right.

    The story of how universities and colleges deal with the sudden loss of international student income (and the long-term consequences of provincial disinvestment) is the biggest and most consequential story in Canadian postsecondary education this century. How we deal with this collectively will shape the sector for over a decade, maybe even out to 2050. The HESA Towers team is working hard to document what is happening and help the sector make sense of fast-moving events and respond appropriately. So today I want to tell you about two initiatives we’re launching.

    The first is a Retrenchment Watch, which will follow developments in institutional cutbacks not just in Canada, but around the world (albeit with a particular focus on the anglosphere). Higher education probably hit peak public funding around the globe over a decade ago, but what we’re now seeing is an actual contraction of the sector as a whole, happening via an un-coordinated set of decisions made by individual institutions according to local imperatives. Understanding how this is happening is of great importance, not just for posterity but for present-day decision makers. And we’ll be making this information freely available to all via Retrenchment Watch.

    For the moment, the Retrenchment Watch is extremely bare bones, but we’ll be filling it out very quickly over the next few weeks, with the Canadian institutions first. If you want regular updates on who is cutting what as well as some basic pattern analysis, please fill out this form, and we’ll get you signed up to our newsletter so you’re always up-to-date.

    The second is what we are calling “The Recovery Project.” We know that institutional leaders aren’t just thinking about surviving cuts, they’re also thinking about how to position their organizations to thrive in the aftermath. To help them, we’re launching a subscription research project looking at universities and colleges around the world who have faced serious financial sustainability problems over the past three decades and examining how they turned their fortunes around. In a crisis, there’s no time to re-invent the wheel: with this research institutions can understand better what works, when and why. By spreading the cost of research collectively across many institutions, we can offer this premium product—which involves monthly reports and webinar sessions for all members—at a huge discount to individual schools (and if your school is a member of the University Vice-President’s Network, we’ll be offering an even bigger discount).

    If you’re interested in joining this project, my colleague Tiffany MacLennan has been working to bring this information together. Email her at tmaclennan@higheredstrategy.com and we’ll get back to you ASAP with a prospectus.

    There’s no disguising how the sector is taking a beating right now. It will recover. The only question is how quickly, and which institutions will be at the forefront.

    Source link

  • From Jazz to Symphony | HESA

    From Jazz to Symphony | HESA

    I spent all last week in Asia, at events put on by the International Association of Universities (IAU) in Tokyo and the Organization for Economic Co-operation and Development (OECD) in Jakarta. As usual, these meetings were interesting for me not so much because I can discover secrets of “how they do things better elsewhere” (they don’t, by and large, we’re all screwed for roughly the same reasons, which is that the public does not want to pay for the kind of institutions that academics want to work in), but simply because they help me get a wider take on the direction that global academia is heading.

    And here’s the thing: having sat through five days of meetings, I am more convinced than ever that universities are, globally, caught in a conflict of their basic institutional logics. And also, that for some reason, no one wants to talk about this openly even though it is self-evidently a pretty big deal. Let me explain.

    Over the course of the 19th and 20th centuries, at different paces in different parts of the world, universities went from being purely institutions of instruction to institutions that also engaged in advanced research. In the United States, where this process went the furthest, the fastest, it was shaped substantially by one man: Vannevar Bush, President of MIT and special scientific advisor to President Roosevelt during WWII. Bush was appropriately excited by the strides made by American science during the war, and wanted the party to continue after the war was over only with one difference: instead of giving scientists untold billions and placing them under military control as was the case for the Manhattan Project, Bush thought the correct path forward was for the government to give scientists untold billions and then leave them alone to make their own decisions about how the money should be spent. That’s not quite how things panned out, but there is no question that the system of curiosity-driven research that emerged gave an awful lot of power to individual researchers and left universities as mere intermediaries for funding. Or, as a colleague sometimes puts it, with respect to research missions, universities are simply holding companies for the research agendas of individual professors.

    And let’s face it, this worked well for many decades. The scientific output of universities working under this model has been amazing (see my interview with David Baker on global science from a few weeks ago). And it didn’t require universities to take on a particularly dirigiste role with respect to the faculty. In some ways, quite the opposite. It was during this period after all that a professor challenged then-Columbia President Eisenhower with the immortal words: “we faculty are not employees of the university…we are the university.” So as far as anyone could tell, the public could just dump money on scholars working in hubs and good things would happen.

    Somewhere over the past few decades, though, the mission of universities changed. Instead of being asked to provide research, they were asked to promote local economic growth, or provide solutions to “grand challenges” or sustainable development goals. And these were challenges that universities took on—gladly for the most part. “Look!” they said to themselves, “Society wants our knowledge/help/advice, we get to show how useful we are, and then people will love us and give us even more money.” And trust me, this is happening All. Over. The. World. Oh sure, the details vary a bit by place in terms of whether the push is more on institutions to push local economic growth or to help deliver social progress, and the extent to which this obligation is imposed on institutions and to what extent they embrace it on their own…but the trend is universal, unmistakable. 

    Except (how can I put this?) I am fairly sure that the lessons institutions learned with respect to growing research outputs do not translate well into these new missions. Research is something that can be done within academia; these new tasks require partnerships and relationships. Things which institutions are a lot more capable of delivering reliably than individual professors, whose commitment to particular endeavors may be more transitory, shaped as they often are by the availability of funding streams, changing research interests, the occasional switch of institutions, etc.

    It has taken universities awhile to work this out. The initial assumption that universities could take on all these missions could be met in much the same way that the research mission was: just assemble a lot of smart people in one place, and wonderfully imaginative solutions will naturally emerge. No central coordination necessary, and great universities could continue working as they had always done: like a great jazz band, where the anarchy is the point.

    But if these new missions actually imply a need for more durable structures to bring stability to partnerships and relationships, then a jazz band approach is probably not such a hot idea. If these missions require institutions to be able to act corporately, strategically, then jazz doesn’t cut it anymore. Neither does Big Band. You need something closer to a symphony orchestra. And boy, the implication of that change is significant. The locus of control and responsibility shifts upwards from professors to the larger institution. Professors, increasingly, would need to be treated as if they are second cello—that is, as parts of a larger musical enterprise—instead of as Thelonius Monk or John Coltrane. It would be a fundamental re-think of what it means to be an academic.

    There you have it: an old version of a university in which great things happen just because you put a bunch of smart people in close proximity to one another, and another which requires substantially more organization and (in a Weberian sense) bureaucracy. And it’s not that universities are being asked to choose—they aren’t. It’s worse than that: because these new missions are meant to be in addition to the older ones of teaching and research, universities are being asked to be both of these things at the same time. And that’s a recipe not only for unhappiness, but also for incoherence. Universities are simply becoming less effective as their missions multiply. 

    None of this has escaped the notice of governments. They were mostly quite enthusiastic about the idea of universities as community resources, places that in effect apply brain power on-demand to various types of social and economic problems and are getting frustrated that jazz-based universities can’t deliver. Despite promises to the contrary, old-style universities simply aren’t set up to deliver the promised results, leaving an expectations gap that is souring relations with that subset of governments that don’t view higher education as the enemy in the first place.

    And this, in turn, is contributing to a widespread recession in vibes around universities: simply put, they are not liked and admired the way they used to be. But more on that tomorrow.

    Source link

  • Quick Update on Research Funding

    Quick Update on Research Funding

    Remember the spring budget, when the Federal government announced a heavily back-ended $1.8 billion (spread over five years) boost to research grant funding, as well as the creation of a capstone research organization which might have its own funds to co-ordinate challenge-based research? Well, the federal government has recently been fleshing out these announcements through a series of badly coordinated media releases. And so today, we’re going to go on a quick government press release safari to try to work this out.

    The three granting councils have all issued statements about how much new funding they expect to receive over the next five years. SSHRC says that its share of the $1.8 billion will be $316 million. CIHR says it is in line for $540 million over five years. NSERC does not provide a figure over five years, but it does say it what it will receive in years one and five, and since these figures are both pretty close to the numbers CIHR cites, I’m going to go ahead and say that NSERC is set to get something around $540 million as well. Total to the councils is therefore $1.396 Billion over five years.

    In addition to this, the government says it is going to give $182 million over five years for the creation of 224 new Canada Research Chairs. It also says it will be providing $452 million to the Research Support Fund (RSF) for things such as establishing digital tools to support research and cybersecurity and supporting inclusive and indigenous research. A separate press release says it will be providing $354 million to support the indirect costs of research

    Now, if you’re counting carefully, you’ll realize that total government announcements total to $2.03 billion. Which, it should be superfluous to add, is not $1.8 billion.

    Confused? Me too.

    And the government is not done with announcements. Recall from the spring budget that one of the key announced changes was the creation of a “capstone” organization which would sit above the tri-councils without actually directing them. Details on what it would do and how were scarce, mainly because ISED and Finance were at loggerheads over the issue and so the feds did what they always do and punted the question for a few months with the magic words “details to come in the Fall Economic Statement.” 

    Now, it’s not entirely clear that there actually will be a Fall Economic Statement (Dec. 21st is fast approaching and there’s still no date set), but one key question it was meant to resolve was whether or not the capstone organization would, as recommended by l’Université de Montréal’s estimable Frederic Bouchard and the rest of his Advisory Panel, have funds of its own (beyond those run by each of the tri-councils) for a) multi- and interdisciplinary research that falls through the cracks between the councils and b) mission-driven research. I think the general assBudumption in the research community is that while the capstone organization might not get a ton of money for these activities, the sum would nevertheless be non-zero. So we’re more than likely not just $200 million dollars over the originally-announced budget but probably $300 million or more.

    It’s not peculiar that this government might go over budget on something. What is peculiar is that the current government, famous for believing (or at least giving every evidence of doing so) that spending money is in and of itself evidence of program effectiveness, wouldn’t take credit for it. If they were actually bumping up their overall spend, past form suggests they’d be shouting it from the rooftops instead of letting some random higher education blogger work it out on his own and then share it with a few thousand of his closest followers. 

    A mystery to be cleared up soon I guess. 

    One other point of note here is a wrinkle in how the additional indirect support grants will work. Overall, indirect support has been equal to about 22% of “direct” funding: that is, for every dollar of tri-council grant that goes out, 22 cents accompanies it to cover overhead (most informed observers think actual overhead is closer to 50 cents, but this is another story). The sum being allocated in these announcements—$354 million to accompany a $1.4 billion increase in council grants—is more or less in line with this figure.

    BUT—and this will be a big but for some people—the money is only going to be given to institutions which receive more than $7M/year in tri-council grants, which basically means the U15 plus a half-dozen others. Why? Well, because that 22% average is just that: an average. The biggest tri-council grant recipients (i.e. the U15) only get indirect funding equal to about 18% of their tri-council grant haul. At some of the smallest institutions, the figure can be as high as 80%. This equalization formula has, as you can imagine, driven the U15 absolutely spare over the two decades it has been in force, and so you can read this part of the announcement as a victory for the Big Rich Universities. 

    More when we get a Fall—or possible a Winter—Economic Statement. See you then.

    Source link