
Gary Roth’s The Educated Underclass describes a growing population of college-educated people who, despite credentials and effort, are increasingly locked out of stable, dignified work. While Roth’s analysis focuses primarily on the United States, the framework extends naturally—and urgently—to international students educated in the U.S. and to the global labor markets they enter after graduation. When immigration regimes, artificial intelligence, and comparative higher education systems are considered together, the educated underclass emerges not as a national failure, but as a transnational condition produced by modern higher education itself.
U.S. colleges and universities aggressively recruit international students, presenting the American degree as a global passport to opportunity. These students pay higher tuition, subsidize institutional budgets, and enhance global prestige. What is far less visible is that access to the U.S. labor market after graduation is narrow, temporary, and increasingly unstable. Programs such as Optional Practical Training and the H-1B visa tie legal status to continuous employment, transforming graduates into a compliant workforce with little leverage. Job loss does not merely mean unemployment; it can mean removal from the country.
Indian students in STEM fields illustrate this dynamic clearly. Drawn by promises of innovation and demand, they enter graduate programs in computer science, engineering, and data analytics, only to find themselves funneled into a lottery-based visa system dominated by outsourcing firms and consulting intermediaries. Visa dependency suppresses wages, discourages job mobility, and creates a workforce that is educated but structurally insecure. Roth’s educated underclass is visible here, but intensified by deportability.
Artificial intelligence compounds this precarity. Entry-level technical and analytical roles—software testing, junior programming, data cleaning, research assistance—are increasingly automated or augmented. These were precisely the jobs that once absorbed international graduates. AI-driven labor contraction now collides with rigid visa timelines, turning technological displacement into enforced exit. Immigration policy quietly performs the work of labor market triage.
Chinese students in business, economics, and the social sciences encounter a different version of the same trap. U.S. employers are often reluctant to sponsor visas outside STEM, while Chinese labor markets are saturated with domestically educated elites. Meanwhile, geopolitical tensions—intensified during the Trump administration—have normalized suspicion toward Chinese students and scholars, particularly in research-adjacent fields. The American degree, once a clear marker of distinction, increasingly yields managerial precarity, contract work, or prolonged dependence on family support.
China’s own higher education system complicates this picture. Massive state investment has expanded elite universities and research capacity, producing millions of highly credentialed graduates each year. Yet employment growth has not kept pace. Underemployment among Chinese graduates has become routine, and returnees from U.S. programs often find that their foreign credentials no longer guarantee elite status. In both systems, education expands faster than secure work, producing surplus aspiration and managed disappointment.
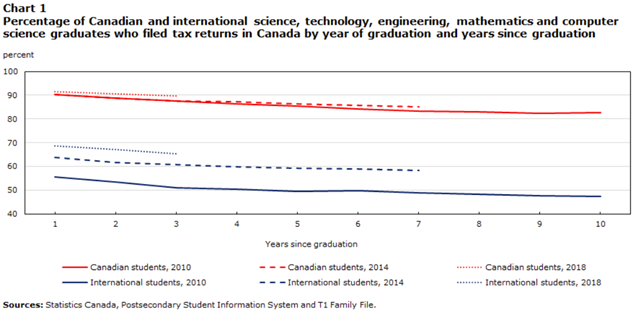
Canada is often presented as a counterexample to U.S. hostility toward international students, but its outcomes reveal similar structural dynamics. Canadian universities rely heavily on international tuition, while immigration pathways—though more predictable—still channel graduates into precarious labor markets. Many international students end up in low-wage service or contract work unrelated to their degrees while awaiting permanent residency. At the same time, domestic Canadian graduates face rising competition for limited professional roles, particularly in urban centers. The result is not inclusion, but stratified precarity distributed across citizenship lines.
These global dynamics have domestic consequences that are rarely acknowledged honestly. International students and foreign graduates are increasingly perceived as occupying educational and professional positions that might otherwise go to people whose families have lived in the United States for generations. In elite universities, graduate programs, and competitive labor pipelines, institutions often prefer international applicants who pay full tuition, arrive pre-trained by global inequality, and are more willing to accept insecure work.
For historically rooted communities—Black Americans, Indigenous peoples, and long-established working-class families—the resentment is especially acute. After centuries of exclusion from education and professional employment, they are told that opportunity is scarce and must now be globally competitive. The contradiction is profound: a nation that never fully delivered educational justice at home markets opportunity abroad while declaring it unattainable domestically.
Trump-era immigration policies exploited this tension by framing foreign students and workers as threats rather than as participants in a system designed by elites. Travel bans, visa restrictions, attacks on OPT, and open hostility toward immigrants transformed structural failure into cultural conflict. Yet the animosity did not originate with Trump. It reflects decades of policy choices that expanded higher education without expanding secure employment, substituted global labor arbitrage for domestic investment, and left working- and middle-class Americans to absorb the losses.
Universities play a central role in sustaining this arrangement. They function as global sorting machines, extracting tuition from abroad, conferring credentials with declining labor-market value, and disclaiming responsibility for outcomes shaped by immigration law and AI-driven contraction. Career services rarely confront these realities directly. Transparency would threaten enrollment pipelines, so silence prevails.
In Roth’s terms, this enlarges the educated underclass while fracturing it internally. Domestic and foreign graduates are pitted against one another for shrinking footholds, even as both experience debt, insecurity, and diminishing returns on education. The conflict is horizontal, while power remains vertical.
The educated underclass is no longer emerging. It is already global, credentialed, indebted, and increasingly unnecessary to the systems that trained it. Until institutions, employers, and governments in the U.S., Canada, China, and beyond are held accountable for the scarcity they engineer, higher education will continue to function not as a ladder to mobility, but as a mechanism for managing inequality across borders.
Sources
Gary Roth, The Educated Underclass
Harriet A. Washington, Medical Apartheid
Elisabeth Rosenthal, An American Sickness
OECD, Education at a Glance
U.S. Citizenship and Immigration Services, OPT and H-1B program materials
National Foundation for American Policy, reports on H-1B labor markets
Georgetown University Center on Education and the Workforce, credential inflation studies
International Labour Organization, global youth and graduate employment reports
China Ministry of Education, graduate employment statistics
Statistics Canada, international students and labor market outcomes
David Graeber, Bullshit Jobs
Richard Wolff, writings on global labor surplus and credentialism


