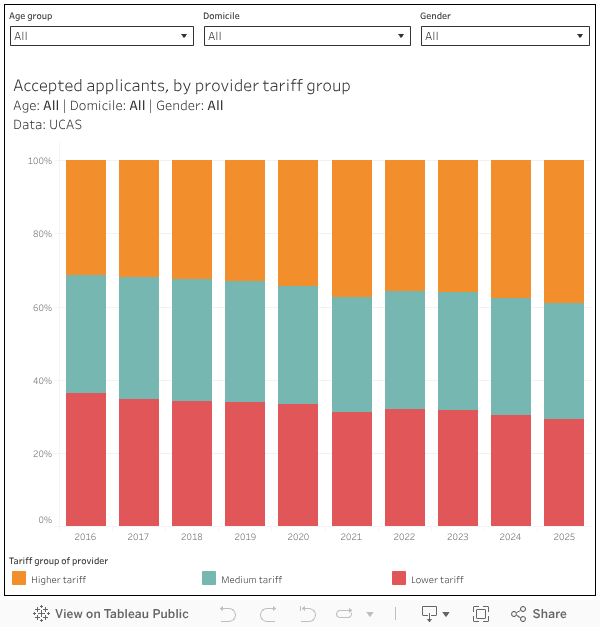
There’s only really one headline from this year’s UCAS cycle – and that’s about the recruitment behavior of higher-tariff providers.
The closest analogue is 2021: the so-called “mutant algorithm” year in which higher-than-predicted A level results (arguably the first accurate and fair set of results for many years, unconstrained by any predetermined curve) meant that traditionally selective providers were contractually obligated to honour a lot more offers than expected.
But there was no such anomaly in results this year. The cohort did do very slightly better than expected (within the limits of the system), but this was – as it should be – down to their own hard work rather than any external factor.
The assumption has to be that the growth in numbers at selective providers (those that have traditionally used tough level three requirements as a way of admitting only those with the best results) has to be down to a change in behavior. So what has changed, and why?
What are we looking at
Twenty-eight days after A level results day (JCQ results day to use the technical term) isn’t quite the final day of Clearing. You can still apply for 2025 entry up until 6pm on 24 September – which, depending on where you are heading, is pretty much welcome week.
However, JCQ+28 is the last point at which UCAS releases statistics on applications and acceptances, before we get to the End of Cycle reports through December and January. These are the points where we can get a perspective on how this round of recruitment has gone (for the sector in December, by provider in January).
But even this isn’t a final number. Many universities and colleges have multiple undergraduate entry points – and of course not all applications go via UCAS. End of cycle UCAS statistics do include the ones that they know about (the “Record of Prior Acceptance”) but the Clearing data does not.
Volume up
In most recent years around 10 per cent of applicants overall have been placed via Clearing, including both “direct to Clearing” applications (where someone hasn’t made choices of course and provider on their UCAS form) and standard “Clearing” (where someone has not been accepted, or not accepted a place at their firm or assurance choice). This proportion has grown slightly over the last decade – in 2016 it was nearer 9 per cent.
A part of the reason for this is the introduction of the UCAS “decline your place” option, and the continued improvements in the Clearing system via the “Clearing Plus” tool that matches students with courses and providers based on interests and aptitudes. It is now easier for students to make a change to their plans – to decline a firm (and/or) insurance place even though they met the requirements, and to find another place that suits their needs. As you might guess, this has been a boon for high-tariff providers – who now find it much easier to recruit students who have exceeded results day expectations – but the benefits are wider.
It is good news for the students in question as well – if you have done particularly well it may unlock a course or university that you wanted to go to but didn’t dare waste an application slot or firm acceptance status on. It might mean a more direct route to a career now you know more about professional requirements, a place nearer home (or further away!), a cheaper part of the country to live in (or an easier one to find term-time work in) or the uni where your friends are also heading. A lot can change in the life of an applicant between putting your form in on 15 January and getting your results in mid-August.
An element of concern
So the growth in acceptances at high-tariff providers is partially explained – but not entirely.
You don’t have to spend a long time talking to admissions staff to hear that so-called high-tariff providers are now taking students with less stellar A level results in greater numbers. Making it easier to “trade up” (as the frankly unhelpful discourse would have it) is one thing, lowering the tariff is a different matter.
The popular perception is that high-tariff providers are better. This is true in that they are better at being high-tariff providers.
If you’ve done a few open days you will have been made aware that universities are not a homogenous lump. Even on a similarly named course, they will teach differently (more lectures, more tutorial, more blended, more hands on, more theoretical or academic), focus more on different parts of the subject, have different facilities (anything from lab kit to student support services), and even timetable differently. These are the differences that should really be driving applicant decision-making – and a high-tariff provider may not be better for a particular student (whatever their results).
A choice of university governs a lot more of an applicant’s life than just what they’ll end up putting on their CV and who this might or might not impress – although a lot of popular commentary and ministerial statements take a more simplistic view of “undermatching”.
Under the bonnet
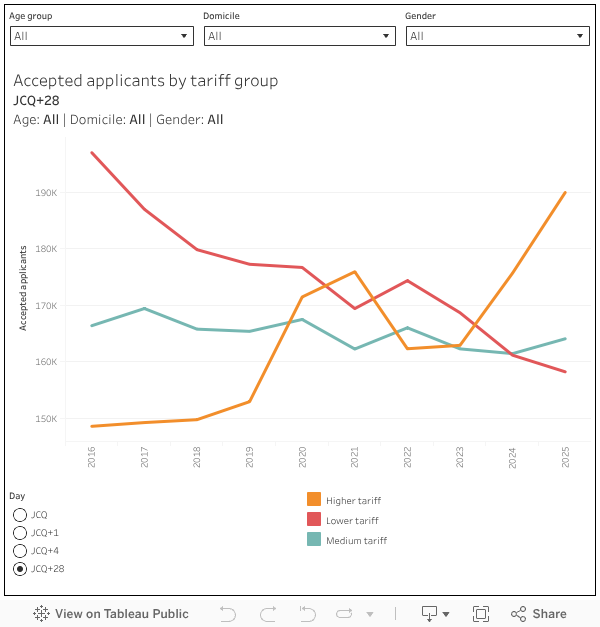
Because we get stats on a mostly daily basis, we can get a sense of when the application deals are being sealed. I’ve not plotted every day of data because honestly who has time, but here we have results day, the day after, and the Monday of the next week (traditionally the three big Clearing days) plus day 28 which rounds up most of the rest of the action.
There’s not much Clearing data in the JCQ results day release: that that is in there is mostly from applicants domiciled in Scotland with SQA results (they get their results a week earlier, the lucky things), mature students, and overseas students. So for 18 year old entry on that day in England, Wales, and Northern Ireland you are just seeing the automatic workings of the UCAS system – where applicants got the grades on the offer they get the place.
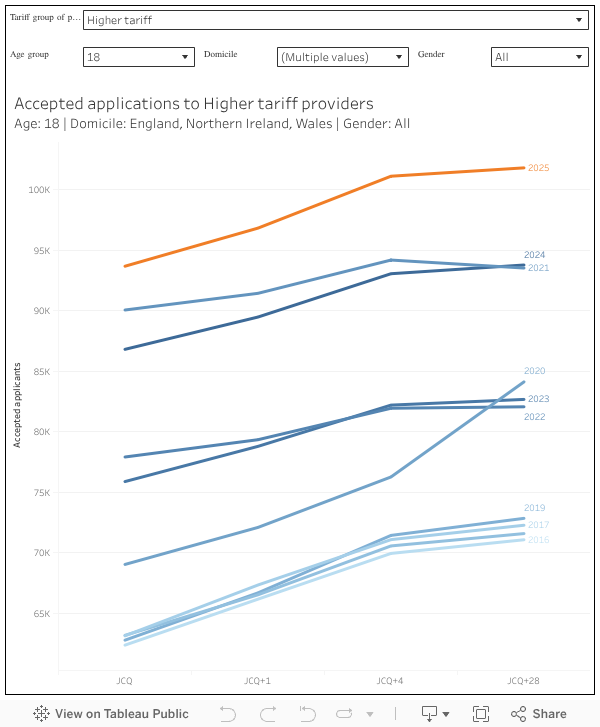
And there’s our first clue. The number of initial placements at high tariff providers (England, Wales, and NI domiciled applicants, 18 years old) was higher than the total number of placed applicants last year. Or indeed any year on record.
You don’t get that by being an aspirational destination, or by being active in Clearing. You get that by lowering the offers you make. We’ll see more in the end of cycle data, but in some cases this would be lowering them by quite a lot. Higher tariff providers didn’t take a lot of students in Clearing (we’re talking about 8,000 of this subgroup in 2025, rather than 7,000 last year or 10,000 in 2019), they took a lot of students.
Why, though?
It wasn’t a mistake. There was no underestimation of performance, because performance wasn’t meaningfully different than in any other non-pandemic year.
And it can’t be pure greed. The best data we have on the cost of educating students (audited, regulated, everything) is TRAC and we know from the last release that selective providers (who tend to be in TRAC groups A and B) tend to recover around 85 per cent of the costs of public funded teaching. If you lose £1,430 on each (price group D) student then if you take more of them that just adds to your deficit?
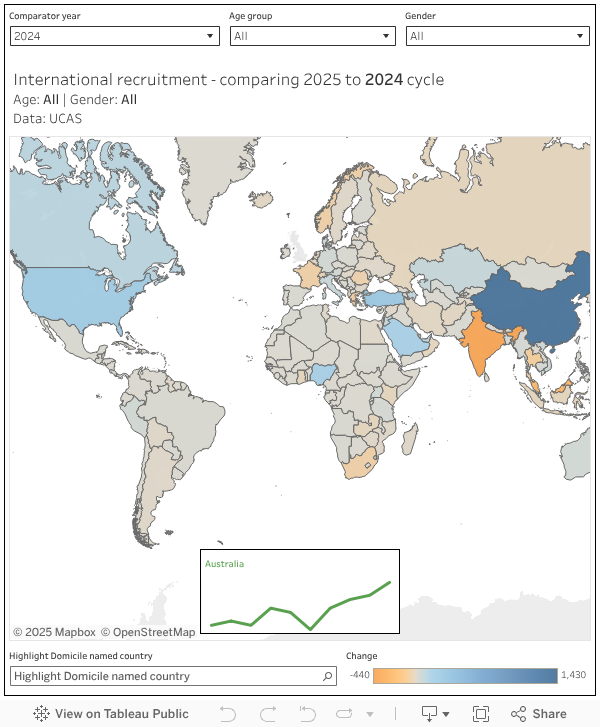
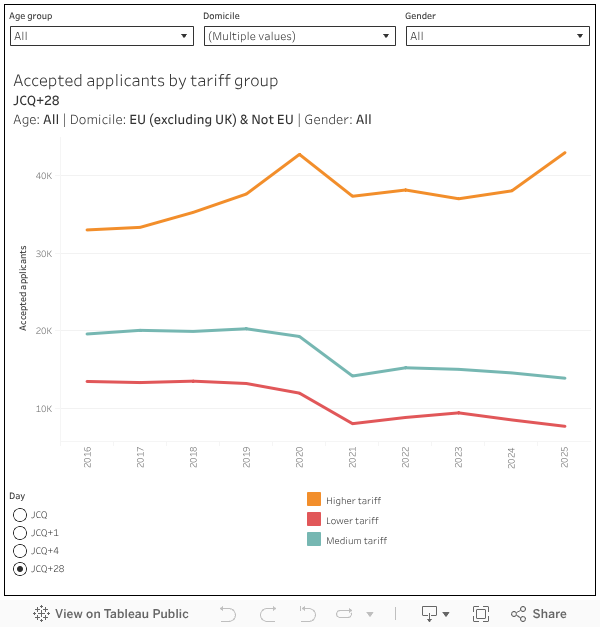
There’s a suggestion that some universities are using home students to fill spaces that would previously have gone to (higher fee paying) international students. The thinking being that even some income is better than none, and helps to sustain capacity (departments, courses, jobs) that might otherwise be lost. However, there’s not a massive difference in the number of visas issued by the Home Office, which suggests that there will be a similar number of international students this year as last (still down on 2023 and earlier, mind).
Any capacity backfilling, in other words, would have happened last year. And there’s been a sharp uptick in the proportion of international students heading to big name destinations this cycle: numbers at selective providers are now at a level above the golden age of the mid 2010s.
The extra students, then, are simply extra students over last year. Growth in numbers, pure and simple. Very few universities have the finances to substantially invest in capacity (staff, estates) – so we have to assume that this means larger classes, less individual attention, more competition for resources, and a tighter accommodation market.
The most able, and best connected, students will flourish. They pretty much always will – you could lock them in a darkened room for three years and they’d still get a good degree and a good job. It’s the rise in traditionally selective providers recruiting a substantially greater volume of students who have excellent potential but who need extra support and more opportunities to build networks and build confidence, that worries me. I hope these providers are ready to rise to what will be a new and substantial challenge.