Category: CUPA-HR Research

  • ALP 2024: Higher Ed Challenges, HR Opportunities, and a Side of Kansas City BBQ – CUPA-HR

    ALP 2024: Higher Ed Challenges, HR Opportunities, and a Side of Kansas City BBQ – CUPA-HR

    by CUPA-HR | July 31, 2024

    The road home may have been a bit bumpy (thanks, CrowdStrike), but the two days CUPA-HR leaders spent in Kansas City at the annual Association Leadership Program (ALP) were packed with opportunities to smooth the way for higher ed HR in the year ahead.

    On July 18-19, leaders from CUPA-HR’s national, region and chapter boards; cohorts from the Ignite and Emerging CUPA-HR Leaders programs; team members from the CUPA-HR national office; and key corporate partners gathered to discuss higher ed HR challenges, share successes, learn from one another, and build relationships. Here are some of the takeaways from this year’s event:

    • To be relevant and effective, higher education HR leaders must partner with their presidents and other campus leaders to connect their work to the institution’s mission and priorities and to understand current and emerging challenges for higher education.
    • CUPA-HR chapters are knocking it out of the park when it comes to creating information-packed programs to support higher ed HR professionals at the local level.
    • The key to creating and sustaining inclusive campus communities is to focus on processes, policies, and learning opportunities that mitigate bias and promote belonging and civil discourse for all. CUPA-HR resources are available to support this work!
    • Gender gaps in leadership positions persist. To expand the pipeline for leadership positions to include more women, start by reviewing promotion processes and criteria to mitigate bias and by training decision makers to recognize bias.
    • CUPA-HR higher ed workforce data is second to none, and the Research Center is an excellent source of high-level data to support workforce planning.
    • To promote civility and build authentic relationships in the workplace, speaker Alonzo Kelly emphasized the importance of:
      • Entering conversations with humility
      • Keeping in mind that your information may not be wrong, but may be incomplete
      • Being direct and kind
    • “A mistake repeated is a decision.”
    • CUPA-HR leaders lead because they are drawn to service, they are lifelong learners, and they value the friendships they’ve formed and the support they receive from the CUPA-HR community.
    • Roamin' Robyn paper doll standing by a fountain in a Kansas City ParkYou can take CUPA-HR with you wherever you go — especially if you have a Roamin’ Robyn to keep you company. Think “Flat Stanley,” but featuring CUPA-HR’s board chair, Robyn Salvo! (Thanks to Joanne Santarelli for the awesome photo!)

    Interested in Taking Your Professional Development Further?

    CUPA-HR’s volunteer leaders have committed to advancing the profession and the mission of CUPA-HR. They understand the complexities of higher ed HR, and they want to enhance the knowledge and skills they need to lead their institutions into the future.

    Are you ready to take that next step in developing your leadership skills, shaping the profession, and gaining one-of-a-kind access to successful practices and HR professionals from across the country? Then CUPA-HR leadership — in a chapter, at the region level, or even on the national board of directors — might be right for you. Learn more about how you can get involved.


    Source link

  • Data Show Women and People of Color Have Lower Representation Among the Highest-Paying Higher Ed Professional Jobs – CUPA-HR

    Data Show Women and People of Color Have Lower Representation Among the Highest-Paying Higher Ed Professional Jobs – CUPA-HR

    by CUPA-HR | July 17, 2024

    New research from CUPA-HR on the state of the professional workforce in higher education shows that women and people of color are not only being paid less than White men in the same position, but also are less likely to hold higher-paying positions.

    CUPA-HR’s research team analyzed data from the Professionals in Higher Education Survey, a comprehensive data source that collects salary and demographic data on more than 293,000 professionals in 409 positions from approximately 985 higher ed institutions, to evaluate representation and pay equity for women and professionals of color from 2016-17 to 2023-24.

    The Findings

    Women and people of color have lower representation among the highest-paying professional jobs. Women and people of color have lower representation among six-figure (i.e., paid more than $100,000) jobs in comparison to all other professional jobs. White men held 40% of six-figure jobs but held 28% of jobs paying less than $100,000.

    Pay equity has improved slightly for women over the past eight years, but women of most races/ethnicities are still paid less than White men. Except for Asian women, women of all other examined races/ethnicities were paid less than White men in 2023-24.

    Over the past eight years, the representation of people of color increased among higher ed professionals; the increase in the representation of women of color was more than double the increase in the representation of men of color. The representation of people of color increased from 22% of professionals in 2016-17 to 26% of professionals in 2023-24. During this time, women of color had more than two times the increase in their representation than did men of color (26% increase for women versus 10% increase for men).

    Older women experience greater pay gaps than younger women. Women over age 42 had larger pay gaps relative to White men than did women age 42 or younger.

    Explore the interactive graphics and read the full report, The Higher Ed Professional Workforce: Composition and Pay Equity by Gender and Race/Ethnicity From 2016-17 to 2023-24.


    Source link

  • More Than Half of Financial Aid Employees Likely to Seek Other Employment Within the Next Year – CUPA-HR

    More Than Half of Financial Aid Employees Likely to Seek Other Employment Within the Next Year – CUPA-HR

    by CUPA-HR | May 13, 2024

    A majority of those who work in financial aid at the nation’s colleges and universities are job hunting, according to new research from CUPA-HR and the National Association of Student Financial Aid Administrators (NASFAA). What are they looking for? Better pay, opportunities to work remotely and a more flexible schedule.

    A new report examining pay, pay equity, staffing, representation and retention in the higher ed financial aid workforce outlines several findings from analyses of data of financial aid employees from CUPA-HR’s 2022-23 higher ed workforce surveys and the 2023 Higher Education Employee Retention Survey. Positions included in the analyses are chief student financial aid officers, deputy heads of financial aid and student financial aid counselors.

    The analyses found that more than half (56%) of financial aid employees are at least somewhat likely to seek other employment opportunities within the next 12 months, with 1 in 3 (33%) being likely or very likely to do so. Four in 5 (79%) rank a pay increase as one of the top three reasons they would seek other employment opportunities, while 3 in 5 (59%) rank an opportunity to work remotely as one of the top three reasons they would seek other employment opportunities. The desire for a flexible schedule is also ranked as a top reason for seeking other employment by nearly 2 in 5 (37%) financial aid employees.

    Other Findings

    • Institutions with the highest number of FAFSA applications have far more student financial aid counselors than institutions with the lowest number of FAFSA applications. At each increase in FAFSA application quartile, the median number of student financial aid counselors per institution doubles (or nearly doubles). Institutions with the greatest number of FAFSA applications on median have six more student financial aid counselors than institutions with the least number of FAFSA applications.
    • On median, institutions have four financial aid employees working in one of the three examined positions. Thirteen percent of institutions have a one-person financial aid office. Even the institutions that process the lowest number of FAFSA applications tend to have need for more than one person working in their office – over half of these institutions have at least three people in their financial aid office.
    • The representation of people of color declines as the level of financial aid position increases. The representation of people of color is almost two times higher among student financial aid counselors than among chief student financial aid officers. The representation of women overall among chief student financial aid officers is lower than the representation of women within the lower-level financial aid positions, but the difference is much smaller than the declines seen for people of color.
    • Pay equity is lower among chief student financial aid officers than among lower-level financial aid positions. Black women and Hispanic or Latino men are paid equitably within student financial aid counselor and deputy head of student financial aid positions, but not within the chief student financial aid officer position. At each increase in position level, White women’s pay relative to White men in the same position decreases. White women are paid equitably to White men in student financial aid counselor positions but are paid only 94 cents per $1 paid to White men in chief student financial aid officer positions.
    • Among financial aid employees, years in position is lowest among student financial aid counselors. Of all financial aid positions, student financial aid counselors have the highest concentration of people who have been in their position for fewer than two years (43%). Retention is better among deputy heads of student financial aid and chief student financial aid officers; one-third have been in their position for 10 years or longer.

    Read the full report, The Higher Education Financial Aid Workforce: Pay, Representation, Pay Equity, and Retention, and explore the interactive graphics.


    Source link

  • Voluntary Turnover in the Higher Ed Workforce Is Trending Downward – CUPA-HR

    Voluntary Turnover in the Higher Ed Workforce Is Trending Downward – CUPA-HR

    by CUPA-HR | May 8, 2024

    The workforce retention challenges higher education has been experiencing post-pandemic might just be letting up. A recent trend analysis of turnover data collected in CUPA-HR’s annual higher education workforce surveys found that in 2023-24, voluntary turnover rates for faculty and staff trended downward for the first time in three years.

    CUPA-HR began collecting turnover data in 2017-18. In the three years prior to the pandemic, there was little variability year to year in voluntary turnover (voluntary separations not due to retirement), and in the year immediately following the pandemic’s onset (2020-21), there were slight dips in voluntary turnover for each category of staff and faculty, likely due to the economic uncertainty that characterized that year. However, voluntary turnover trended upward in 2021-22 and again in 2022-23, with the highest voluntary turnover occurring in 2022-23.

    The largest decline in voluntary turnover rates was for part-time non-exempt staff (down 6.4 percentage points, from 21.4% in 2022-23 to 15.0% in 2023-24). However, there were notable declines in voluntary turnover for full-time exempt staff and full-time non-exempt staff as well.

    Findings on Overall Current Turnover

    • In considering turnover from all types of separations (i.e., voluntary and involuntary), overall turnover of faculty and staff combined in 2023-24 was 14%. Turnover in 2023-24 was higher than pre-pandemic rates (approximately 12%), but lower than the 16% high of 2022-23.
    • In 2023-24, overall turnover was highest for part-time non-exempt staff (22%) and lowest for faculty (7% for tenure-track and 11% for non-tenure-track faculty).
    • Involuntary turnover rates were highest for full-time non-exempt staff (2.1%) and full-time exempt staff (1.4%). Retirement rates were highest for tenure-track faculty (2.2%) and full-time non-exempt staff (2.0%).

    Explore the Higher Ed Workforce Turnover interactive graphics.


    Source link

  • Data Show Women and People of Color Aren’t Advancing to Higher Faculty Ranks at the Same Rate as White Men – CUPA-HR

    Data Show Women and People of Color Aren’t Advancing to Higher Faculty Ranks at the Same Rate as White Men – CUPA-HR

    by CUPA-HR | May 2, 2024

    New research from CUPA-HR on the state of the faculty workforce in higher education shows that despite some growth in representation among tenure-track women and faculty of color in new hires, advancement to higher faculty ranks remains a barrier. What’s more, these promotion gaps are found in every faculty discipline.

    CUPA-HR’s research team analyzed data from the Faculty in Higher Education Survey, a comprehensive data source that collects salary and demographic data by tenure status, rank, and faculty discipline, to evaluate representation and pay equity for women and faculty of color from 2016-17 to 2022-23.

    In addition to the finding that women and faculty of color are not being promoted to senior faculty ranks at the same rate as White men, the data also show that women, Black, and Hispanic or Latina/o faculty are better represented in non-tenure-track than in tenure-track positions, and that pay gaps in non-tenure-track positions persist for these groups. Combined with the fact that these groups are less likely to be promoted to higher ranks in tenure-track positions, the result is that a substantial segment of faculty, primarily women and people of color, are employed in positions that pay lower salaries throughout their careers.

    Other Findings

    Tenure-track faculty positions are on the decline. There has been a decline in tenure-track positions and a corresponding increase in non-tenure-track positions over the past seven years. In 2016-17, tenure-track roles accounted for 73% of faculty, but by 2022-23, this proportion fell to 66%, with a marked increase in non-tenure-track positions over the last two years. Additionally, the percentage of new tenure-track assistant professor hires dropped in recent years, indicating a trend toward more new non-tenure-track hires.

    The representation of women and people of color in tenure-track faculty positions is increasing, yet challenges remain. There was a notable increase in the representation of tenure-track (TT) women and faculty of color from 2016-17 to 2022-23. In 2022-23, more than one-fourth (26%) of TT faculty were people of color. This marks a 28% increase over the span of seven years, compared to 2016-17, when faculty of color constituted closer to one-fifth (21%) of all TT faculty. However, the growth in racial/ethnic representation still lags when compared to the demographic composition of U.S. doctoral degree holders. Further, despite strides toward pay equity for tenure-track faculty of color, White women in tenure-track positions still face persistent pay gaps in 2022-23.

    Explore the interactive graphics and read the full report, Representation and Pay Equity in Higher Education Faculty: A Review and Call to Action.


    Source link

  • Higher Education Pay Increases in 2023 Exceeded Inflation for the First Time Since the Pandemic – CUPA-HR

    Higher Education Pay Increases in 2023 Exceeded Inflation for the First Time Since the Pandemic – CUPA-HR

    by CUPA-HR | March 27, 2024

    New research from CUPA-HR has found that median pay increases for most higher education employees in 2023-24 continued the upward trend seen last year (and exceeded the inflation rate for the first time since 2019-20). However, the findings also show that most higher ed employees are still being paid less than they were in 2019-20 in inflation-adjusted dollars.

    The largest gap between pre-pandemic inflation-adjusted salaries and current salaries is for tenure-track faculty (earning 9.7% less), followed by non-tenure-track teaching faculty (earning 8.2% less). The smallest gap is for staff (earning only 0.3% less).

    Other key findings from an analysis of CUPA-HR’s higher ed workforce salary survey data from 2016-17 to 2023-24 include:

    • Non-tenure-track teaching faculty received their highest raise in the past eight years.
    • Staff (generally non-exempt employees) received the highest increase in pay in comparison to other employee types. This was true last year as well.
    • Tenure-track faculty continued to receive the lowest pay increases (and were the only group of employees whose raise did not surpass inflation).

    Across higher ed, employees are still being paid less than they were in 2019-20 (pre-pandemic) in inflation-adjusted dollars. Tenure-track faculty are the group with the largest gap between median salaries in 2019-20 adjusted to 2023-24 dollars and actual median salaries in 2023-24, earning 9.7% less. This is followed by non-tenure-track teaching faculty (earning 8.2% less). The smallest gap is for staff (earning only 0.3% less).

    High inflation has only exacerbated the gaps in pay increases faculty (particularly tenure-track faculty) experience in relation to other higher ed employees. Further, even though most higher ed employee groups received raises that beat inflation in 2023-24, these raises did not reverse the erosion of higher ed employee purchasing power that has been occurring since 2019-20.

    Explore this data and more in CUPA-HR’s newest interactive graphic.

    CUPA-HR Research

    CUPA-HR is the recognized authority on compensation surveys for higher education, with its workforce surveys designed by higher ed HR professionals for higher ed HR professionals and other campus leaders.


    Source link

  • Newly Updated CUPA-HR Data Shed Light on Trends in Representation and Pay Equity in the Higher Ed Workforce – CUPA-HR

    Newly Updated CUPA-HR Data Shed Light on Trends in Representation and Pay Equity in the Higher Ed Workforce – CUPA-HR

    by Julie Burrell | January 22, 2024

    Progress in both representation and equitable pay for women and people of color remained sluggish in most roles on college and university campuses in academic year 2022-23, according to the newest data. Through several interactive graphics representing years of research, CUPA-HR highlights the progress that has been made and the disparities that persist. The data track gender and racial composition as well as pay of administrative, faculty, professional, and staff roles, collected from CUPA-HR’s signature surveys.

    While the representation of women and people of color across all roles has steadily increased, inequity remains, especially when it comes to compensation for women and people of color. However, there were some notable areas of progress when it comes to compensation. Asian women and men of color (except for Native American/Alaskan Native men) in administrative roles saw better pay equity than most other groups.

    Administrators

    The share of racial and ethnic minorities in administrative roles continued to grow over the past decade, but gaps in both representation and pay remained steady. This is especially true for women of color, who represented less than 11% of these roles and, for the most part, received lower salaries than White men.

    In 2022-23, people of color made up 18.7% of administrators, up from 12.9% in 2011-12. Although the proportion of people of color in higher ed administrator positions grew steadily over the last decade, these increases have not kept pace with the rate at which minorities are obtaining graduate degrees.

    No improvement was shown in pay disparities for most women administrators. All female administrators except for Asian women received lower salaries than White men. Conversely, men of color, except for Native American/Alaskan Native men, were paid salaries greater than those of White men.

    The Administrators in Higher Education Survey collects data on administrator positions that manage a higher ed institution or a division within it.

    See the Administrators Composition and Pay Equity by Gender and Race/Ethnicity interactive graphics, as well as data broken out by CEO, provost and chief HR officer.

    Faculty

    There are two notable findings regarding faculty composition. First, more women faculty were represented in non-tenure-track roles than in tenure-track roles in 2022-23. Second, with each increase in rank, the proportions of women faculty and faculty of color decreased for both tenure-track and non-tenure-track faculty. Taken together, this means that women were over-represented in the lowest-paying and lowest-ranking positions.

    Pay gaps within rank persist, particularly for women faculty at the professor level, regardless of tenure status. These gaps are most notable for female professors of color in non-tenure-track positions. Pay gaps for assistant and associate professors have narrowed over time, particularly for tenure-track faculty.

    The factor that most impacts faculty pay is promotion to a higher rank, which is often the only time faculty receive significant increases in salary. When there is bias in promoting women and faculty of color to successive ranks, as our data continued to show, this results in career earnings gaps that far exceed what is often detected in pay equity studies within rank for a given year.

    The Faculty in Higher Education Survey collects data on tenure-track faculty positions and non-tenure-track teaching faculty positions.

    See the Faculty Composition and Pay Equity by Gender and Race/Ethnicity interactive graphics.

    Professionals

    In academic year 2022-23, women of all races and ethnicities were paid less than their male counterparts in professional roles, while women’s representation increased from 58% to 61% across all professional positions since 2016-17. The growth is due to slight increases in the representation of women of color, from 13.1% in 2016-17 to 15.7% in 2022-23.

    Representation by gender and race/ethnicity varied widely by position. Human resources had the greatest share of women professionals, with 82% being women, including 28% women of color. Information technology had the lowest percentage of professional women (27%), and librarians and development/fundraising professionals had the lowest representation of professionals of color (14%).

    While pay was more equitable for most groups (apart from Hispanic/Latina women and men of two or more races), pay disparities persisted. Women of all races and ethnicities were paid less than their male counterparts. In addition, Hispanic/Latino men, Native Hawaiian men, and men of two or more races were paid less than White men.

    The Professionals in Higher Education Survey collects data on positions in specific functional areas in higher ed institutions, such as academic or student services, that usually require a baccalaureate degree.

    See the Professionals Composition and Pay Equity by Gender and Race/Ethnicity interactive graphics.

    Staff

    Staff roles continued to have a higher representation of people of color than any other higher ed employee group last year. Staff also continued to be the lowest-paying positions in higher ed, with women particularly hard hit by pay disparities.

    In 2022-23, women of color represented about 19% of all higher ed staff, and men of color represent about 13% of all higher ed staff — a modest increase since 2016-17. Skilled craft employees were the least racially diverse, a finding that has persisted across the past six years. Notably, skilled craft staff are among the highest-paid staff positions.

    Since 2016-17, women were paid consistently and considerably less than White men. Pay equity for American Indian/Alaska Native women, Asian women, and Native Hawaiian/Other Pacific Islander women was better in 2022-23 than in 2016-17. Pay equity was the same or worse in 2022-23 than in 2016-17 for Black women, Hispanic/Latina women, women of two or more races, and White women. Men of color fared considerably better than women of color when it came to pay equity.

    The Staff in Higher Education Survey collects data on positions that are generally non-exempt and do not require a college degree.

    See the Staff Composition and Pay Equity by Gender and Race/Ethnicity interactive graphics.

    CUPA-HR Research

    CUPA-HR is the recognized authority on compensation surveys for higher education, with its workforce surveys designed by higher ed HR professionals for higher ed HR professionals and other campus leaders.


    Source link

  • Pay Equity Still Lags for Women Administrators – CUPA-HR

    Pay Equity Still Lags for Women Administrators – CUPA-HR

    by Julie Burrell | November 29, 2023

    An analysis of two decades worth of CUPA-HR data on gender and pay in higher ed administrative roles paints a troubling picture of pay equity. In 2022, women made up 51% of administrators in college and universities, but they were paid 93 cents for each dollar a man in an administrator position was paid. This represents an increase of just 3 cents from 2002, when women made 90 cents for each dollar a man was paid.

    Among chief human resources officers, the pay disparity is even wider. Though three in four (76%) of CHROs are women, their pay in 2022 was only 89 cents for each dollar male CHROs were paid. Deputy CHROs who are women were paid only 83 cents, a figure that remained unchanged from 2002 through 2022.

    The Higher Ed Administrators: Trends in Diversity and Pay Equity From 2002 to 2022 report also found that people of color — women especially — are increasingly represented in administrative positions. Drawing on 10 years of data, CUPA-HR found that between 2012 and 2022, the representation of people of color in higher ed administration increased by 41%. In 2012, people of color comprised 13% of administrators and in 2022, 18% of administrators. Women of color went from comprising 7% of higher ed administrators in 2012 to 10% of higher ed administrators in 2022.

    Despite these gains in representation, women of most races and ethnicities are still paid less than White men in the same administrator positions.

    The Report’s Major Findings Include:

    • The past 20 years saw an increase of 20% of women in administration, from 43% in 2022 to 51% in 2022, but pay equity for women has not kept pace. In 2002, women in administrator positions were paid 90 cents for each dollar men in administrator positions were paid. Two decades later, women in administrator positions were paid just 93 cents for each dollar men in administrator positions are. These wage gaps are not explained by the fact that women may have greater representation in lower-paying positions.
    • From 2012-2022, the representation of people of color in administrative roles increased by 41%. The biggest increases were among administrators of two or more races (290% increase) and Asian administrators (76%). Women of color have seen more than double the percentage increase in representation than men of color (54% increase for women versus 26% for men).
    • But people of color are still underrepresented in administrative positions. Using the percentage of people of color with U.S. graduate degrees (31%) as a comparison, we find that only 18% of higher ed administrators were people of color in 2022.
    • Women’s representation in executive roles increased, but pay inequity still exists. In 2022, women held one in three campus presidencies, an increase of 60% from 2002. In 2002, female presidents were paid 92 cents on the dollar to male presidents and saw only a 1-cent increase in the 20 years since. The worst pay equity for presidents was for Hispanic or Latina women, who were paid 82 cents per dollar paid to White men. In the same time span, the representation of women provosts increased, comprising nearly half (48%) of provosts in 2022. The gender pay gap narrowed as well: Female provosts were paid 91 cents on the dollar compared to male provosts in 2002, and in 2022, female provosts were paid 96 cents on the dollar compared to male provosts.
    • CHRO gender pay equity remains low. In 2022, three in four (76%) CHROs were women, with White women representing 60%. In 2002, female CHROs were paid 86 cents for each dollar male CHROs were paid. In 2022, female CHROs were paid only 89 cents for each dollar male CHROs were paid.

    Addressing the Administrative Pay Gap

    Addressing pay inequity and increasing the representation of people of color among higher ed administrators requires long-term solutions like conducting pay analyses. CUPA-HR’s DataOnDemand for the Administrators in Higher Education Survey features the most comprehensive data available on higher ed administrator salaries, as well as data on pay equity and representation for women and people of color for every administrative position.

    Recruiting a more diverse pool of faculty candidates and mitigating bias in faculty promotions are also important to succession planning, as one notable path to the presidency is to start off as a faculty member, ascend to dean, then to provost, and then to president.

    You also might consider what talent pipeline programs exist on your campus. For inspiration, see these models of internal talent development:


    Source link

  • Keys to Retaining Supervisors in a Time of Turnover – CUPA-HR

    Keys to Retaining Supervisors in a Time of Turnover – CUPA-HR

    by CUPA-HR | October 3, 2023

    While the ongoing turnover crisis impacts all of higher ed, supervisors are among the hardest hit. In our recent study, The CUPA-HR 2023 Higher Education Employee Retention Survey, supervisors say they’re grappling with overwork and added responsibilities (especially when their staff members take other jobs), while struggling to maintain morale.

    Supervisor retention is especially critical in a time of turnover, as these are the employees we rely on most to preserve institutional knowledge and provide continuity amid transition. But our research shows that many supervisors are not getting the kinds of institutional support they need. By empowering managers to make decisions on behalf of their staff, institutions make it less likely that their supervisors will seek employment opportunities elsewhere.

    The Supervisor’s Perspective

    Taking a closer look at the data, it’s clear that supervisors are overworked and under-resourced. Seven in ten work more hours than what is expected of full-time employees at their institution. Nearly double the percentage of supervisors versus non-supervisors agree that it is normal to work weekends and that they cannot complete their job duties working only their institution’s normal full-time hours.

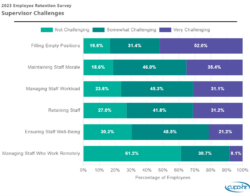
    Supervisors are also facing challenges unique to their leadership roles. Filling vacant positions and maintaining the morale of their staff are their chief worries:

    Strategies for Supervisor Retention

    Given the pressures supervisors are under, what can institutions do to ensure that their top talent won’t seek other employment? While common retention incentives like increased pay and recognition are crucial, supervisors need improved institutional support.

    Our data show that supervisors are in need of the following:

    When supervisors are empowered in these ways, they are less likely to be among the 56 percent of employees who say they’re at least somewhat likely to search for a new job in the coming year.

    Additional Resources

    Managing Stress and Self-Care: “No” Is a Complete Sentence (On-Demand Webinar, August 2023)

    Ready to Crack: Solutions for HR Managers Dealing With Burnout (Spring 2022)

    Health and Well-Being Toolkit

    Management and Supervisor Training Toolkit


    Source link

  • Hybrid, Remote and Flexible Work: The Secret Sauce for Employee Retention? – CUPA-HR

    Hybrid, Remote and Flexible Work: The Secret Sauce for Employee Retention? – CUPA-HR

    by CUPA-HR | September 19, 2023

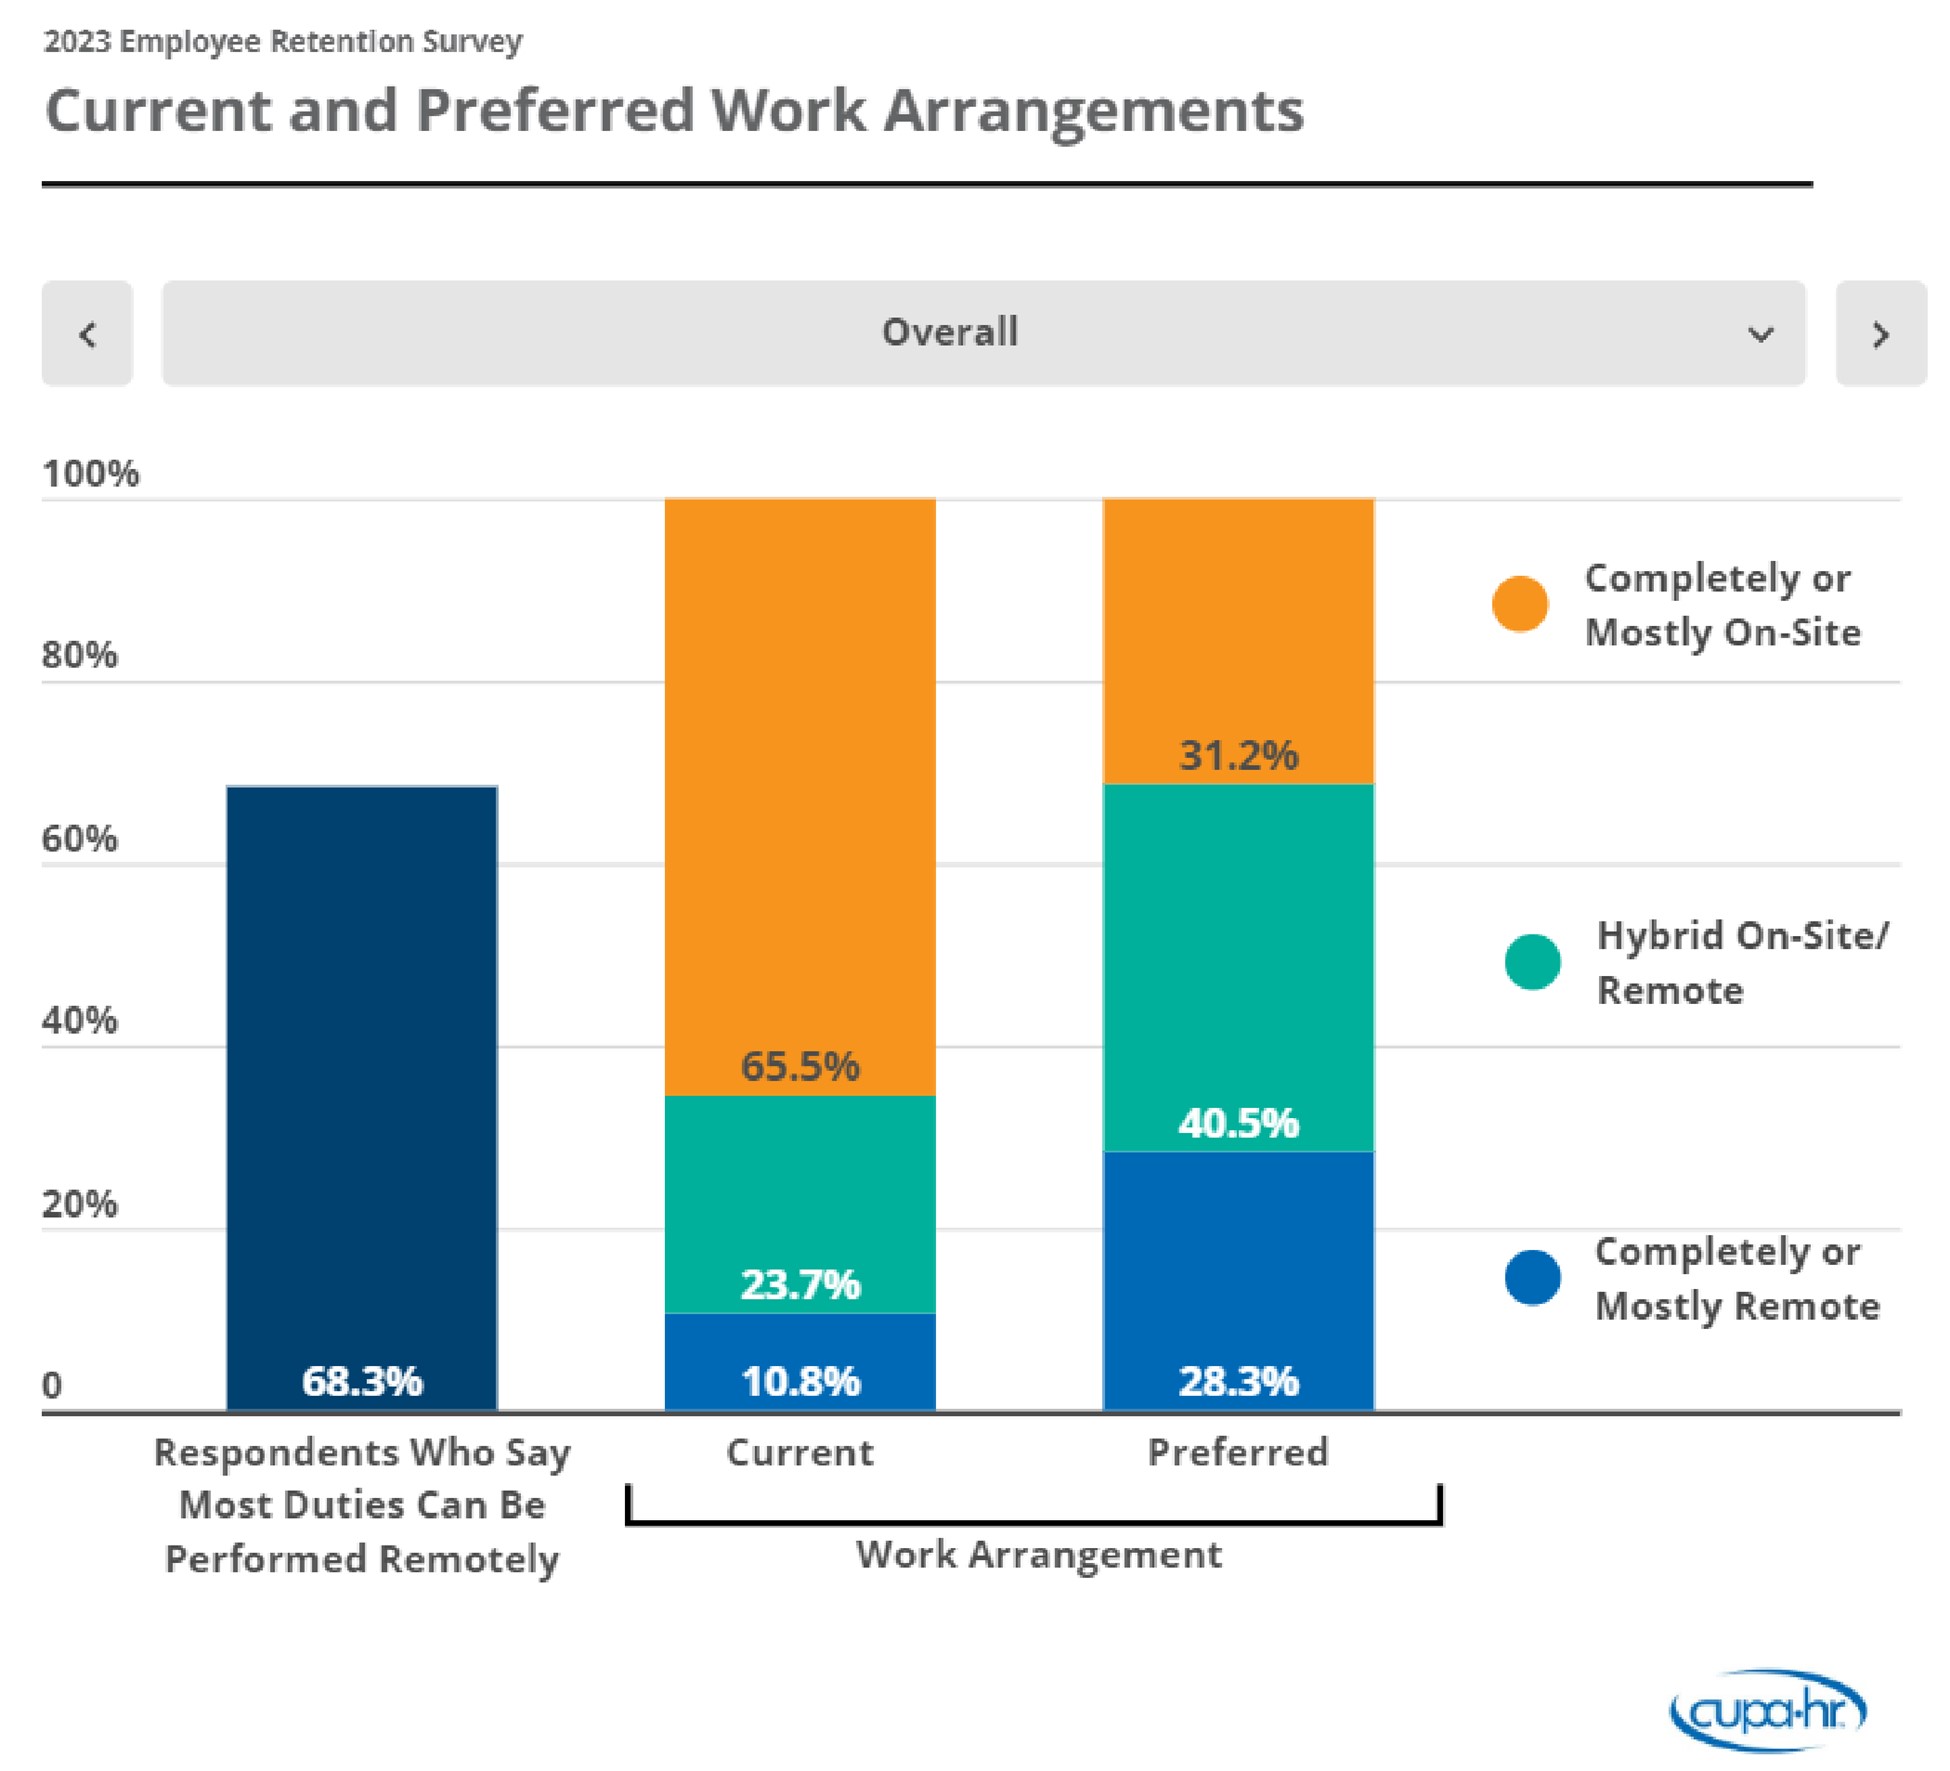
    Given the number of employees who successfully executed their work remotely at the height of the pandemic, it may come as no surprise that a substantial gap exists between the work arrangements that higher ed employees want and what institutions offer. According to the new CUPA-HR 2023 Higher Education Employee Retention Survey, although two-thirds of employees state that most of their duties could be performed remotely and two-thirds would prefer hybrid or remote work arrangements, two-thirds of employees are working completely or mostly on-site.

    Inflexibility in work arrangements could be costly to institutions and contribute to ongoing turnover in higher ed. Flexible work is a significant predictor of employee retention: Employees who have flexible work arrangements that better align with their preferences are less likely to look for other job opportunities.

    Flexible Work Benefits: A No-Brainer for Retention

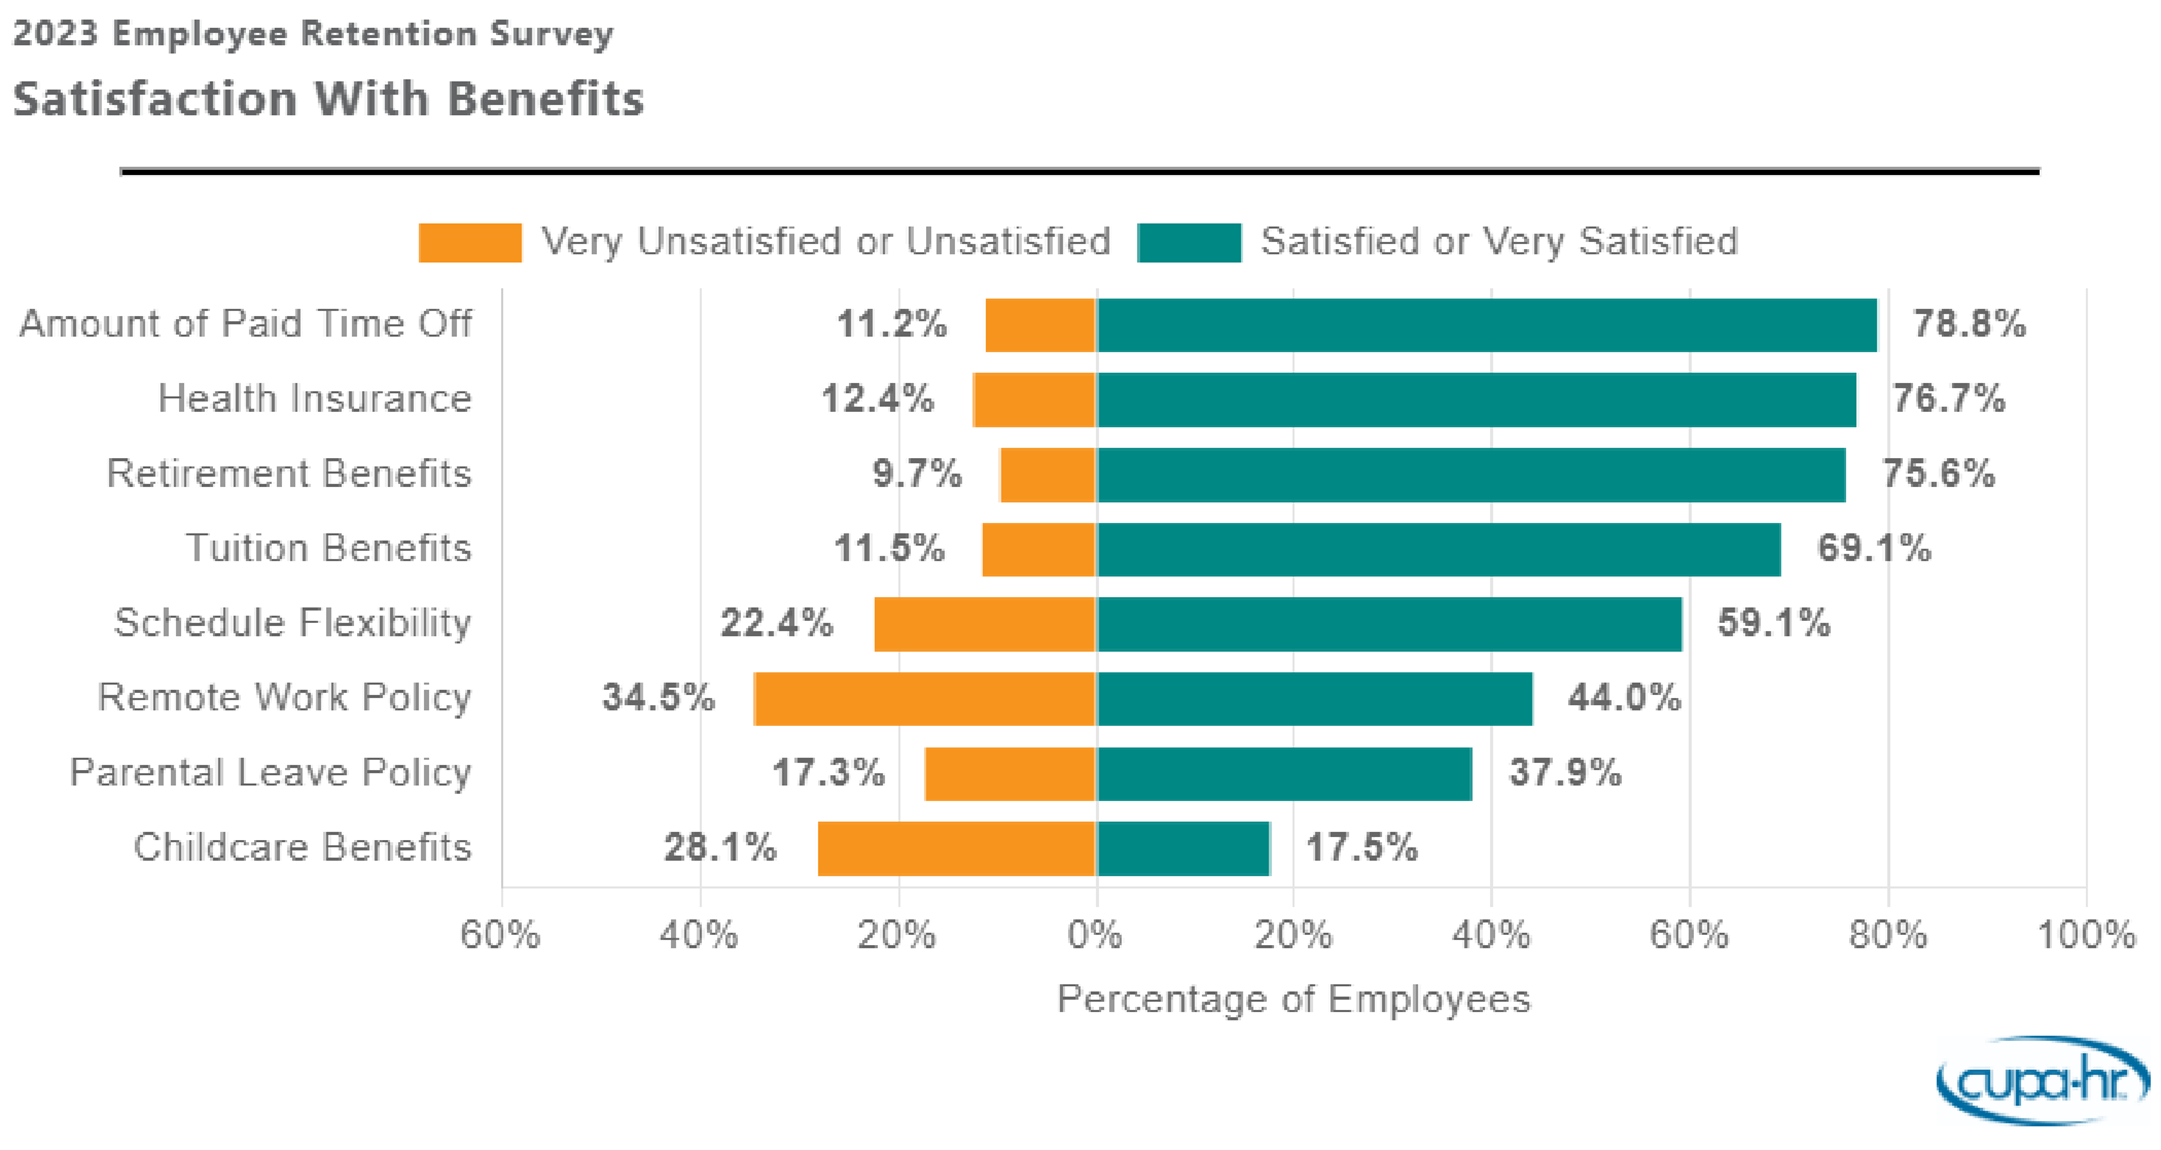
    While more than three-fourths of employees are satisfied with traditional benefits such as paid time off and health insurance, survey respondents were the most dissatisfied with the benefits that promote a healthier work-life balance. These include remote work policies and schedule flexibility, as well as childcare benefits and parental leave policies.

    Most employees are not looking for drastic changes in their work arrangements. Even small changes in remote policies and more flexible work schedules can make a difference. Allowing one day of working from home per week, implementing half-day Fridays, reducing summer hours and allowing employees some say in their schedules are all examples of flexible work arrangements that provide employees some autonomy in achieving a work-life balance that will improve productivity and retention.

    A more flexible work environment could be an effective strategy for institutions looking to retain their top talent, particularly those under the age of 45, who are significantly more likely not only to look for other employment in the coming year, but also more likely to value flexible and remote work as a benefit. Flexible work arrangements could also support efforts to recruit and retain candidates who are often underrepresented: the survey found that women and people of color are more likely to prefer remote or hybrid options.

    Three Things You Can Do

    1. Use Data to Make a Case for Change. The CUPA-HR 2023 Higher Education Employee Retention Survey provides multiple data points that support remote, hybrid and flexible work for the retention and recruitment of top talent.
    1. Explore CUPA-HR Resources. Discover best practices and policy models for navigating the challenges that come with added flexibility, including managing a multi-state workforce:
    1. Remember the Two-Thirds Rule. In reevaluating flexible and remote work policies, remember: Two-thirds of higher ed employees believe most of their duties can be performed remotely and two-thirds would prefer hybrid or remote work arrangements, yet two-thirds are compelled to work mostly or completely on-site.

    You may also be interested in:


    Source link