by CUPA-HR | March 1, 2023
When it comes to representation and pay equity for women and people of color in the higher education workforce, colleges and universities have frequently struggled to make meaningful progress. Through several new interactive graphics representing years of research, CUPA-HR shines a light on the progress that has been made and the disparities that persist. These graphics represent data from CUPA-HR’s four signature higher ed workforce surveys — Administrators, Faculty, Professionals, and Staff — through 2022.
Administrators
While the proportion of people of color in higher ed administrator positions has grown steadily over the last 10 years, these increases have not kept pace with the rate at which minorities are obtaining graduate degrees. In 2022, people of color made up 18.2 percent of administrators, up from 12.9 percent in 2012.
The data also show that pay gaps for women administrators of all races/ethnicities are consistent across the past 10 years and notably wide. Pay inequity is particularly egregious for women administrators of color (with the exception of Asian women). Men of color, on the other hand, have been paid salaries equitable to or greater than those of White men in recent years.
The Administrators in Higher Education Survey collects data on administrator positions that manage a higher ed institution or a division within it.
See the Administrators Composition and Pay Equity by Gender and Race/Ethnicity interactive graphics, as well as data broken out by CEO, provost and chief HR officer.
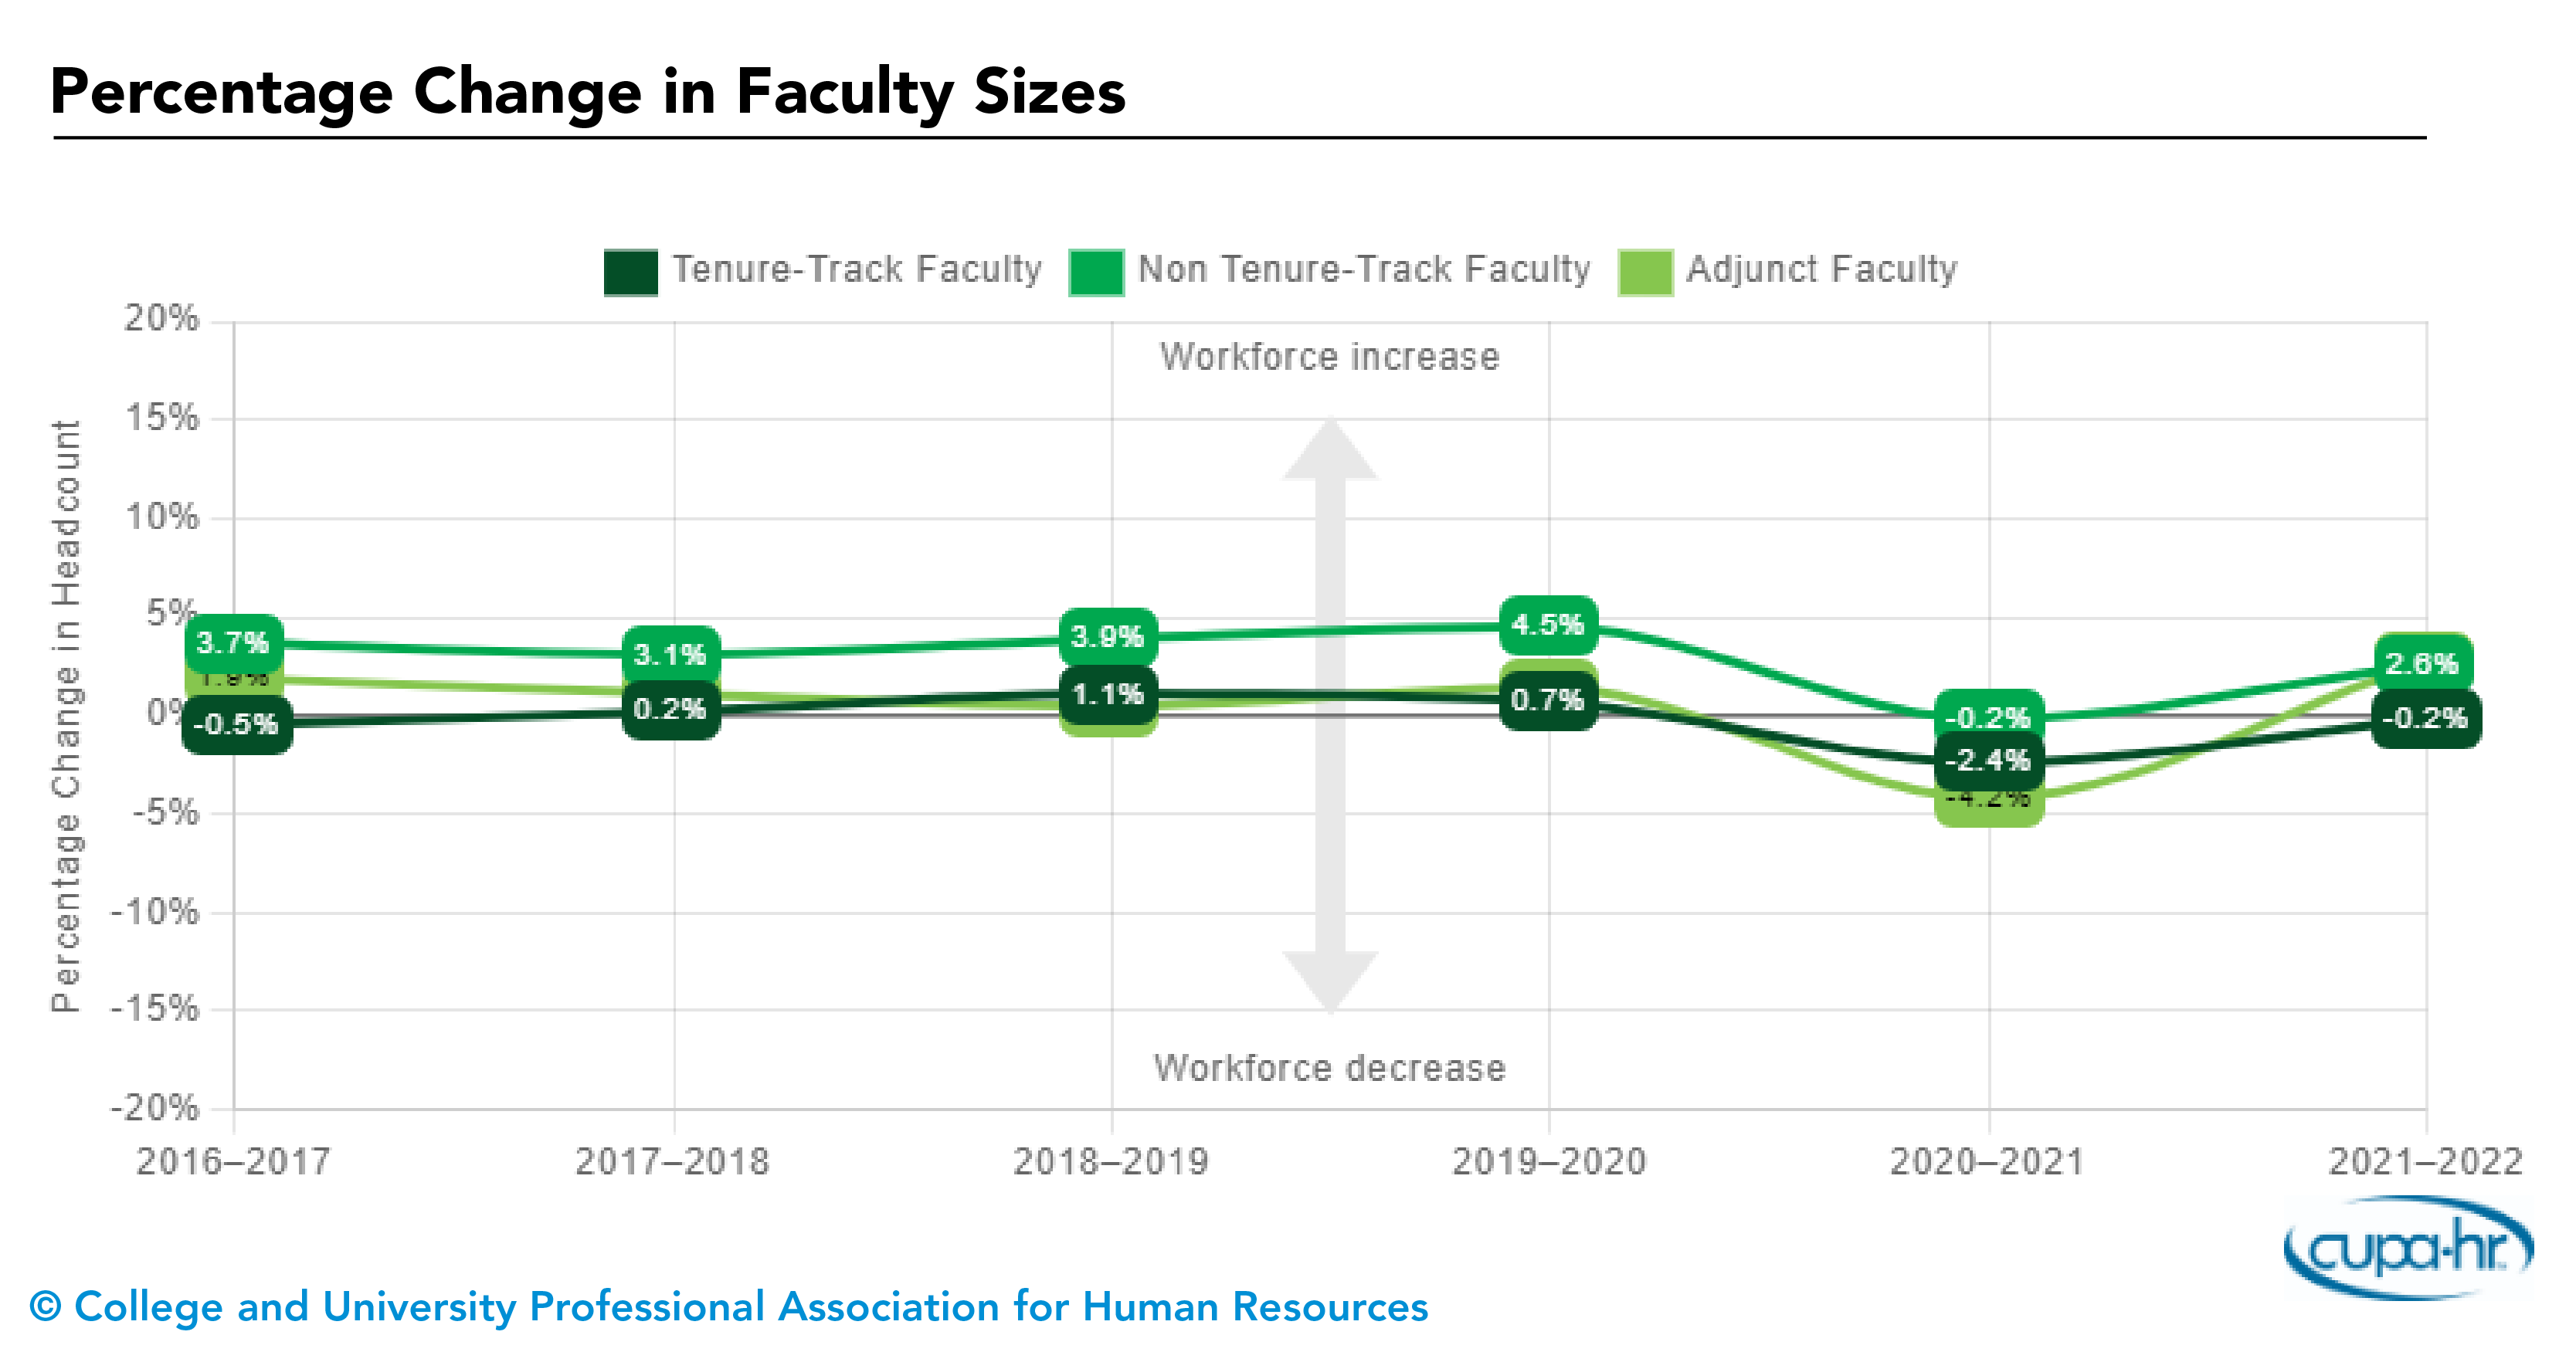
Faculty
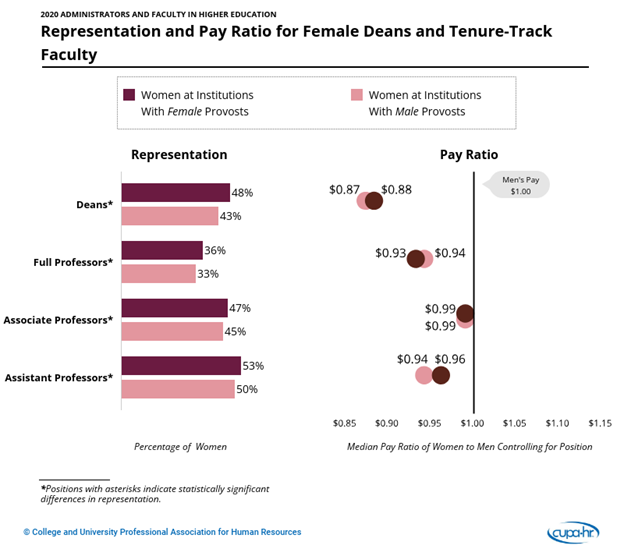
There are two notable findings in faculty composition. First, more women are represented in non-tenure-track than in tenure-track faculty. Second, for each tenure status and with each increase in rank, the proportions of women and faculty of color decrease. This means that women are over-represented in the lowest-paying and lowest-ranking positions. This remains the case despite the fact that the proportion of women and faculty of color have increased slightly at each rank over the past five years.
Pay gaps for women faculty, regardless of tenure status or rank, continue to persist, particularly at the rank of professor. These gaps are most notable for women of color. Pay gaps at other ranks have narrowed over time, particularly for tenure-track faculty. Importantly, the factor that most impacts faculty pay is promotion to a higher rank. Often, the only significant increases in salary happen with these promotions. These data show that the only group that has greater representation with each increase in rank is that of White male faculty, and this pattern has persisted over time.
The Faculty in Higher Education Survey collects data on tenure-track faculty positions and non-tenure-track teaching faculty positions.
See the Faculty Composition and Pay Equity by Gender and Race/Ethnicity interactive graphics.
Professionals
Women’s representation has increased across all professionals’ positions since 2017, and in 2022, women represented more than 60 percent of higher ed professionals. This change is due to slight increases in representation of women of color since 2017. In 2022, representation of people of color was 24 percent overall, with the highest percentage among human resources professionals (34 percent) and diversity and equal opportunity professionals (33 percent).
In 2022, women were consistently paid less than White men, a pattern that has worsened since 2017. However, men of color were paid more equitably in 2022 compared to previous years.
The Professionals in Higher Education Survey collects data on positions in specific functional areas in higher ed institutions, such as academic or student services, that usually require a baccalaureate degree.
See the Professionals Composition and Pay Equity by Gender and Race/Ethnicity interactive graphics.
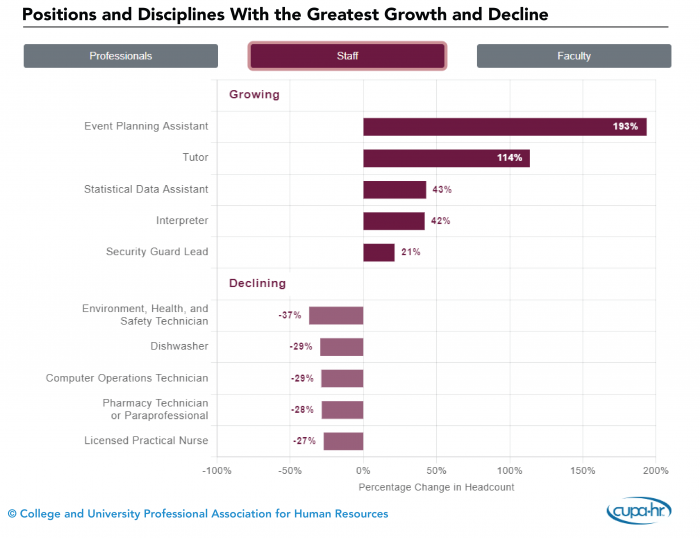
Staff
Staff employees have a higher representation of people of color than any other higher ed employee group. This is notable in that these are the lowest-paying positions in higher ed. In 2022, women of color represented about 19 percent of all higher ed staff, and men of color represented about 13 percent of all higher ed staff. These numbers have increased since 2017, though modestly. Skilled craft employees were the least racially diverse group, as 80 percent were White men, a finding that has persisted across the past six years. Notably, skilled craft staff are among the highest-paid staff positions.
Since 2017, women in staff positions have been paid consistently and considerably less than White men in staff positions, a pattern that has worsened over time, particularly for women in office and clerical positions. Men of color were paid more equitably in 2022 when compared to 2017.
The Staff in Higher Education Survey collects data on positions that are generally non-exempt and do not require a college degree.
See the Staff Composition and Pay Equity by Gender and Race/Ethnicity interactive graphics.
CUPA-HR Research
CUPA-HR is the recognized authority on compensation surveys for higher education, with its workforce surveys designed by higher ed HR professionals for higher ed HR professionals and other campus leaders. CUPA-HR has been collecting data on the higher ed workforce for more than 50 years, and we maintain one of the largest workforce databases in existence. CUPA-HR also publishes numerous research publications and interactive graphics highlighting trends and issues around higher ed workforce planning, pay equity, representation of women and racial/ethnic minorities and more. Learn more about CUPA-HR research.
Share This Article:


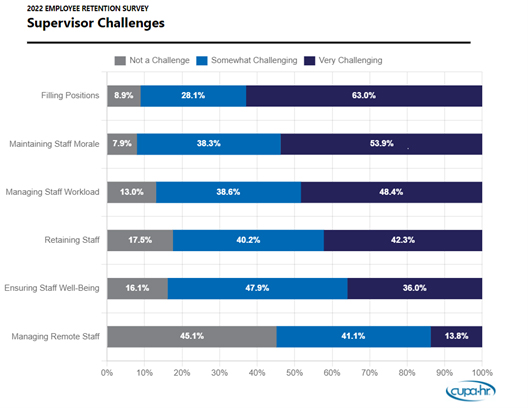
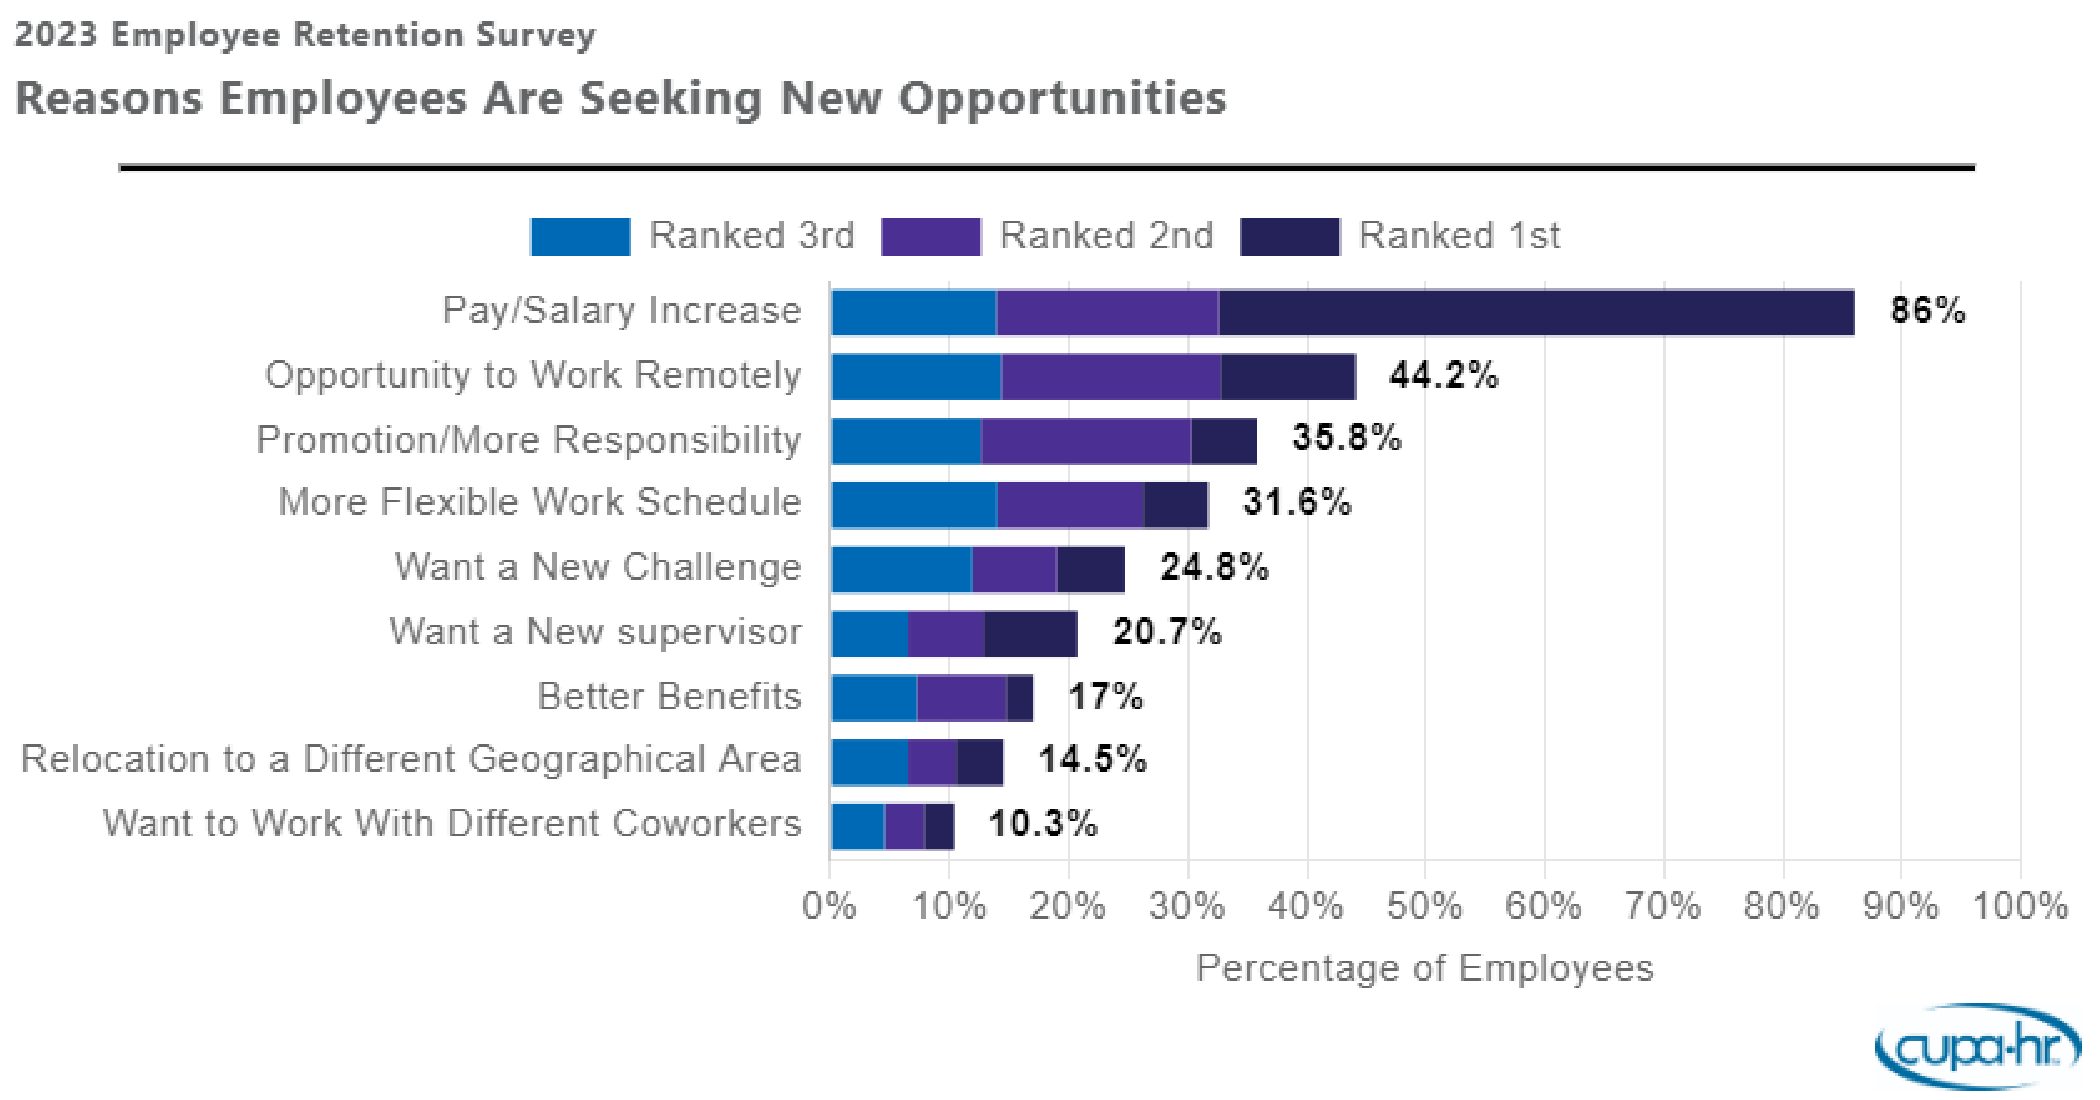 But while pay is the top concern mentioned by employees, retention challenges are more complex.


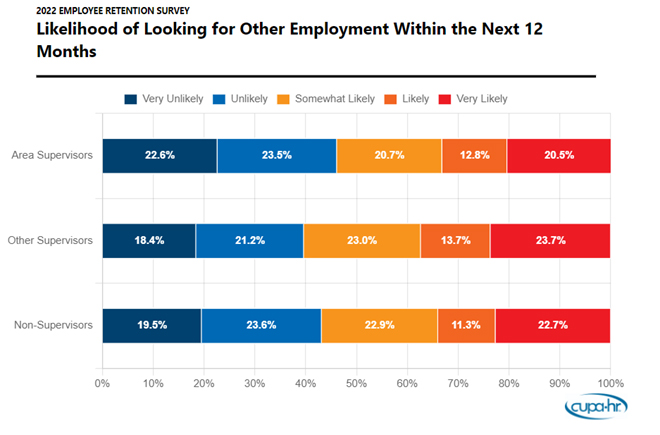 Most higher ed supervisors work long hours and have absorbed more duties since the onset of the COVID-19 pandemic. Data show that supervisors are more likely than non-supervisors to work additional hours. Fewer than half (47 percent) of non-supervisors work more hours than what is considered full-time. However, 89 percent of area supervisors and 76 percent of other supervisors work more hours per week than what is considered full-time at their institution. Additionally, supervisors are more likely than non-supervisors to agree that they have absorbed additional responsibilities of other staff who have left the institution since the onset of COVID-19. Supervisors are also more likely than non-supervisors to report that they experienced an increase in job expectations since the start of the pandemic.