Category: Featured

  • How to Enhance Local SEO for K-12 School Websites

    How to Enhance Local SEO for K-12 School Websites

    Reading Time: 8 minutes

    Search engine optimization (SEO) is essential for improving your school’s online visibility, ensuring that when local families search for educational options, your school is among the first they see. SEO helps your website rank higher in search engine results, making prospective parents more likely to find you before other schools in your area. SEO gives your school a competitive edge in reaching families who are actively seeking information on local educational options. 

    Knowing the value of SEO, most people ask how to do SEO for a school? To begin implementing SEO, schools can focus on three primary areas: On-page SEO, technical SEO, and Local SEO. In this blog, we’re focussing on local SEO.

    An optimized online presence is crucial for K-12 schools to attract and engage prospective families within their local communities. By focusing on Local SEO, schools can increase their visibility in search engine results, connect with families nearby, and build trust as a leading choice for local education. With our 15 years of experience driving results for schools like yours, we know the unique challenges K-12 schools face in reaching prospective parents and students. This guide will walk you through the essential strategies to enhance your school’s local SEO, even if you’re new to search engine optimization.

    Struggling with enrollment?

    Our expert digital marketing services can help you attract and enroll more students!


    Understanding Local SEO for K-12 School Websites and Why It Matters 

    Local SEO optimizes your school’s website and online presence to rank higher in local search results. This optimization specifically targets potential families searching for schools in your area, making it an essential component for K-12 schools looking to expand their visibility.

    When someone searches “best private school near me” or “elementary school in [City],” the results that appear are influenced by local SEO practices. Google and other search engines analyze local relevance factors such as your school’s address, the presence of local keywords, online reviews, and overall domain authority to decide which websites to show at the top. Mastering local SEO for K-12 school websites can make a difference in being found online by families in your community.

    Are you trying to implement effective digital advertising for parents of students? Reach out to learn more about our digital marketing services

    Claiming and Optimizing Your Google My Business Profile

    What is the most effective strategy for local SEO? One of the most powerful steps you can take when marketing to K-12 students’ families in your area is to claim and optimize your Google My Business (GMB) profile. This profile is essential for local SEO because it provides search engines and families with critical information about your school, such as its location, contact information, and operating hours.

    Begin by verifying your school’s GMB profile. When editing the profile, ensure all details are accurate, including the school’s name, address, phone number, website URL, and a brief description of the school’s values and offerings. Google also allows you to add photos, which can be a fantastic way to showcase your school’s facilities, activities, and unique educational experiences. Families browsing through profiles will be drawn to authentic visuals, which can help them feel connected to your school before they even step foot on campus.

    Adding relevant categories (e.g., “Elementary School” or “Private School”) and attributes to your GMB profile increases your chances of appearing in local searches specific to your school type. Regularly update your GMB profile with fresh photos, events, and posts, as Google favors active profiles, enhancing your school’s local SEO ranking.

    Example: This is how Google presents your institution to searchers when you create and optimize your Google My Business account. Your GMB profile provides critical information about your institution in an easy-to-consume layout.

    HEM 1HEM 1

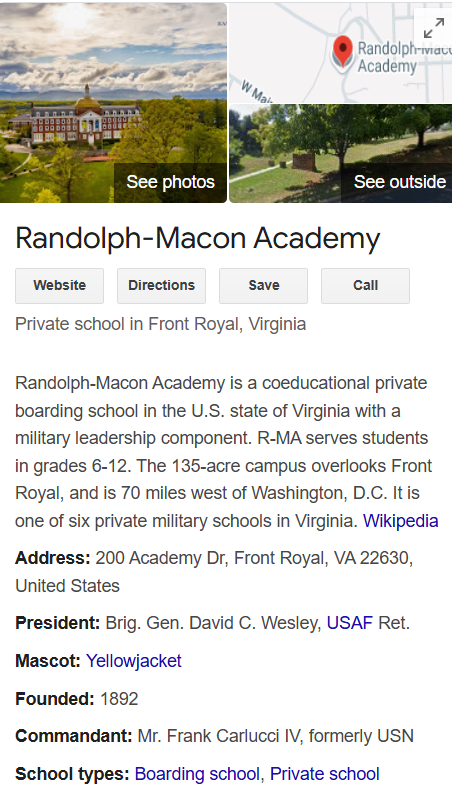
    Source: Randolph-Macon Academy | Google

    Optimizing Your Website for Location-Based Keywords

    Your website’s content should reflect keywords families might use when searching for schools in your area. Instead of generic phrases like “top K-12 school,” incorporate keywords that feature your location, such as “top K-12 school in [City]” or “private high school in [Suburb].” These location-based keywords help search engines understand that your school serves families in a specific area, increasing your chances of appearing in relevant searches.

    Consider adding a dedicated “Location” or “About Our Community” page that details your school’s surrounding area, landmarks, or neighborhoods. This page could highlight the community values and amenities available, reinforcing that your school is embedded within the local community. Mentioning nearby cities, neighborhoods, or districts can also strengthen your local SEO, especially for families who want their children to be educated within specific geographic boundaries.

    Each page of your website should also include the school’s full name, address, and phone number (often referred to as NAP – Name, Address, Phone Number) in a consistent format. Placing your NAP details in the footer ensures they appear across the entire site, building user trust and Google’s confidence in your school’s legitimacy and location.

    Example: WillowWood School’s metadata uses the title WillowWood School | K-12 Private School | Toronto. In your metadata, include your school’s city to rank for location-based searches.

    HEM 2HEM 2

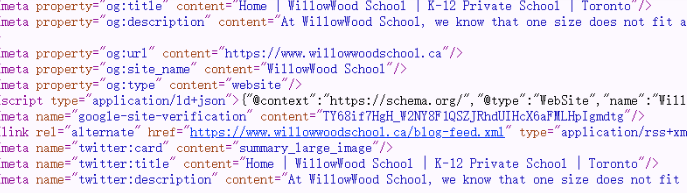
    Source: WillowWood School

    Creating High-Quality, Locally Relevant Content

    Content marketing is an excellent way to boost your school’s visibility in search results. Develop blog posts, articles, and resource pages that speak to local concerns, events, and topics families in your area care about. Writing blog posts on subjects like “Why Choose a Private School in [City]” or “The Benefits of Small Class Sizes in [Neighborhood] Schools” can help attract local searches and establish your school as a knowledgeable voice within the community.

    Another powerful content idea is to publish posts about school events, open houses, and seasonal programs like summer camps. These posts can generate interest from families looking for activities within your area, leading to higher engagement on social media platforms.

    Local content can also come as testimonials and success stories from parents and students within the community. Encourage current families to share their experiences and post their stories on your blog or testimonials page. Positive testimonials boost your school’s reputation, and add keywords and phrases that resonate with other families in your area.

    Example: Here, Nanjing International School shares culturally and geographically relevant content on its YouTube channel, helping it to attract prospects. When creating content, particularly visual, highlight your school’s location and discuss any advantages it offers students.

    HEM 3HEM 3

    Source: Nanjing International School | YouTube

    Encouraging Positive Online Reviews

    Online reviews play an important role in local SEO, particularly for schools. Families considering your school will likely check online reviews to gauge what other parents and students think of your programs, culture, and overall quality. Reviews posted on Google, Yelp, Facebook, and niche educational sites help build trust and credibility while boosting your local SEO ranking.

    One way to encourage reviews is by setting up an easy process for parents to leave feedback. After key events like open houses, school performances, or parent-teacher meetings, follow up with an email inviting parents to share their experience on Google or other review sites. Always respond to reviews in a timely, professional manner, whether positive or negative. This responsiveness shows that your school values feedback and is engaged with its community, which search engines recognize positively.

    Example: Western Heights Montessori School’s website displays several positive reviews. These personal and specific reviews highlight the school’s unique selling points. When encouraging parents to write reviews, try to prompt them toward a similar result.

    HEM 4HEM 4

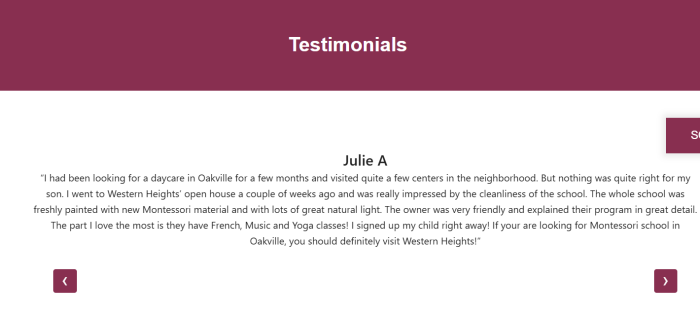
    Source: Western Heights Montessori

    Building Citations and Directory Listings

    Citations, or mentions of your school’s name, address, and phone number on other websites, are a key component of local SEO. Citations help search engines confirm your school’s existence and location, ultimately building your website’s authority. Common places for citations include online school directories, community websites, and local educational resources.

    Research reputable, relevant directories specific to education or your geographic area, and ensure your school’s information is listed accurately. Local chambers of commerce, community pages, and educational sites often provide directory listings or profiles where your school can be featured. Each additional citation strengthens your local SEO, contributing to a greater chance of appearing in local search results.

    Example: This is GLCT’s listing on the International School Database. By appearing on directories like this, you’re expanding your online presence, making it easier for prospects to find your school.

    HEM 5HEM 5

    Source: Great Lakes College of Toronto |  International School Database

    Building Local Backlinks

    Backlinks, or links from other websites to your school’s website, are essential for establishing credibility in SEO. Local backlinks are even more valuable, as they signal to Google that your school is an authority in the community. Consider contacting local organizations, libraries, businesses, or news outlets that could mention or link to your school.

    For example, if your school partners with local businesses for community events, ask them to link to your website in their event descriptions. Participating in community service projects or sponsoring local events can provide backlink opportunities. Press releases about notable achievements or events at your school, published on local news sites, can generate valuable backlinks.

    Implementing Schema Markup

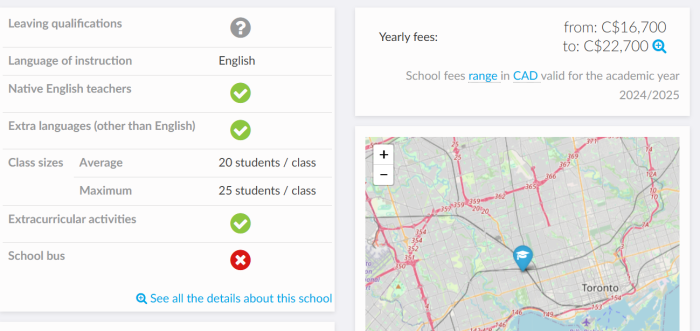
    Schema markup is a form of structured data that helps search engines understand specific information on your website. For K-12 schools, schema can highlight important details such as your school’s name, location, contact information, and even specific features like tuition or grade levels offered.

    Adding schema markup helps Google better understand the context of your website, often leading to enhanced search result displays with additional information like ratings, contact details, or event dates. Schools that use schema have a competitive advantage in local search results, as this markup can make your listing stand out.

    For example, implementing schema to highlight upcoming events, open house dates, or application deadlines allows families searching for local school options to identify important details quickly. Schema markup may require technical assistance, but it’s worth considering to boost your local SEO efforts further.

    Tracking and Adjusting Your Local SEO Strategy

    After implementing these local SEO practices, tracking your progress is essential. Use Google Analytics and Google Search Console to monitor key metrics such as organic search traffic, click-through rates, and the keywords driving traffic to your site. These insights can help you understand which strategies are working and where adjustments are needed.

    Regularly updating and refreshing your website’s content, profile listings, and SEO practices is vital to staying competitive. Local SEO is an ongoing process, and search engine algorithms frequently change, so periodically revisiting and refining your strategy can ensure your school continues to attract and engage the local community effectively.

    Implementing local SEO for your K-12 school’s website may initially seem complex, but by focusing on the essential practices we’ve discussed today, you’ll soon see its value. By investing in local SEO, you’re building a more robust digital foundation and positioning your school as a valuable resource in your community.

    Struggling with enrollment?

    Our expert digital marketing services can help you attract and enroll more students!

    FAQs

    How to do SEO for a school?

    To begin implementing SEO, schools can focus on three primary areas: On-page SEO, technical SEO, and Local SEO. In this blog, we’re focussing on local SEO.

    What is the most effective strategy for local SEO?

    One of the most powerful steps you can take when marketing to K-12 students’ families in your area is to claim and optimize your Google My Business (GMB) profile.

    Source link

  • The Meaning of 2025

    The Meaning of 2025

    So, was that a fun year, or what?

    From Marc “Tonya” Miller and the federal government knee-capping the postsecondary sector in January to Marc “Harding” Miller and the federal government coming back around in September to knee-cap the college sector specifically to Ontario college presidents calling each other whores and more…it was a year to remember. Heck of a ride.

    But as catastrophic as the current fall in revenue seems, it’s worth remembering a couple of things. First, we’re not alone in this. Australia, the UK, France, the Netherlands: they’re all going through something similar. So are some (primarily but not exclusively blue) US states. And second of all, Canada’s institutions are still on most measures better funded than those elsewhere in the OECD (although that advantage is getting narrower all the time). So there’s an argument to be made that there’s nothing special going on here, and in a way this is just reversion to the mean. Not a lot of comfort in that, obviously, but misery loves company, etc.

    There is, I think, a  world-wide phenomenon (though perhaps it does not capture the dynamics of low and middle income countries) which is: NOBODY WANTS TO PAY FOR IT. Higher education is expensive on a per-student basis and it now extends to a far higher percentage of the population than it has at any point in human history. The implicit assumption within higher education communities was that by broadening access to higher education, we would win more public approval for higher education finance. Instead, by making higher education the norm, we made the “gains” from higher education a lot harder for graduates to see since they weren’t as “exceptional” anymore. There’s a point where attempts to boost access to pos-secondary education ceases to feel like spreading opportunity and starts to feel like imposing chores. Beyond that point, public support for higher education falls.

    (More generally, the closer institutions come to being “universal,” the more they seem like utilities, and the fraction of the population that wants “world-class” utilities is vanishingly small. People just want utilities to work, quietly and properly, with no fuss—which is probably why evident dysfunction like months-long campus disruptions from encampments are so deeply unpopular.)

    In other words, we’ve spent 80 years building a system of higher education that is simply more expensive to run than the public is willing to support. Some countries have tried to get around this by financializing things a bit, imposing tuition fees but putting off the bill via student loans, and that helps somewhat as long as governments don’t use that as an excuse for continuing to reduce public funding (which, barring the UK, they mostly haven’t). Some, like Canada and Australia, have tried the neat trick of getting foreigners to pay for their higher education systems via international student tuition fees, but over-reliance on this tactic tends to run up against externalities in the housing market.

    Which means we finally have to confront the problem of nobody wanting to pay for the system we have created.

    There will be huge economic and geo-political ramifications to not paying for the system. Canadian universities depend on having fat margins in undergraduate and professional master’s degree to subsidize research. To a lesser but not insignificant extent, colleges depend on having fat margins in non-tech programs in order to cross-subsidize expensive programs in the trades programs. We don’t talk about these cross-subsidies much (in fact most institutions try to hide them as much as possible, which is a big reason that politicians and even public servants don’t really understand why universities and colleges behave the way they do), but they are fundamental to the way we organize institutions.

    Think about the consequences of reducing those cross-subsidies within universities at the exact moment when advances in technology are opening up huge potential advances in energy, materials science, and health. We (and the Brits, and the Aussies, and the Dutch) are simply going to cede advances in these areas to other countries who are not cutting back on science. China, probably. India and Turkey, maybe. And think about cutting the cross-subsidies in colleges at the exact moment when we need more and better-trained skilled tradespeople in order accelerate the construction of housing and other critical infrastructure.

    (Remember in 2016, when we could console ourselves that however big a disaster Trump was, at least Canada could profit by offering an attractive landing spot for international science and tech talent? Well, we aren’t saying that in 2024. We could be hiring up a storm of top talent, but the money isn’t there to do it, and the housing market is such a disaster we’re afraid to invite people in. Both levels of government have much to answer for.)

    Anyways, it’s easy to bitch about funding but as you’ve heard me say before, no one is coming to save us. There’s zero evidence that anyone in government is suddenly going to decide that Eating the Future is wrong, so the sector is going to have to work out solutions on its own. Non-enshittified solutions, that is. Maybe, just maybe, it’s time to re-think the whole model to make it less costly and more efficient. And that doesn’t just mean asking questions about whether we need this new building, or that academic program or this new executive position, or quite so many student services devolved to the faculty level (all of which are important!) but also some more fundamental questions, like:

    Is it integral to our model that undergraduate degrees be four years in length? (There are parts of Canada, like Manitoba, where it is not.)

    Are research and teaching really the complementary goods many claim they are, or would more specialization of effort be of benefit? (Equally: why should teaching cross-subsidize research, as it so plainly does in a variety of ways?)

    Do degrees need to be awarded along disciplinary lines (which have inconsistent relations to occupations and careers) or are there other ways to do it?

    What if, instead of giving research money to (mainly) universities and asking them to get matching funds from industry, we gave vouchers to industry to work with universities/colleges that they could either use or lose?

    What if colleges got out of skilled trades training altogether and handed it over to industry?

    Few people are going to like all the answers (or even the questions) here, but nevertheless these are the kinds of questions the post-secondary system should be asking not just itself but the rest of society as well.

    But that’s all for next year. In the meantime, happy and restful holidays to all. There will be a podcast tomorrow and our AI Newsletter on Friday, but this will be the final blog of 2024. Regular service will resume January 6. Be well

    The post The Meaning of 2025 appeared first on HESA.

    Source link

  • HEDx Podcast: Barriers to students accessing ed-tech – Episode 149

    HEDx Podcast: Barriers to students accessing ed-tech – Episode 149

    Chief strategy officer of global digital content provider VitalSource Jared Pearlman joins Martin Betts on HEDx this week to discuss the need for HE to deliver affordable student experiences and business models for technology providers that make these experiences sustainable.

    He provides a great summary of current global barriers to providing equitable, ed-tech enabled access to learning.

    Do you have an idea for a story?
    Email rebecca.cox@news.com.au

    Source link

  • Melbourne uni owes staff $72m in unpaid wages, UniSQ confirms 150 staff laid off

    Melbourne uni owes staff $72m in unpaid wages, UniSQ confirms 150 staff laid off

    University of Melbourne interim vice-chancellor Nicola Phillips said the university will continue its leadership role in employment compliance. Picture: NCA NewsWire/Martin Ollman

    The University of Melbourne will fork out a total of $72m to cover the underpayments of 25,000 staff, after investigations into wage theft claims found the institution had failed to properly pay employees over a 10-year period.

    Please login below to view content or subscribe now.

    Membership Login

    Source link

  • New University of Wollongong vice-chancellor announced

    New University of Wollongong vice-chancellor announced

    Professor Lu when he won a Queensland Great award in 2013. Picture: Mark Calleja

    Professor Max Lu will move to Australia to be the University of Wollongong’s (UOW) sixth vice-chancellor in May next year.

    Please login below to view content or subscribe now.

    Membership Login

    Source link

  • President-Elect Trump Nominates Lori Chavez-DeRemer for DOL Secretary and Linda McMahon for Education Secretary

    President-Elect Trump Nominates Lori Chavez-DeRemer for DOL Secretary and Linda McMahon for Education Secretary

    by CUPA-HR | December 10, 2024

    Over the past few weeks, President-elect Donald Trump has announced several nominations for leads at federal agencies. Of relevance to CUPA-HR members, Trump has nominated Rep. Lori Chavez-DeRemer (R-OR) to serve as secretary at the Department of Labor (DOL) and Linda McMahon to serve as the Department of Education (ED) secretary. The following analysis dives into how Chavez-DeRemer and McMahon may lead each agency’s regulatory action on a few of the most pressing policy issues.

    DOL Secretary

    FLSA

    Chavez-DeRemer was nominated to serve as labor secretary on November 22. Chavez-DeRemer was viewed as a surprising pick for many in the labor and employment policy space given her Congressional record and support from labor unions. Her nomination raises questions about the direction in which DOL will go under the Trump administration with respect to certain policies and regulations, such as the overtime regulations under the Fair Labor Standards Act (FLSA), joint employer regulations, and independent contractor regulations.

    As a reminder, the Biden administration’s overtime regulations were struck down in federal court on November 15. The ruling strikes down all components of the Biden administration’s rule, including the July 2024 and January 2025 salary thresholds and the triennial automatic updates. On November 26, however, the Biden administration filed a notice of appeal to the 5th U.S. Circuit Court of Appeals in hopes of reinstating the rule before their term ends.

    Chavez-DeRemer has not publicly supported or opposed the Biden administration’s overtime rule, but labor unions have supported the rule through regulatory comments and public statements. Many anticipated that a second Trump administration’s DOL would stop defending the Biden rule in court if the Biden administration chose to appeal. Given organized labor’s support of Chavez-DeRemer, there is a chance that DOL under her authority would continue to defend the rule in court. However, it appears unlikely that the rule in its entirety would be defended, and it is more likely that DOL would attempt to defend the July salary threshold only. As a reminder, the salary threshold increase that took effect on July 1, 2024, used the Trump administration’s 2019 overtime rule methodology to determine the level, which could lead to a possible reasoning for defending the July salary threshold level.

    Joint Employer and Independent Contractor Rules

    Similar to the overtime regulations, the future of other labor and employment regulations relevant to higher ed HR appears uncertain in the face of Chavez-DeRemer’s nomination. Two DOL regulations — the joint employer and independent contractor rules — seem certain to swing back in favor of policies like those implemented under the first Trump administration, but Chavez-DeRemer’s inconsistent record in Congress on both issues makes it unclear how DOL under Trump will regulate them.

    Notably, Chavez-DeRemer is one of three Republican cosponsors of the Protecting the Right to Organize Act, a Democrat-backed bill that would expand organized labor’s power over workers and employers. There are provisions in the PRO Act that a second Trump DOL is not anticipated to implement, including provisions to apply a controversial “ABC” test for worker classification under the National Labor Relations Act and to adopt a broader joint employer standard under the NLRA than the standard implemented by the Trump administration. Given her support for the PRO Act, Chavez-DeRemer could change direction from the anticipated actions expected from the Trump administration with respect to joint employment and independent contractor status, along with other labor policies.

    Education Secretary

    Linda McMahon was nominated to serve as ED secretary on November 19. McMahon’s nomination was also considered a surprise, but for reasons surrounding her previous experience. During Trump’s first term, McMahon served as the administrator of the U.S. Small Business Administration, and most recently, she served as co-chair of Trump’s transition team. She was previously an executive for World Wrestling Entertainment (WWE). With respect to education, McMahon served as a trustee for Sacred Heart University for over a decade, and she also briefly served on the Connecticut Board of Education.

    Title IX

    McMahon’s previous positions and experience do not provide much insight into her stance on higher education policy. That being said, we expect that McMahon will largely follow the education policy direction of President-elect Trump if she is confirmed. With respect to Title IX, it is expected that Trump will seek to reimplement his administration’s 2020 Title IX regulations nationwide, which we anticipate McMahon will follow. It remains to be seen if McMahon and the Trump administration’s ED will attempt to issue new Title IX regulations that may be more conservative than those issued in 2020 to address concerns regarding rights and protections for transgender students.

    Looking Ahead

    Both Chavez-DeRemer and McMahon will face Senate confirmation hearings by relevant oversight committees and votes by the full Senate. During confirmation hearings, more information about the nominees’ priorities at their respective agencies will be revealed. CUPA-HR will keep members apprised of any updates related to the confirmation process of Chavez-DeRemer and McMahon as well as regulatory updates from DOL and ED.


    Source link

  • HR and the Courts — December 2024

    HR and the Courts — December 2024

    by CUPA-HR | December 10, 2024

    Each month, CUPA-HR General Counsel Ira Shepard provides an overview of several labor and employment law cases and regulatory actions with implications for the higher ed workplace. Here’s the latest from Ira.

    Terminated Professor May Pursue Title IX, Anti-Male Bias Claim as John Doe

    A former Boston University professor may anonymously pursue his Title IX claim that the university’s sexual harassment investigation leading to his termination was itself biased against males. The court noted that the use of pseudonyms is strongly disfavored in civil litigation. The judge nonetheless allowed it in this case for the following reasons: the plaintiff’s strong and realistic fear of reputational damage, the chilling effect that name disclosure could have on future litigants, the public interest in disclosing Doe’s identity does not appear significant, and the use of a pseudonym will not prejudice the university’s defense. The case will move forward without disclosure of the professor’s name (Doe v. Trustees of Boston University (2024 Bl 399572 D. Mass. No. 1:24-cv-10619, 11/6/24)).

    Division I Tennis Player Narrows Lawsuit Against NCAA Following Dismissal of Initial Complaint

    A Division I tennis player at the University of North Carolina at Chapel Hill has narrowed her class action complaint against the NCAA a month after her request for an injunction was denied. The federal judge did not view her claim as being ultimately successful because of its breadth. The plaintiff made it to the third round of the U.S. Open tennis tournament in 2021 and was entitled to $48,913 in prize money. NCAA rules allowed her to accept only $10,000 in prize money from all competitions that year. Accepting more would have jeopardized her ability to play on the women’s tennis team at UNC. She was also forced to forfeit other prize money she won in 2021.

    Her initial complaint sought to represent a class of all Division I student-athletes in all individual sports, including swimming and golf. Her amended complaint limits the class to Division I tennis players (Brantmeier v. NCAA (M.D. N.C. No. 1:24-cv-00238, 11/8/24)).

    Federal Court Dismisses Professor’s Claim That DEI Statement on University Application Screening Process Would Render His Application Futile

    A plaintiff’s claims that a university’s required DEI statement on its initial applicant screening process made his application futile or put him a disadvantage to other parties have been dismissed. A California federal trial court dismissed the claims for lack of standing, as the plaintiff professor never actually applied for the position in question. The court concluded that the professor, who had amended his complaint three times, did not include an actual allegation that he applied for the position.

    In dismissing the case against the University of California, Santa Cruz, the court concluded that the professor’s “futility” claim failed because he may well have passed the initial screening stage notwithstanding the DEI statement (Haltigan v. Drake (N.D. Cal. No. 5:23-cv-02437, 11/15/24)).

    House Committee on Education and the Workforce Investigating “Information Sharing Agreement” Between DOL and a Plaintiff’s Law Firm

    Republicans on the House Committee on Education and the Workforce have called upon the Department of Labor’s inspector general to investigate the DOL’s Employee Benefits Security Administration (EBSA) after it shared confidential material with a law firm suing a company that had been the target of a prior agency audit. The material was provided to the plaintiff’s law firm Cohen Milstein Sellars & Toll PLLC under a DOL “information sharing agreement” between the department’s division and the law firm.

    Common interest agreements are standard in litigation when two parties in active litigation share plaintiff or defense interest on the same side of the litigation. In this case, however, the DOL was not a party to the litigation nor had it filed a lawsuit against the defendant involved in this private litigation. The request to the DOL’s inspector general also asks how many other common interest agreements the EBSA has with other plaintiff law firms.

    Coach Denied Injunction Reinstating Him Following Alleged Use of Slur Involving Transgender Athletes

    A high school coach who filed a First Amendment lawsuit against his school district is denied a court-ordered injunction reinstating him while he litigates the propriety of his alleged statements. The coach claims his First Amendment rights were violated when he was terminated following his email critical of the school district’s position on transgender athletes. The school district defended, stating that he would have been terminated regardless of the email because another coach reported that he used a slur in referring to transgender athletes.

    In denying the coach’s request for an injunction, the court concluded that the plaintiff did not show irreparable harm that could not be compensated by monetary damages. The court ruled that the school district’s responsibility to ensure that all students feel safe and are not harassed outweighs the coach’s personal interests in this matter (Parks v. Lake Oswego School District (D. Or., No.3:24-cv-0119, 11/25/24)).


    Source link

  • Slowing Growth and Uncertainty: A Look at IIE’s Open Doors Report 2024 and What the Future Might Hold

    Slowing Growth and Uncertainty: A Look at IIE’s Open Doors Report 2024 and What the Future Might Hold

    Bryce Loo, Associate Director of Higher Education Research

    International students navigate a landscape of uncertainty and opportunity, as the 2024 IIE Open Doors Report highlights shifting trends in U.S. enrollment and global migration.

    The Institute of International Education’s (IIE) annual Open Doors Report on International Education Exchange (Open Doors, for short),[1] along with its companion Fall Enrollment Snapshot Survey (Fall Snapshot Survey, for short),[2] was released only a few weeks after a consequential presidential election in which former president Donald Trump defeated Vice President Kamala Harris. Trump’s win will significantly shift the landscape around international students in the U.S.

    Open Doors is a retrospective report on international enrollment and other student data in the U.S., focused on the previous full academic year—in this case 2023-24.[3] The Fall Snapshot Survey provides insights into the current fall term. But uncertainty abounds in this new environment with the return of Trump, known for his tough stances on immigration, which may affect non-immigrant residents such as international students and temporary workers. This is happening against a backdrop of global uncertainty, in a year with a tremendous number of important elections around the world, many armed conflicts, and growing climate change. At the same time, there are bright spots for the U.S. as a host of international students and for global student migration in general.

    In this article, I also compare results from Open Doors and the Fall Snapshot Survey against recently released data from SEVIS (the Student Exchange and Visitor Information System), maintained by the Department of Homeland Security (DHS), for Fall 2024.[4] This dataset captures all students with a record in SEVIS, the U.S. government database in which all international students are required to be registered by their hosting U.S. institution. Data are organized monthly, with the most recently released is for November 2024, and they vary little month-to-month within a given term, such as a fall semester. For consistency, I compare November 2024 with November 2023. Such data help us to gain a fuller picture of current international enrollment trends this fall.

    What the data tell us: Continued but leveling growth

    Total international student enrollment in the U.S. hit an all-time high of 1,126,690 in 2023–24, a growth rate of 6.6 percent from the previous year. This has followed a few years of recovery following the dramatic enrollment decrease during the COVID-19 pandemic. The post-pandemic growth rate peaked in 2022-23 at 11.5 percent.

    However, growth is slowing. While this year’s Fall Snapshot Survey indicates a 3 percent growth rate in fall 2024, analysis of the SEVIS data indicates a drop in overall enrollment. International enrollment is down to 1,091,190 students in November 2024, a 10 percent decrease from the previous November, according to SEVIS records.[5] IIE’s data confirms slowing growth, too. New international student enrollment slowed to only 0.1 percent in 2023-24. Additionally, the Fall Snapshot Survey indicates a 5 percent decrease in new students this fall.

    This recent slowdown, which happened prior to the presidential election results, is tricky to diagnose. One likely culprit, though certainly not the only one, is economics: An education in the U.S. has become particularly expensive, due largely to a combination of inflation and a strong U.S. dollar. A more expensive U.S. education particularly impacts many students from South Asia and sub-Saharan Africa, the two regions showing the strongest rise in U.S. international enrollment in recent years, who are particularly price sensitive.

    Changing trends in South Asia and East Asia

    International enrollments in the U.S. from South Asia, driven dominantly by India, continued growing at a rapid rate in 2023–24. In 2023–24, India became the top country of origin among international students in the U.S. and by a substantial margin, at 331, 602 students. There was about a 23 percent increase in Indian students from the previous year, accounting for almost 30 percent of all international students in the U.S.

    In 2023-24, South Asia firmly dominated among regions of origin for U.S. international students and its numbers continue to rise. South and Central Asia (which IIE groups together as one[6]) account for one-third (34.3 percent) of all U.S. international students, just ahead of East Asia. South and Central Asia’s sending numbers grew 22 percent over the last year, more than those of any other region. Beyond India, there continues to be robust enrollment growth from Bangladesh (26 percent), Nepal (11 percent), Sri Lanka (10 percent), and Pakistan (8 percent). Bangladesh and Nepal broke into the top 10 countries of origin in 2023-24.

    By contrast, the number of Chinese students in the U.S. declined more than 4 percent to 277,398 during the same period and accounted for less than 25 percent of all U.S. international students. Overall, numbers from East Asia are declining steadily (by nearly 4 percent last academic year). Numbers from South Korea (-2 percent) and Japan (-13 percent) continued to drop. The one bright spot among major East Asian nations was Taiwan, which saw a 6 percent rise from the previous year and was the fifth largest sending country. Students from East Asia have been decreasing in the last few years, and forecasts suggest further steady decline.

    For many East Asian students, the calculus about studying in the U.S. and in Western countries has changed in recent years. Holding a degree from a highly ranked U.S. or Western institution holds less cachet than it once did. In both China and South Korea, local universities have become more prestigious and offer students the opportunity to connect directly with the local job market, putting those studying far afield at a disadvantage. For Chinese students, geopolitical tensions and strict policies against Chinese students and scholars largely enacted by the first Trump Administration, many of which were continued by the Biden Administration, may make studying in the U.S. feel riskier. There has also been growing intra-regional mobility, with many East Asian students choosing to go to another country in the region. According to the British Council, for example, there are more Japanese students in China than in any anglophone country.

    Despite the recent increases in enrollment from South Asia, the SEVIS data show a rapid reversal of trends heading in Fall 2024. Indian enrollment in the U.S. this fall has declined by 24 percent, and overall South Asian enrollment has fallen at a similar rate. Meanwhile, Chinese and overall East Asian enrollment has flatlined, each with a barely perceptible decrease. As a result, however, China has become the top country of origin once again, with 263,523 students in the U.S., followed by India (25,5443), in Fall 2024. Likewise, East Asia has returned to the top spot among region of origin, with modest enrollment increases from Japan and South Korea.

    A slowdown of enrollment growth from South Asia likely is attributable to rising costs in the U.S., particularly given currency exchange rates, as noted earlier. Safety, a frequent concern for Indian students and their families, could also be a factor. Many Indian media outlets, such as The Economic Times and The Indian Express, have recently reported on increasing safety issues for Indian students in the U.S.

    That said, these declines from India and South Asia do not necessarily foretell a long-term trend. Many prominent models, notably that of HolonIQ, predict growth from India into 2030.

    Graduate students continue to dominate. For now.

    International student growth in the U.S. continues to be driven at the graduate level, particularly among master’s degree students. Graduate students made up almost 45 percent of all U.S. international enrollment in 2023-24. Total international student graduate enrollment increased by 7.6 percent in 2023-24, while undergraduate enrollment fell by 1.4 percent and non-degree enrollment fell by 11.5 percent. These trends are somewhat parallel with new international student enrollment. India has driven much of this growth in grad students, as have South and Central Asian students in general. More Chinese students came to study at the graduate level that year, too.

    This growth of international graduate students does not appear to be holding into 2024-25, however. The Fall Snapshot Survey indicates a slight decrease of about 2 percent in international grad students this fall and an increase (6 percent) in international undergrad students. The SEVIS numbers show decreases for both, including a significant decrease of 15 percent among international grad students. (International undergrad enrollment declined by 3 percent.) However, international graduate enrollment is still greater than undergraduate enrollment currently.

    The decrease in international graduate students appears to be driven by Indian students and South Asian students overall. Indian students account for about 40 percent of all U.S. international student graduate students, and 60 percent of Indian students in the U.S. are studying at the graduate level, according to Open Doors. Per the SEVIS data, Indian graduate enrollment in the U.S. declined by almost 26 percent in Fall 2024. Additionally, South and Central Asian and East Asian student together account for nearly three-quarters of all international graduate students. Chinese graduate enrollment in the U.S. decreased about 4 percent this fall, according to the data from SEVIS.

    U.S. universities and colleges continue to focus heavily on India and to a lesser extent China for their international student recruitment, according to the Fall Snapshot Survey. India is the top country of focus for both graduate students (81 percent of respondents) and undergrads (65 percent). China was second top country of focus for grad students and third for undergrads (just after Vietnam). Given the volatility of enrollment from India and steady declines from China, U.S. institutions may wish to ensure diversity of countries from which they recruit.

    What could impact international enrollment in the near future?

    The Trump Administration

    When it comes to potential impacts on international student enrollment in the U.S., a primary factor will be the incoming Trump administration. Donald Trump will take office with a decisive agenda, having campaigned and won with a tough-on-immigration stance. This stance seemed to resonate with many voters, along with concerns about the economy and inflation.

    The first Trump administration may provide a useful look at what could happen in the second one. Trump’s first term brought a decline in international student enrollment, due in part to policies like the 2017 travel ban and a slowdown in visa processing. This trend reversed somewhat during the Biden administration but could resume under the policies of a second Trump term.

    Going forward, much will depend on the incoming administration’s policies as well as rhetoric. Trump’s immigration agenda is mostly focused on asylum, primarily at the U.S.-Mexico border, and on undocumented immigrants, whom he has pledged to deport at unprecedented rates. The extent that he will focus on international students and immigrants with specialty occupations, notably the H1-B visa program under which some international students seek to remain in the U.S., is unclear. In June 2024, Trump, known for making offhand comments, proposed on a podcast hosted by Silicon Valley investors that international students who graduate from U.S. institutions, including community colleges, should receive a green card (permanent residency). He and his team later walked back that remark, and many commentators see such policy as highly unlikely given Trump’s overall immigration stance. In fact, reports suggest the administration is likely to limit pathways to H1-B visas, international students’ primary means of staying in the U.S. beyond Optional Practical Training (OPT), effectively making such visas virtually inaccessible.

    Policy changes under Trump’s second administration could also affect OPT and “duration of status,” the length of time students with visas have been allowed to stay in the U.S. without needing to renew. Such changes were attempted in the first Trump administration but did not succeed. His first administration also tried to eliminate STEM OPT, the 24-month extension of OPT for those graduating with a degree in fields related to science, technology, engineering, or mathematics. Indian students in particular may be concerned about such changes if they are proposed again, as they are often drawn to the U.S. by opportunities to gain work experience. Toward the end of that term the administration also put forward a rule to limit duration of status to a finite period of two or four years, rather than allow the time needed to finish earning a degree, after which a student would be required to pay a fee and renew.

    Still, it is possible to overestimate the attitudinal impact of a presidential administration, and recent survey research by Intead and Studyportals found a majority of prospective international students this fall were “indifferent” to the election outcome and how it might affect their plans to study in the U.S., according to The PIE News. There is certainly no monolithic view of President-elect Trump or U.S. politics among international students. If any declines in numbers happen again under Trump, it will likely be in response to policies that specifically impact international students or rhetoric aimed at individuals from their home country or region of origin. It may also be driven in part by visa delays and denials caused by administration policies.

    Policies and politics in other major host countries

    One other major factor is current policy changes in other major host countries, driven largely by politics and public opinion, which might actually boost the attractiveness of the U.S. The other three Big Four predominantly anglophone destinations—Australia, Canada, and the United Kingdom—have had massive international student enrollment in recent years, particularly as a percentage of total higher education enrollment. According to IIE’s Project Atlas, Canada’s international enrollment rate in 2023 was 30 percent, Australia’s was 24 percent, and the U.K.’s was 22 percent. (By contrast, only 6 percent of U.S. higher education students were international, although overall size of its system makes the U.S. numerically the top enroller of international students.) Canada’s enrollment in particular has seen explosive growth, a rise of nearly 70 percent from 2019 to 2023. Many Canadian locales have struggled to accommodate such an influx, often viewed as a way to fill provincial funding gaps yet sometimes lacking steps to ensure students’ well-being.

    Additionally, international students have been ensnared in broader immigration debates within these three countries, often being unfairly blamed for systemic housing and employment challenges, among other issues. As in the U.S., immigration has been a major political topic in many Western countries and in recent elections in France and the U.K.

    As a result, the other three Big Four countries have begun implementing policies designed to rein in international enrollment growth and limit access to opportunities to work and stay after graduation. Canada, which according to IIE’s recent Open Doors briefing just overtook the U.K. to become the second most popular international student destination, adopted new policies in rapid-fire succession from late 2023 to fall 2024. The most consequential is a cap on the number of study permits (required in Canada for international students) granted per province, particularly meant to limit growth in higher-enrollment provinces, in 2024 and 2025. Other new policies include a significant hike in the financial resources international students are required to demonstrate, restrictions on work permits for spouses, limits on permission to work during study, and stricter requirements for obtaining the popular post-graduation work permit (PGWP), which allows graduated students to work in Canada and often transition to permanent residency.

    The Australian government is strongly considering similar caps on international student enrollment in an attempt to reduce overall migration to the country. Already it has stricter visa regulations for international students, including stronger “tests” to ensure that prospective students are coming with the intention of studying, not working, as well as a significant increase in the visa fee. In the U.K. a new regulation enacted by the Conservative Party prohibits international students at all levels except postgraduate from bringing family members starting in 2024, in order to “slash migration and curb abuse of the immigration system,” according to the U.K, government. The new Labour government has opted not to reverse the policy.

    The effects of these changes are already evident. The three other Big Four countries are all seeing declining applications for relevant visas and permits. Preliminary analysis of Canadian study permit application data shows the number of approved study permits will likely come in below the actual caps for 2024. The U.K. reported a 16 percent drop in student visa applications in summer 2024 compared to the same time period in 2023, and in Australia, the decrease in such applications has been particularly steep, nearly 40 percent from October 2023 to August 2024.

    So far, the prospective beneficiary of these changes has been the U.S., according to both prospective student surveys and media reports. For example, in IDP Education’s Emerging Futures Report for 2024, a prominent series based on prospective student survey data, the U.S. came in second place (at 23 percent) as destination of choice for survey takers, just behind Australia (24 percent). Interest in the U.S. increased four percentage points; Australia’s percentage point declined by one. By contrast, interest in the U.K. and Canada decreased 1 percent and 9 percent respectively, dropping them to third and fourth places. In media coverage of the restrictions, Indian outlets such as Business Standard and The Indian Express note that many Indian students are switching focus to the U.S, although some, including the Express, also report students are looking beyond the Big Four to other study destinations entirely.

    Still, President-elect Trump may introduce cuts or caps of his own, which, depending on their scope, may cause the U.S. to lose its developing enrollment edge. If all Big Four destinations have policies significantly cutting student influx, that could alter the student mobility landscape, shifting enrollments to other countries—notably, smaller anglophone destinations such as Ireland, New Zealand, and Singapore and non-predominantly anglophone countries in continental Europe and Asia—where English-taught programs have increased greatly in recent years.

    Student mobility in an uncertain world

    The incoming Trump administration and policy changes in other countries are only two factors apt to impact movement to the U.S.; internal issues in other countries and regions also come into play. For example, while U.S. policies and tensions with China have affected the number of Chinese students coming to the U.S., factors within China also played a role, as we examined in a recent series in WENR.

    Worldwide, uncertainty and systemic challenges lie ahead. Several major conflicts, notably Russia’s war in Ukraine and escalated fighting in the Middle East, threaten to spiral into bigger geopolitical crises. Authoritarianism is rising around the globe, creating more potential crises, as is the threat of climate change, with 2024 recently declared the hottest year on record. Among its many effects, climate change will likely continue spurring global migration, including, increasingly, the forcibly displaced. In fact, all these factors will likely increase global migration. Luckily, U.S. institutions are well-placed to take in students from affected regions and offer them pathways for academic and professional growth.

    In general terms, there is reason for optimism. Global student migration will continue and most likely rise, increasing economic and social opportunities for many globally mobile young people. International students also benefit their host societies, communities, and institutions, including domestic students, by bringing diverse international perspectives as well as economic benefits. By some estimates, international students will increase worldwide from about 6 million in 2023 to 10 million in 2030. The U.S. could host as many as 2 million, a still significant capacity compared to other destinations.

    Despite domestic and international pressures, U.S. institutions can continue to demonstrate the value of a U.S. education and what unique value they in particular offer. They can continue to make clear, through channels like the #youarewelcomehere campaign, that international students are both accepted and embraced. Institutions can continue to show that international education benefits not only students and institutions but communities and the nation. For example, huge numbers of U.S.-based entrepreneurs and  STEM professionals came to the U.S. as international students and have been an asset for U.S. business and research and development. And international educators can advocate for policies at local, state, and federal levels (for example, via NAFSA: Association of International Educators) that continue to make the U.S. a hospitable place for students from abroad.

    Most important, U.S. institutions can and should take proactive steps to ensure inclusion and integration of their international students. This means initial support in everything from securing good housing to culturally sensitive mental health resources to campus career services that recognize international students’ unique needs. It may mean assisting students with financing in any way possible. It also means more efforts toward academic and social integration, which involves educating faculty, staff, and domestic students as well.

    Looking to the future, U.S. policymakers, educators, and institutions must work together to create an environment that remains welcoming, inclusive, and responsive to the needs of international students. By doing so, the U.S. can maintain its position as a global leader in higher education and continue to benefit from the diverse perspectives and talents that international students bring.


    [1] Open Doors is an annual census of international students (those on a nonimmigrant student visa) enrollment in U.S. higher education institutions, as well as U.S. students who studied abroad two academic years prior.

    [2] The Fall Snapshot Survey is sent to all institutions that report data to IIE for Open Doors. This year, IIE collected 693 valid responses.

    [3] Open Doors always tracks data from the previous full academic year.

    [4] The SEVIS data released by DHS is usually the most up-to-date data available. Open Doors, however, provides more analysis and a greater breakdown of data compared with what is provided by SEVIS.

    [5] Usually, IIE’s Fall Snapshot Survey aligns with current data trends from SEVIS and is a strong predictor of numbers that appear in the following year’s Open Doors Report. This year, however, the data between the Fall Snapshot Survey and SEVIS are quite different, though both indicate slowing growth in international enrollment in the U.S.

    [6] Central Asia, which includes mostly former Soviet republics in Asia (such as Kazakhstan and Uzbekistan), only accounts for about 1 percent of total enrollment from the overall South and Central Asia region, according to my analysis of IIE Open Doors data.

    Source link

  • Graduate Student Insights and Perspectives

    Graduate Student Insights and Perspectives

    Report Title: Building a Better Pipeline: Enrollment Funnel Needs and Perspectives from Potential Post Baccalaureate Students

    Author: Collegis Education + UPCEA

    Published: December 2024

    Key points addressed

    In this ebook, you’ll learn more about prospective graduate students’ needs and expectations as they move through the enrollment funnel, including:

    • The level of degree desired, as well as the preferred learning format
    • Factors that cause disengagement during the inquiry and application processes
    • Prospective students’ communication preferences and application expectations
    • How institutions can tailor recruitment strategies accordingly

    Overview

    While higher education institutions face tightening budgets, demographic cliffs, and other market headwinds, many schools see graduate enrollment growth as a critical strategy despite the increasingly competitive landscape. Strategic investments in outreach have never been more vital.

    With more and more programs sharing similarities in their structure than differences, one way schools can win is by delivering frictionless and exceptional student experiences, using prospective graduate students’ preferences, behaviors, and other insights to personalize engagements and outreach.

    By understanding these preferences, institutions can better tailor their recruitment strategies and allocate resources more effectively in an increasingly competitive landscape.

    Source link

  • Fall and Rise | HESA

    Fall and Rise | HESA

    Fall and Rise

    The question I am getting more often than any other these days is: “what are you hearing about cuts at colleges and universities?” And my answer for the most part has been: “damned if I know.”

    The reason for my confusion is that publicly available details are few and far between. The HESA Towers team has been scouring the public record for details on institutional budget announcements; by our count, only 34 universities or colleges have so far announced anything concrete about their 25-26 budget plans and/or any planned cuts as a result of changing international student numbers. It’s possible more have been announced internally but just not caught the notice of the local press; we’ll be doing a lot more digging over the next couple of weeks. My guess is that many institutions are trying to avoid bad headlines by simply not going public about any plans to cut…but of course in the process, they are making it harder to convey to the public the magnitude of the downsizing being forced on the sector.

    (This is a really interesting version of the Tragedy of the Commons!).

    Some additional problems with the data: such information as one can glean from public sources is often skimpy and inconsistent: sometimes you get a figure for “loss of anticipated revenue,” sometimes you get a “projected deficit” (which sometimes is for 24-25, and other times for 25-26, and whether the figure is for operating budget or total budget take a bit of digging). Sometimes the numbers of programs being cut are announced but the identity of the programs is secret. Often you see that there will be budget cuts of $X million but there is no clarity about where those cuts will come from or the timeframe for the return to budget balance. In terms of job “cuts” as near as we can tell only five institutions have announced specific numbers for layoffs which have actually so far occurred, for a total of 214 lost jobs. You may have seen higher estimates from other sources, but these seem to include data on jobs which “will be affected” and it’s not 100% clear how many of these are permanent jobs which will be eliminated vs. permanent posts which will not be filled, or contract jobs which will not be renewed. All of these nuances may sound petty, but it’s really hard to get meaningful numbers unless you get this stuff right.

    The story of how universities and colleges deal with the sudden loss of international student income (and the long-term consequences of provincial disinvestment) is the biggest and most consequential story in Canadian postsecondary education this century. How we deal with this collectively will shape the sector for over a decade, maybe even out to 2050. The HESA Towers team is working hard to document what is happening and help the sector make sense of fast-moving events and respond appropriately. So today I want to tell you about two initiatives we’re launching.

    The first is a Retrenchment Watch, which will follow developments in institutional cutbacks not just in Canada, but around the world (albeit with a particular focus on the anglosphere). Higher education probably hit peak public funding around the globe over a decade ago, but what we’re now seeing is an actual contraction of the sector as a whole, happening via an un-coordinated set of decisions made by individual institutions according to local imperatives. Understanding how this is happening is of great importance, not just for posterity but for present-day decision makers. And we’ll be making this information freely available to all via Retrenchment Watch.

    For the moment, the Retrenchment Watch is extremely bare bones, but we’ll be filling it out very quickly over the next few weeks, with the Canadian institutions first. If you want regular updates on who is cutting what as well as some basic pattern analysis, please fill out this form, and we’ll get you signed up to our newsletter so you’re always up-to-date.

    The second is what we are calling “The Recovery Project.” We know that institutional leaders aren’t just thinking about surviving cuts, they’re also thinking about how to position their organizations to thrive in the aftermath. To help them, we’re launching a subscription research project looking at universities and colleges around the world who have faced serious financial sustainability problems over the past three decades and examining how they turned their fortunes around. In a crisis, there’s no time to re-invent the wheel: with this research institutions can understand better what works, when and why. By spreading the cost of research collectively across many institutions, we can offer this premium product—which involves monthly reports and webinar sessions for all members—at a huge discount to individual schools (and if your school is a member of the University Vice-President’s Network, we’ll be offering an even bigger discount).

    If you’re interested in joining this project, my colleague Tiffany MacLennan has been working to bring this information together. Email her at tmaclennan@higheredstrategy.com and we’ll get back to you ASAP with a prospectus.

    There’s no disguising how the sector is taking a beating right now. It will recover. The only question is how quickly, and which institutions will be at the forefront.

    Source link