Higher education institution finances are not like the finances of other organisations, in the strange blend of commercial imperative and charitable purpose.
A big portion of their revenue is driven by loss-making activity in research and programmes that lose money; their surplus-driving activity in international recruitment is hyper-competitive; and they have a cost base in salaries, pensions, and infrastructure that are influenced by factors outside their direct control.
The current moment of financial pressure on higher education has tightened focus on the governance of university finances, with concerns expressed by the Department for Education and the Office for Students in the English context, and particular scrutiny from government and regulators in Scotland in light of the financial crisis at the University of Dundee last year.
To the extent that governments set the terms of the higher education funding settlement it is perhaps unreasonable to lay blame for any given higher education institution’s financial struggles at the feet of the board of governors or university leadership. But even with this caveat, the realities of the current moment call for well-managed internal financial governance and robust scrutiny and challenge of the executive’s plans from governing bodies.
None of this is straightforward – the structures and cultures of higher education require a level of negotiation between academic priorities, external policy drivers, and organisational sustainability. Commercial acumen must be balanced with consciousness of the social mission and the rewards offered by short-term opportunities set against the responsibility to steward organisations that play a critical role in the national wellbeing for the long term.
Together with TechnologyOne, we recently convened a private round table discussion among a group of COOs and financial directors, representing a diverse range of higher education institutions. We wanted to explore how these pressures are manifesting as emerging priorities for governance, and the nature of those priorities for finance leaders.
Board cultures and capabilities
One participant wryly observed that not every board member may have a full understanding of the scale of the challenges facing the sector as a whole, and their institution in particular, at the point of taking up their role, and their first exposure to the financial realities can sometimes be shocking. Commercial experience and acumen are much in demand on boards in financially challenging times, but that commercial awareness has to be deployed in the service of financial sustainability – and the definition of “sustainability” can be something of a moving target, especially when the future is uncertain.
Attendees shared several examples of the kind of tensions around financial decision-making boards have to work through: between the cash demands of the next 18 months and the longer-term investments that will ensure the institution is still able to achieve its mission five years or a decade into the future; or between stockpiling reserves to guard against future risks versus delivering mission-led activity.
There can be no right answer to these questions, and ultimately it is for the leadership of the institution to be accountable for these kinds of strategic choices. It is not that board members don’t understand the financial fundamentals, but that, attendees reflected, the nature of the trade-offs and the implications of some decisions may not be fully taken account of as the discussion unfolds. Financial directors and CFOs can play a critical role in ensuring these board-level discussions are shaped constructively, through prior briefing with board and committee chairs, and through being brought into the discussion as appropriate.
Risk, risk appetite and forecasting
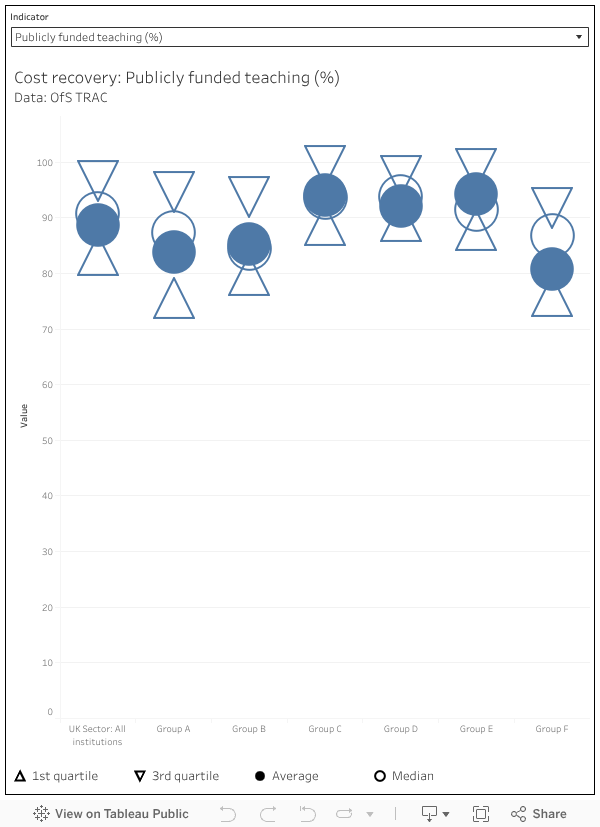
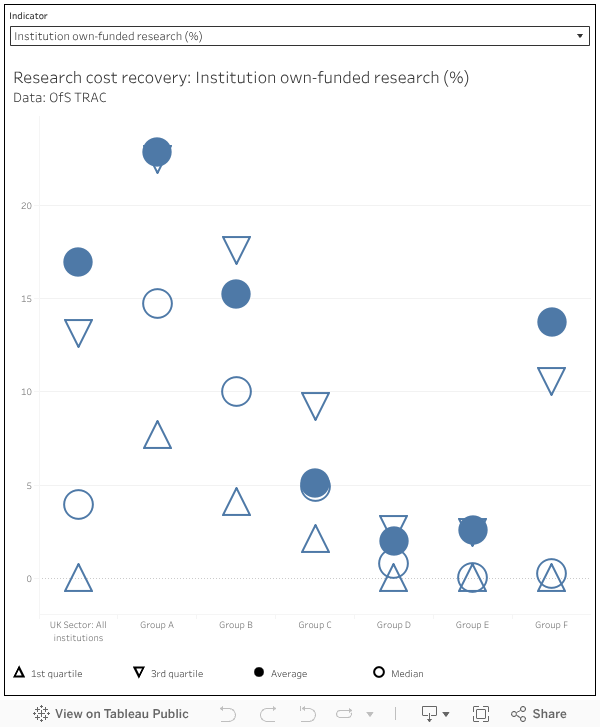
Boards are, in light of ongoing public discussion about the risk of institutional financial crisis or even insolvency, naturally concerned about avoiding being the next institution to hit the headlines as facing serious financial challenge. Paradoxically, there was also a sense that this driving concern can lead to risk averse behaviours that are not always in the best interest of the organisation, such as conserving cash that could be used for surplus generating activity, or looking at revenue raising independently from the costs implied in raising revenue – the gap between the revenue and real cost of undertaking research being a classic example.
One area to improve is understanding of risks, and risk appetite. Boards can, broadly, be appraised of risk and particularly financial risk. However, they can be less fluent in considering the risk they are willing to endure in order to solve some of their underlying challenges, or the relationship between risk and opportunity. For example, boards may see an inherent risk in their cash flow position. They often lean toward conserving cash (a low risk appetite) but this may actually worsen their cash position if they do not look at revenue generation (a more risky proposition.) At the other end of the spectrum boards may be tempted to pursue opportunities to raise revenue that do not contribute to, or distract from, the wider organisational mission and strategic objectives.
Dealing with uncertainty is never easy, and there was a lively discussion about the role and purpose of financial forecasting, with one attendee pointing out that the idea of creating a five year financial forecast in a sector that is changing so rapidly is “a bit of a nonsense” with another observing “the only thing we know when we’re putting together our forecast is that it’s wrong.”
It was noted that some boards spend very little time on the forecast and it was suggested that this was an area for greater focus, not to attempt to accurately predict the unpredictable but to socialise discussion about the nature of the uncertainties and their implications. One attendee argued that the point of the forecast is not in the accuracy of the numbers but that there are agreed actions following from the forecast – “we know what we’re going to do as a result.” Another suggested that the Office for Students could potentially offer some additional insight into what it expects to see in the financial returns at the point of preparing those returns, rather than raising concerns after the fact.
Data and systems
The institutional systems that bring together disparate financial systems into a single picture are of varying quality. Sometimes, universities are dependent on an amalgamation of systems, spreadsheets, and other data sources, that involve a degree of manual reconciliation. Inevitably, the more systems that exist and the more people who input the more room there is for disagreement and error. Even the most sophisticated systems that include automation and checks are only as accurate as the information provided to them.
The accuracy and clarity of financial information matters enormously. Without it it becomes impossible to know where the gaps are in terms of income and costs. Managers and budget-holders cannot understand their own situation and it becomes much harder to present a clear picture to executive teams and from there, to boards. A key “ask” of financial management systems was to integrate with other data sources in ways that allow the presentation of financial information to be legible and allow for a clear story to emerge.
Attendees at the round table reported a number of areas of focus in tightening up internal financial management and visibility of financial information. One critical area of focus was in improving general financial literacy across the organisation, so that institutional staff could understand their institution’s financial circumstances in more detail. Institutional sustainability is everybody’s problem, not just the finance team’s.
In reporting to board, attendees were working on shortening and clarifying papers, providing more contextual information, and making greater use of visual aids and diagrams, with one attendee noting “the quality of management reports is an enabler of good governance.”
In times of financial pressure and challenge, the quality of financial decision-making is ever more intimately tied to the quality of financial information. Budget holders, finance teams, executive teams, and boards all need to be able to assess the current state of things and plan for the future, despite its uncertainties.
Effective governance in this context doesn’t mean fundamentally changing the management processes or governors departing from their traditional role of scrutiny and accountability, but it does mean engaging in an ongoing process of improving basic financial processes and management information – while at the same time embedding a culture of constructive discussion about the overall financial position across the whole institution.
This article is published as part of a partnership with TechnologyOne, focused on effective financial governance. Join Wonkhe and TechnologyOne on Thursday 29 January 12.00-1.00pm for a free webinar, Show them the money: exploring effective governance of university finances.