As I noted yesterday, there are only two institutions in Canada which have run deficits in each of the last five years: St. Thomas University (STU) and Vancouver Island University (VIU). In both instances, these institutions have had deficits averaging between 4 and 5% of their total income over the course of those five years. By any definition, this puts them on some kind of watch list.
As Figures 1 and 2 show, the root cause of both institutions’ problems is the same—namely, a big two-stage decline in enrolment. The first stage came in the early 10s, when the domestic youth population was shrinking, and the second came during Covid. The numbers are particularly bad at VIU, where the number of international students is down by over 35%. If these institutions could just get their enrolment numbers back to where they were in 2018, then STU’s tuition income would be about $3 million higher, while VIU’s would rise by roughly $20 million. In both cases, that would be enough to put the institutions well into the black. The much larger numbers at VIU are not just because it is a larger institution, but because the recent fall in student numbers is happening disproportionately on the international student side.
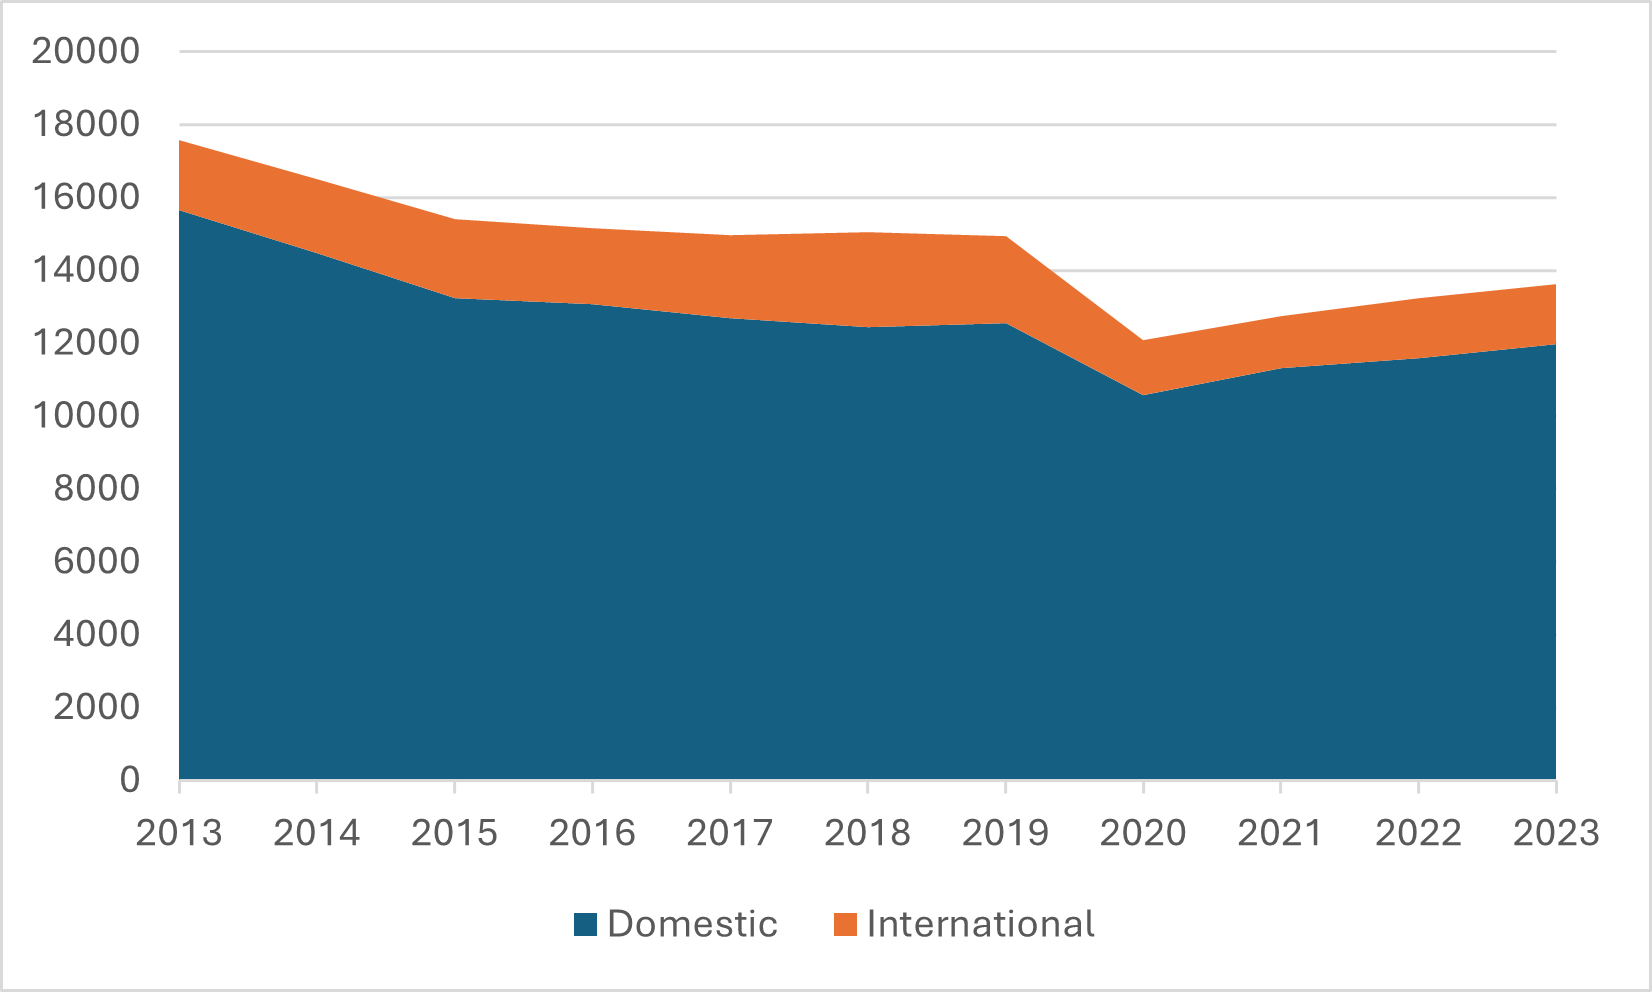
Figure 1: Domestic and International Enrolment, St Thomas University, 2012-12 to 2022-23
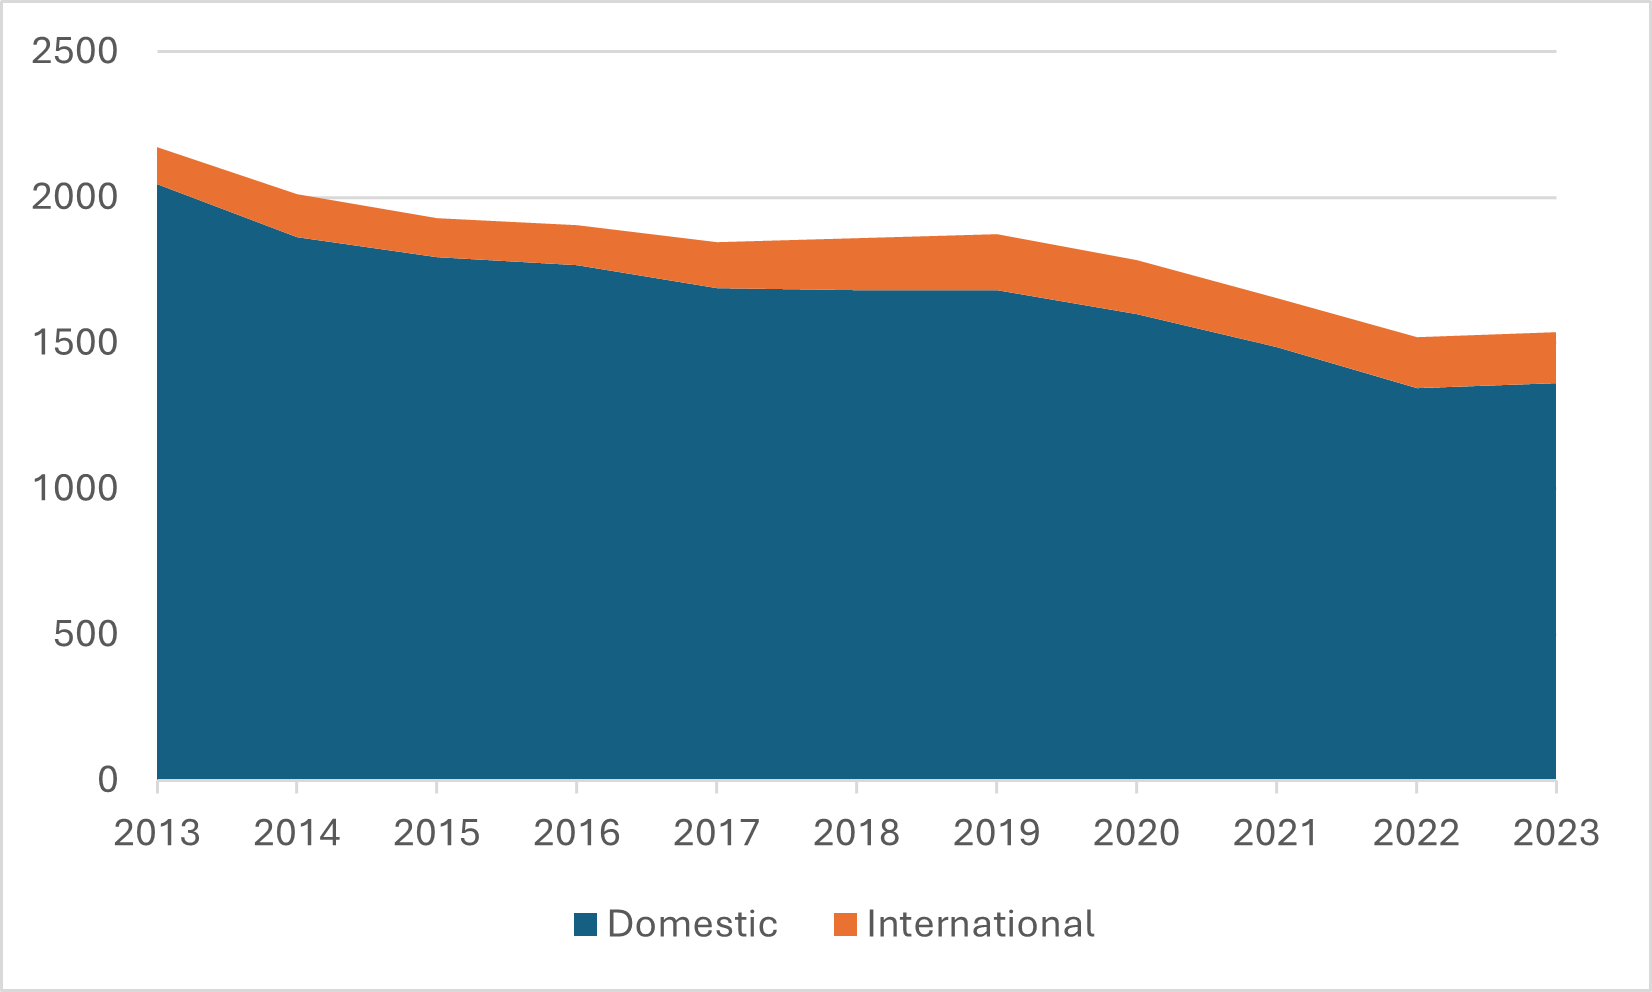
Figure 2: Domestic and International Enrolment, Vancouver Island University, 2012-12 to 2022-23
At this point, folks, I am going to have to do something which some might find triggering, which is to invoke the L-word, because I am quite certain that everyone remembers the extent to which falling enrolment and a drop in tuition revenue were among the key elements in the collapse at Laurentian. I am not going to do this because I necessarily think either of these institutions is following the Laurentian path exactly. One very big dissimilarity is that neither STU nor VIU has any long-term debt, which was another of the key factors at work at Laurentian. Rather, I am doing it because I think at least some of the same dynamics are at play, particularly at VIU, which just happens to be about the same size as Laurentian in terms of enrolment and budget size, albeit without some of Laurentian’s big ambitions with respect to research. In fact, given the VIU/Laurentian similarity, I will concentrate the rest of this analysis on this west coast institution. I might come back to STU sometime, but for the moment, I will leave it aside.
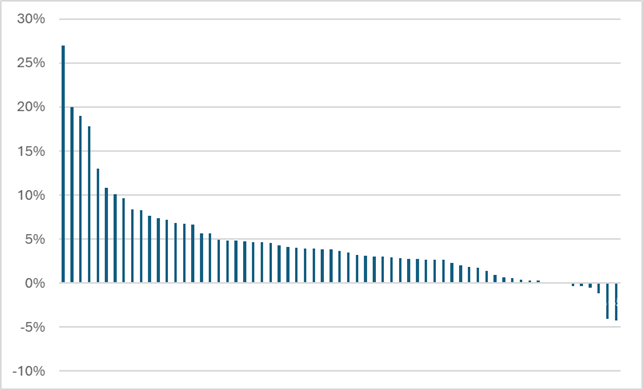
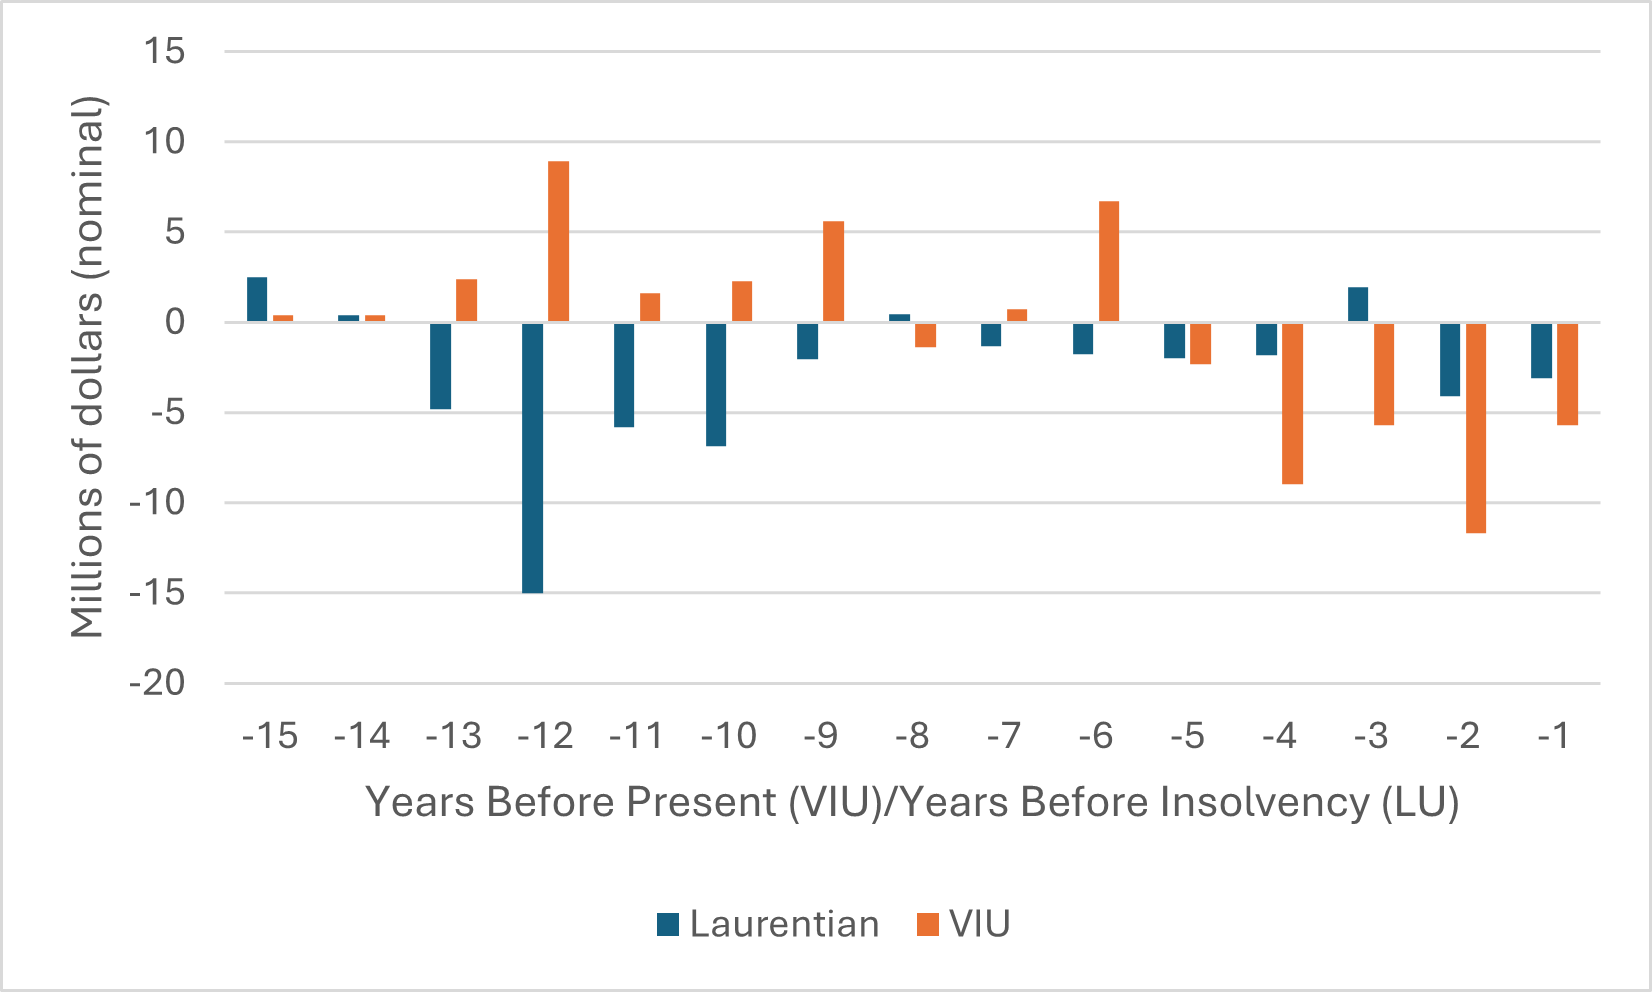
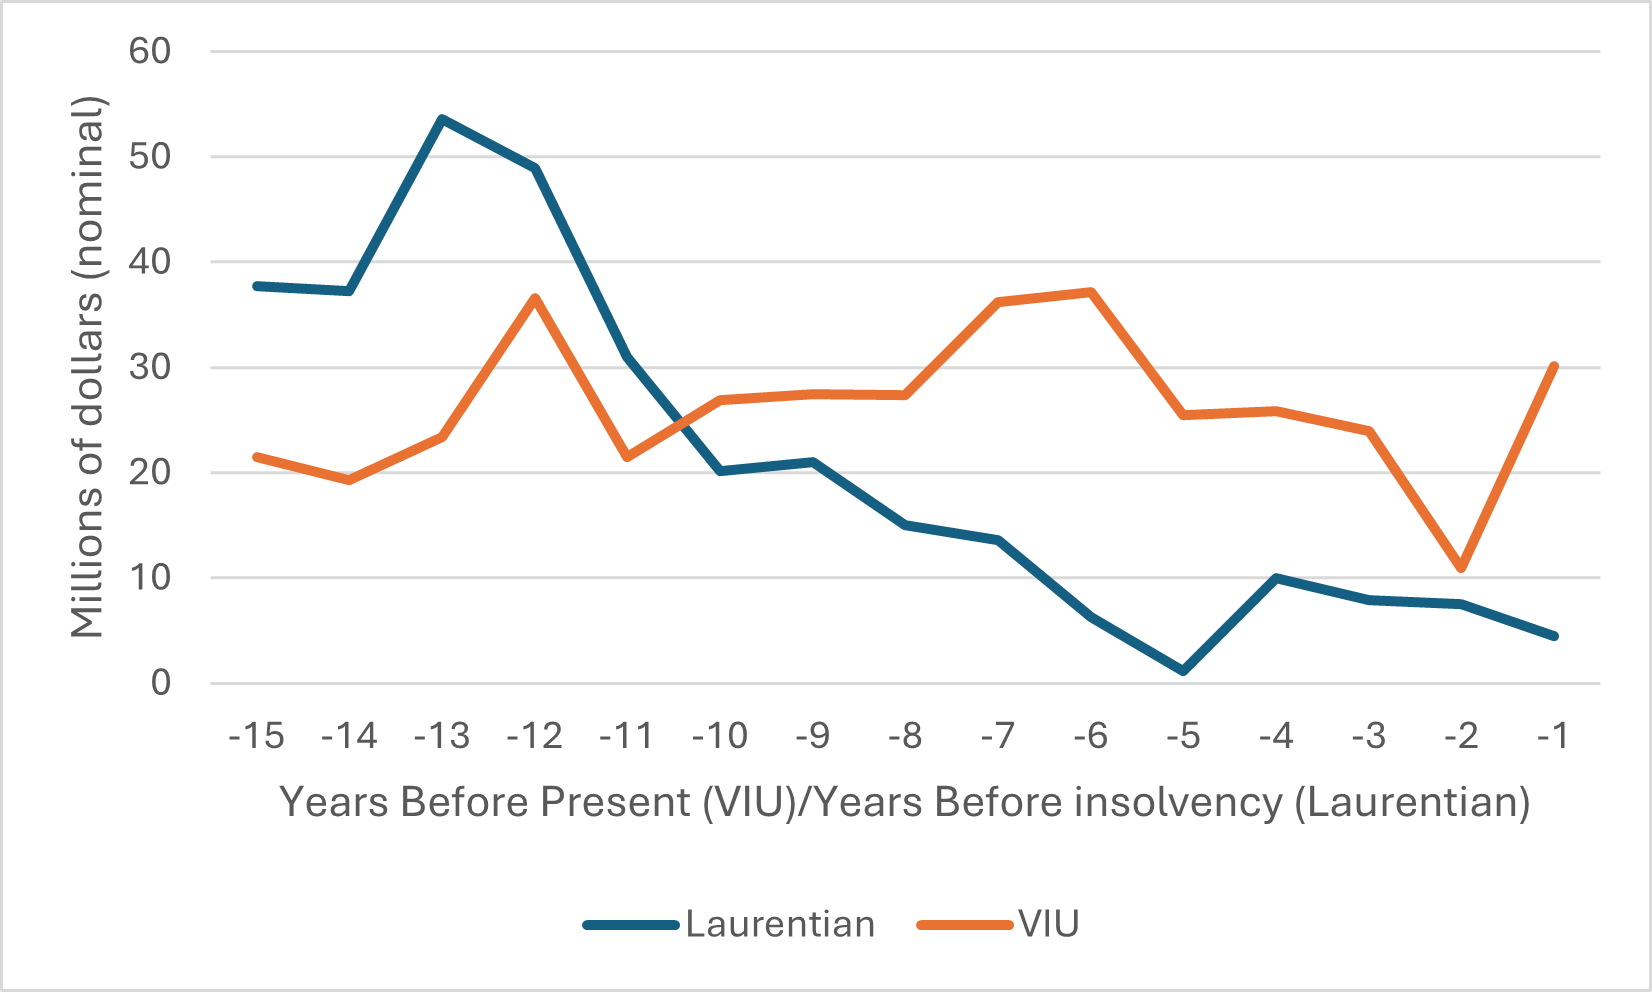
Let’s start by looking at budget surpluses over time at VIU and Laurentian. Figure 3 shows the last fifteen years of VIU’s surpluses/deficits and compares them to the fifteen years prior to the insolvency declaration at Laurentian. Based simply on the last five years or so, there is no question that VIU is actually worse than Laurentian. The institution has spent $34 million more than it earned in the last five years; Laurentian, in contrast, was only $9 million in the red over a similar period prior to insolvency. But shift your eyes to the left of that graph for a minute, and you’ll see another difference: Laurentian ran deficits basically for most of the fifteen years prior to its events, whereas VIU was in pretty good shape. What that meant was that when the bad times started five years ago, VIU had a decent accumulated surplus to draw from. That is why the institution has been able to carry on over the past few years, but since it has now drawn down well over half of its accumulated surplus ($30.6 million in 2024, down from $78 million in 2018), that strategy doesn’t really have any more room to run.
Figure 3: Long-term Record of Surpluses/Deficits, in Millions, Laurentian vs VIU
There are also significant differences between the two institutions when you look at cash balances, as below in Figure 4. Laurentian was basically out of gas and surviving on fumes for several years prior to the collapse, with cash reserves barely enough to cover a couple of weeks of operating expenditures; VIU has never been anywhere near that point. However, note the big dip in VIU’s cash last year. It reversed itself, but only because the institution sold off a big chunk of portfolio investments precisely (I think) to boost cash reserves. There are warning signs here for sure, albeit nothing like Laurentian’s blaring klaxons.
Figure 4: Long-term Record of Cash Position at End of Fiscal, in Millions, Laurentian vs VIU
The final comparison I want to make has to do with what is known as the “working capital ratio.” This is one of the key financial tests that the Government of Ontario uses to identify institutions in financial trouble, and it is the ratio between “current assets” (basically, cash plus accounts receivable) to current liabilities plus deferred contributions for research. Anything below a ratio of 1 puts you in the “high-risk” category.
(Nota bene: some people think this ratio is not very useful because in a liquid market, institutions can move “long-term” investments to short-term fairly easily—as indeed VIU seems to have done last year when it sold off some of its portfolio investments in order to recharge cash reserves. However, since it’s an official government metric, it’s probably due a little respect, so I am using it here anyway.)
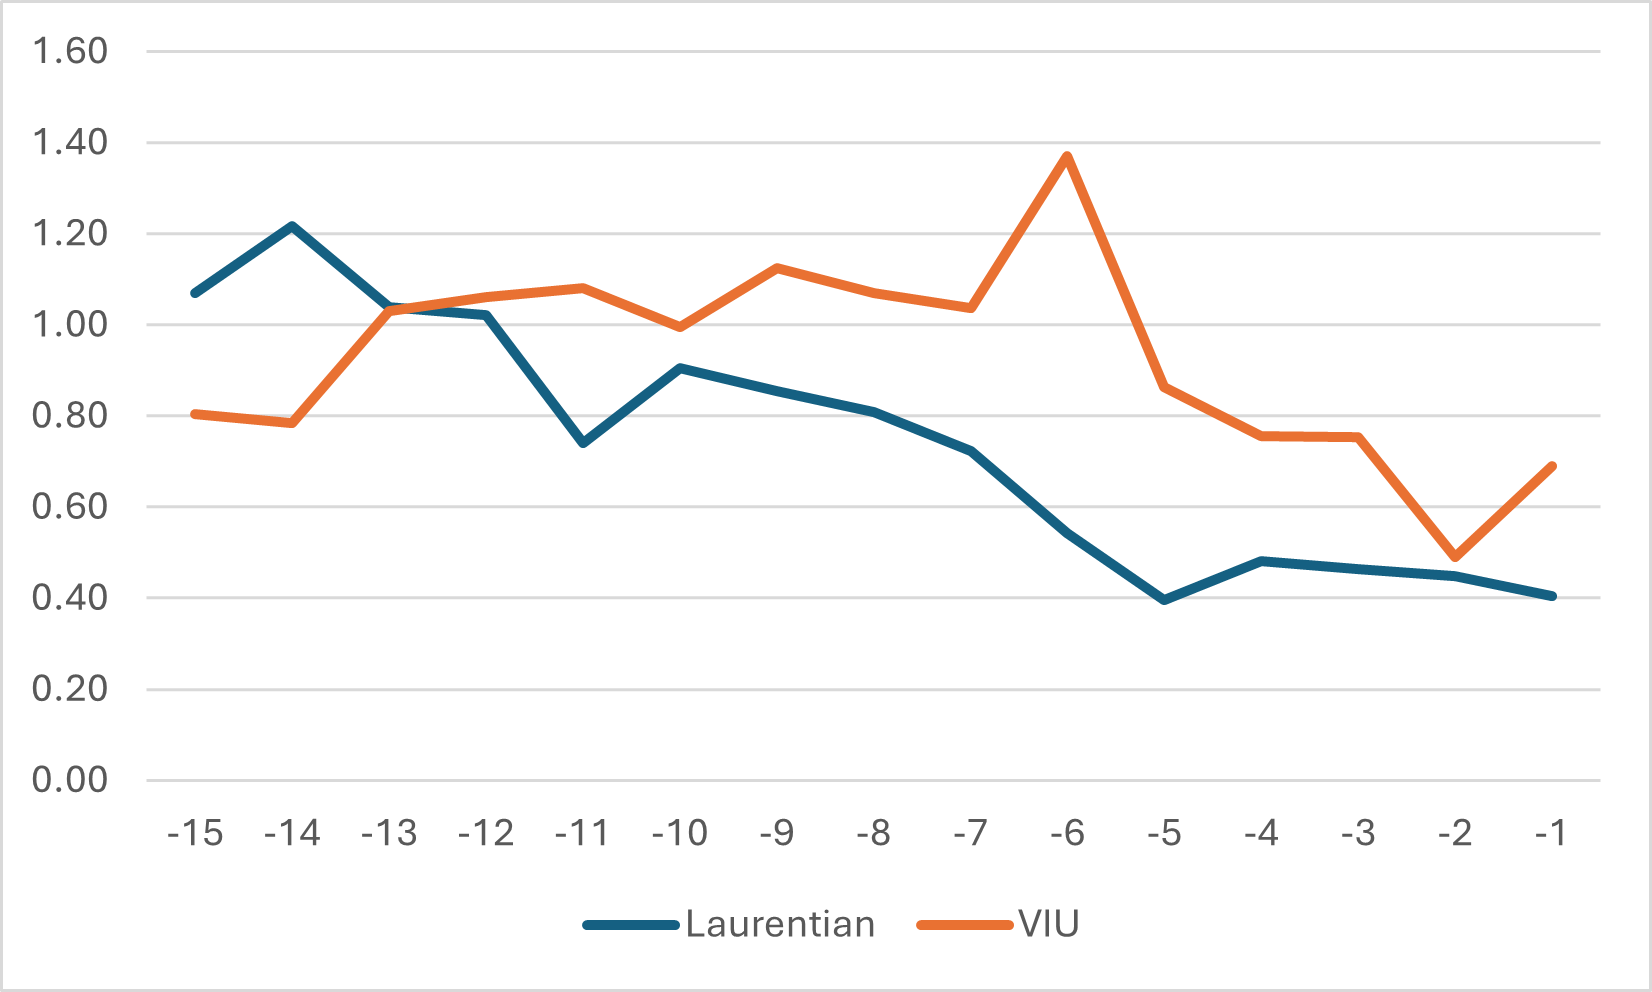
One challenge in comparing VIU and Laurentian on the working capital metric is that they don’t quite calculate their liabilities identically, mainly because their respective provincial governments don’t ask them to categorize balance sheets in the same way. Specifically, VIU does not break out “current” from long-term liabilities, and also it lists substantial sums of tuition fees owed as “deferred revenue” while Laurentian does not. My read of this is therefore that to make the two sets of data on current liabilities comparable, one has to exclude from VIU’s numbers both “deferred capital contributions” and “deferred revenue”. Which is what I have done below in Figure 5.
What Figure 5 shows is arguably similar to what Figure 3 shows: a metric in which a) neither institution looks particularly good, but b) Laurentian’s position is on the whole worse, and c) Laurentian’s deterioration is long and gradual while VIU’s is rather sharp.
Figure 5: Long-term Record of Working Capital Ratios, Laurentian vs VIU
To be crystal clear: I don’t think VIU is really on the verge of Laurentian-ing. It has no long-term debt. It has had a bigger cushion to fall back on. The province is on the verge of a youth boom, which should help a bit in bringing student numbers and revenues back up. It is working for a provincial government which is far more proactive than the frequently clueless one in Queen’s Park. And in fall 2023, it adopted a fairly aggressive if not especially strategic program of cost-cutting (ten percent for all units over three years), which in theory was supposed to right the ship.
However:
- Even if VIU is not Laurentian, many of its key financial indicators look awfully familiar. From deficits to cash levels, to working cash ratios, it all seems very Mark Twain: history does not repeat, but it rhymes.
- That aggressive deficit reduction package didn’t reckon with Marc Miller, whose cuts to visas and policy of publicly crapping on the quality of Canadian institutions is likely to result in further drops in international student numbers and therefore reductions in income in the millions of dollars. There could still be problems ahead (I assume this may be what has been behind this week’s decision to consider suspending and/or cancelling roughly twenty programs at the diploma, undergraduate and graduate levels).
- The VIU community appears to be only dimly aware of how bad things are. When VIU President Deborah Saucier recently resigned, it was—according to CBC at least—because the VIU community would not support further cuts because they were not “supported by evidence.” Now, there may have been more to it than that (Lord knows CBC can be pretty crapulous at fact-checking post-secondary stories), but if it is anywhere near the truth, then the VIU community is clearly having some trouble facing a pretty serious reality, and that complicates any revival plan.
Vancouver Island needs a second, flourishing undergraduate university and that can only be achieved through a strong financial base. Best wishes, therefore, to the folks at VIU as they grapple with these issues.