Just before I headed out on a work/vacation trip (I’m in Costa Rica today), the Government of Alberta dropped the report of the Expert Panel on Post-Secondary Institution Funding and Alberta’s Competitiveness, which I had previewed back here when the panel was formed about a year ago. So, on the way to the airport, I dashed off this blog to give you all the skinny.
First: it’s a good report! Might be the most sensible report on PSE that’s come out in Canada for quite some time, not least for the ways the Panel went beyond its mandate and actually addressed the elephant in the room, which was “how is Alberta going to educate this huge wave of students heading its way?” – a point which the government pointedly omitted from the Panel’s terms of reference. There are a few things in here which I think are a bit under-thought, which I will address below. But in the main, this is a report which you could apply in almost every province and we’d have a much better system than we have now.
The report starts by laying out what it calls a “framework” for policy, which should:
Provide a space for every qualified Alberta student who wants to pursue post-secondary education (though, this could be quite expensive…I think it was a deliberate political choice to not include any costing in this document)
Focus on outcomes, providing incentives and rewarding performance in three key areas: teaching and student experience, research, and the impact institutions have on the communities they serve.
Set tuition in a manner that balances the importance of certainty for students with the reality of increasing costs in institutions.
Encourage government to reconsider the extent of controls it exercises over institutions, and reduce unnecessary red tape, so as to provide institutions with the autonomy and flexibility they need.
See? All eminently sensible. But, of course, the devil is in the details, which the panel outlines in eleven specific recommendations. Seven of these are so sensible that they barely require comment. These include recommendation 3 (improve funding and administration of apprenticeship programs), recommendation 4 (fund IT infrastructure on a long-term basis rather than via ongoing operating funding), recommendation 6 (bring back student grants!), recommendation 7 (more international students!), recommendation 8 (government to back off, provide institutions with more autonomy), recommendation 9 (less red tape for institutions), and recommendation 10 (faster government approval of new programs).
So far, so good. The remaining four recommendations present some complications, though. I’ll go through them one by one.
Recommendation 1 suggests that Alberta should adopt an actual funding formula to divide public spending between institutions (it is currently one of the largest jurisdictions in the world without one; to my knowledge only BC is bigger). It further suggests that the formula consists of three components: weighted enrolment, (i.e. weighted to recognize that clinical education costs more than laboratory education which costs more than classroom education), performance (assuming the indicators are smart and measurable, which the panel suggests might not be the case for all the indicators in the current performance-based funding arrangement), and a “base” funding component.
All fine in principle, but two points. First, when you have institutions as disparate in size as Alberta does (50K at University of Alberta to 1300 at the Alberta University of the Arts), a “base” component is hard to design properly. The idea is to recognize that institutions have fixed costs that probably won’t get covered properly under an enrolment-weighted formula alone but that’s hard to do in a way that actually works but doesn’t wildly subvert any normal principles of equity (I know, I tried sketching one for the Manitoba College system a decade ago, and it’s hard). Second – and somewhat relatedly – the Panel skips over the bit where a previous government within the last decade tried to do develop a formula much like this one and discovered that any sensible enrolment-weighted system would probably eviscerate two or three of the smaller regional colleges, which was seen as impractical from a political POV (the Minister of the Day trashed the report without publishing it, which is why you may not have heard this story). The math and politics won’t have changed, so getting this idea up and running might be easier said than done.
Onwards to recommendation 2, which asks the government to introduce targeted, time-limited funding initiatives to a) attract top research talent, b) support innovation and developing technology, and c) provide incentives and support for collaboration among institutions. The ideas are fine, but the logic for time-limiting the measure seems obscure to me.
Now to recommendation 5, on tuition fees. This is where the report is at its hand-waviest, and I think there is a lot of subtext here which is not fully explained. Currently, there is a 2% cap on all tuition increases. The panel wants that to be maintained for students once they have begun their studies, so as to give them “price stability”. But they also think that institutions should be given “discretion” to raise tuition for first-year students more radically year-by-year, because institutions need money.
Here’s where it gets handwave-y. The panel does not advocate for de-regulation; whether out of conviction or political realism I can’t say. Rather, it suggests that the Alberta government should set “maximum allowable tuition” every year, on a field of study basis, and institutions should have the freedom to set tuition fees up to that maximum. I think the logic at work here is the same as that seen in the UK in both the 2006 and 2012 fee reforms, which was that if the government set a maximum, institutions would have space to “compete on price” and the big prestigious universities would be able to charge a quality premium. As we saw in the UK, though, this is a naïve assumption: since price tends to act as a proxy for quality in the public mind (because God forbid anyone actually try to measure quality), what happens in these situations is that all institutions will quickly drive to the max, meaning that in effect, it’s still government setting the fees, with all the politics that entails (decent chance the maximum will be $0 if/when the NDP return to power). I am not sure this has been well thought-through.
Anyways, on to the final recommendation, which is that on Equity, Diversity and Inclusion (which, it should be noted, was also not part of the Panel’s mandate). In the discussion section, it cites mostly American examples, argues for “institutional neutrality” with respect to political issues (this means no boycotts, apparently, although I suspect if the panel told Alberta’s Ukrainian community that U of A was going to be forced to maintain relations with Russian universities on grounds of institutional neutrality, there would be riots). It also makes veiled references to “federal research grant requirements, which require explicit commitments to equity, diversity and inclusion as part of their selection and approval process…[which] can limit academic freedom and direct the focus of research”. So far, so Alberta.
But then if you look at the actual recommendation, there are two points to make. The first is that the panel chooses to place “Indigenization” as a separate category from the rest of EDI (they don’t quite say Indigenization = good, EDI = bad, but you’d be forgiven for thinking that this is in fact the panel’s view). And the second is that the actual recommendation is pretty anodyne. It’s written in such a way that allows the anti-woke to claim that we need constant vigilance and for institutions to be able to hit the snooze button and go back to sleep because they already do what is being recommended. Not quite a nothing burger, but pretty close.
In any event: it’s a solid report and while I think there will be one or two twists and complications in implementation, the direction in which it points is a promising one. Hopefully the government will accept the report and get to work on it as soon as possible.
The economics of higher education are tricky. It’s a labour-intensive industry, and generally speaking the cost of producing labour-intensive goods will always increase faster than the price of producing capital intensive goods, because the latter have more scope for increasing productivity. That’s not a problem if you are a public institution in a country with bottomless pockets, or if you are a prestigious private institution with almost unlimited ability to raise prices. If you’re among the other 99 percent of the world’s institution, though, you have to find ways to balance rising costs with new sources of income. But every money-making scheme comes with problems…and costs! So which one to choose?
Today’s guest is Joshua Travis Brown, from Johns Hopkins University’s School of Education. He’s the author of a new book called Capitalizing on College: How Higher Education went From Mission-Driven to Margin-Obsessed, which follows the fortunes of a number of institutions who try out different strategies to try to keep themselves afloat. Some try to double-down on a historic place-based residential mission and charge higher fees; others try to find ways to generate revenue that can cross-subsidize their historic place-based activities. But what’s particularly intriguing about this book is that his subject institutions are all religious institutions. Not only does that mean no core public funding: it means that decisions about how to find new business lines all really have to pass a test of God vs. Mammon.
This really is one of the best higher education books of the year and I was so pleased we could get Josh on the show. I won’t spoil the fun any more: here’s Josh.
The World of Higher Education Podcast Episode 4.6 | Capitalizing on College: Mission, Money, and Survival in Higher Ed with Joshua Travis Brown
Transcript
Alex Usher (AU): Josh, your book is one of my favorite kinds of higher education books—lots of real, if disguised, institutional case studies. I get the impression that what you were trying to do was look at different financial strategies to cope with the phenomenon of ever-rising costs in higher education—Baumol’s disease, basically. How did you choose those eight institutions for your case studies? And why did you focus only on religious institutions, which I thought was a really intriguing choice?
Joshua Travis Brown (JTB): Thanks, Alex. That’s an excellent question to open with. I was looking around at the world, and a lot of what we in higher education base our norms on are the best practices maintained by elite institutions—those that accept only about five to nine percent of applicants. But then there’s the other ninety-one to ninety-five percent of institutions that don’t have those kinds of resources, and their world looks radically different.
One group I focused on are what we call tuition-driven institutions in the American sector. That’s actually a very diverse set of schools that, I’d argue, form the backbone of American higher education—at least in terms of its diversity. These include Hispanic-serving, minority-serving, HBCUs, predominantly Black, religious, women’s, Asian American, vocational, and regional colleges, among others.
Within that really rich and diverse group, the largest by far are the religious colleges and universities in the United States. There are roughly a thousand of them—Protestant, Catholic, some Buddhist, Mormon, Muslim, and Jewish institutions as well. I chose to sample primarily from the Protestant group. And the reason for that choice is that I was interested in behavior, not belief.
The perspective I argue is most valuable is one that looks at behavior that cuts across institutional types, rather than staying within silos and making what I’d call an erroneous assumption that, “This sector operates this way, and that sector operates that way.” I argue instead that everyone is in competition with one another—and to truly understand the sector, you have to look at behavior across all types.
AU: Based on your work at these institutions, you developed a four-part typology with four types of institutions. You call them those following a Traditional Strategy, a Pioneer Strategy, a Network Strategy, and an Accelerated Strategy. How did you come up with those four? Were they in the back of your mind when you selected the cases, or did they emerge organically from the research?
JTB: This is purely grounded theory—straight from the data. What I’m arguing here is that I’m looking within what I call the “missing middle.”
A lot of higher education research tends to focus on what I call the bookends—students on one end, and government or the state on the other. But we don’t do a great job, as researchers, of really diving in to hear the voices of those actually running and leading the institutions.
So as I started to look at the data, pull out themes, and group them into buckets, these four strategies emerged. There was even a fifth one beginning to appear, which I called Accelerated Networks—where the accelerated institution was trying to crack the code to move to the next level of market-oriented behavior. So yes, they surfaced organically from the research.
AU: Let’s talk about that Traditional Strategy. What does it entail? What kind of resources does it take to implement? And how easy is it to, you know, for lack of a better word, win using this strategy?
JTB: The Traditional Strategy is your typical higher education institution that values prestige. They’re constantly looking to the elites.
There’s a whole sector of “little Ivys,” “public Ivys,” and “mini Ivys” that sit just below the Ivy League institutions, and they’re really trying to leap forward into that group. These institutions not only value prestige, but they also operate under the assumption of an in-person education. As one president told me, “You come to a tradition.” He repeated that phrase several times. These institutions rely heavily on building their brand, climbing the rankings, ensuring their athletics are top-notch, and gaining national exposure through sports. They want to become household names.
The problem for traditional institutions—and really, for all institutions—is that the residential, on-campus, in-person model of higher education in the United States operates at a deficit. It must be subsidized.
For the traditional institutions, that subsidy comes primarily from endowments—the spinoff revenue that supports the residential model. And the key takeaway from the book, across all these strategies, is that everyone is trying to subsidize the residential core. What differs is how they do it.
The traditional model depends on philanthropists, wealthy donors, and the prestige that fills their sails. They can call on endowments of two, three, four, five, six, even eight hundred million dollars—and the revenues those spin off—to make their operations sustainable. Or at least, so they think.
AU: Tell us about the second strategy then. You’ve got a Pioneer Strategy. What does that mean—and where do those subsidies come from, if we can put it that way?
JTB: From this point forward in the book, everything turns entrepreneurial. These institutions no longer look to endowments—because they don’t have them. So, for the next six schools in the book, every president is basically saying, “I don’t have an endowment. I need to find margins—and I need to find them somewhere.”
And what they do is turn to students. That’s where they find their margins.
In the Traditional Strategy, as I mentioned earlier, the assumption was that you come to the institution for the tradition—to receive it, to be inculcated into it. The Pioneer Strategy turns that idea on its head. These institutions ask, what if we took the classroom to the students?
That’s the innovation here. Every one of the next strategies has some kind of innovation at its core. In many ways, this book is a story—or a playbook—of innovation. That’s what I hope readers take away: not just the strategies, but the innovative practices themselves.
So, these institutions took classrooms to hotels. They took classrooms to schools and high schools, to shopping malls, to military bases. They went to where the customer was. The classroom became reconceived—portable. And they picked a type.
I take readers through three different types in that chapter, and then show how they replicate it. Whatever region they’re in, what you end up seeing is a giant branch campus model built around that one specific type.
You’ve got multiple sites, but all following the same formula. And all of the revenue—say, a 20% profit margin—from those branch campuses flows back to the core institution. That’s how they rebuild the core.
Over the course of a decade, they can raise anywhere from two hundred to five hundred million dollars—and they use that money to physically transform and rebuild the residential campus.
AU: But all those markets you’re talking about—it’s really just mature students, right? Are there other pioneer markets you can go to besides mature students?
JTB: The principle here is that these institutions were first movers. They were the first movers in adult education at the time.
For readers today—if I’m a leader picking up this book and asking, “What’s the takeaway here?”—I’d say: think badgification, think microcredentials. Think of some new market that’s just about to spin off or is moments away from being spun off.
Anyone who goes all in on that kind of emerging market would be a pioneer institution. They’d be adopting the Pioneer Strategy for that new market—just as these institutions did about a decade ago.
AU: Does it work? I mean, it takes money to make money, right? You’ve got to rent the hotel rooms, pay the professor to go there and teach. It sounds like you have to be extremely margin-conscious—and at a certain point, it’s easy to overshoot, to overcommit to these kinds of things. So how many of the institutions you looked at actually managed to reinforce the residential core?
JTB: They did—but by the time I arrived on campus, the folks in the Traditional bucket were saying, “Oh my gosh, we need a new strategy.”
Meanwhile, the folks at the Pioneer institutions were saying, “Hey, this has worked for about five to seven years, but the competition is so intense it’s eating into our margins. Other institutions are moving into our space. It’s getting really hard to recruit. We need to add a new market.”
And that’s the principle behind the Network Strategy. Rather than having one type, they add multiple types. That’s the big difference between the two: the Pioneer Strategy has one type with multiple sites, while the Network Strategy has multiple types, multiple sites—and it’s global.
AU: Let’s talk now about that Network Strategy. Just as you were finishing there, I think you were saying the difference between the Pioneer and Network strategies is how many new markets you go after. Is it more than that, or is that really the key distinction between the two?
JTB: No, that’s the big difference—because again, what we’re really trying to figure out here is: how are you subsidizing your residential model? It never makes enough money on its own. So where are you finding those margins? And those margins always come from the periphery.
For the Network Strategy, one of the presidents I interviewed described what he called his tabletop strategy for running the institution. He said, “The residential core is the tabletop. All of my peripheral markets—whether online, international, transfer, or adult education—those are the legs. And I’m constantly looking for new legs, new sources of revenue, to support this tabletop.” He went on to say that the tabletop—the residential core—is what gives legitimacy to the entire model. You can’t do this without the tabletop.
And that’s the key difference between the Network Strategy and something like the University of Phoenix. Phoenix was essentially one giant leg. What they lacked—and what people criticized them for—was legitimacy. They didn’t look like a traditional college, and they weren’t serving typical students.
That’s why this book and this perspective are so valuable: when nonprofit institutions start going after the same students or adopting some of the same practices as for-profit institutions like Phoenix, the lines begin to blur. To really understand what’s happening, you have to look across types and sectors—and focus strategically on the behavior itself.
AU: Is that an easier strategy to pull off than the Pioneer one? I mean, it sounds harder to me—but it might also have bigger rewards, since it spreads the risk across different types of markets.
JTB: That’s absolutely key, Alex. One of the presidents I interviewed put it exactly that way. He said, “I’m trying to build a stock portfolio of enrollment. If one sector goes down, I still have another three or four sectors over here, so a drop in one leg isn’t going to sink the ship.” What they were striving for was balance. But both institutions, in their enthusiasm for adding new legs, made a critical mistake—they actually ended up creating a second tabletop.
They either absorbed another institution or built a massive campus overseas—in one case, in Asia. And instead of funneling all of their margins back to the residential core, they had to start directing them to these peripheries, to that second tabletop.
It became really complex. Morale declined. And by the time I arrived on campus, they were looking for a new kind of market—something they could take to scale. And that’s what the next school managed to crack.
AU: Let’s talk about that last strategy—the one you call the Accelerated Strategy. It’s an amazing case study, especially because it’s a religious institution. As you put it, it’s where God and Mammon really start to duke it out.
This is an institution that seems to have crossed the line from being merely margin-conscious to acting like a full-on for-profit college. And that’s wild for a faith-based organization. Tell us about this institution—and how going down this route changes a university.
JTB: You know, what’s crazy is that I changed all the names of the actual schools in the book—but when a school named its competitors, I left those in.
So as I’m interviewing the leaders at the accelerated institution, they’re saying, “Hey, we’re like ASU. We’re like Penn State. We’re like the Maryland system. We’re like Western Governors, UCF, Florida, Southern New Hampshire University.” And they viewed that entire group of schools as their competitors. The way they took their model to scale was through process and product innovation.
I was sitting across from the provost, and he told me, “I had a vision. I pictured an old country store. Down one side of the store was one product, and down the other side was another product—and that’s all we had to sell.” Those two products were an MBA and an interdisciplinary studies degree. At that time, if you wanted to earn a degree online from this institution, those were your only two options. But then he had this transformative idea. Over the course of a single summer, he took roughly 35 to 80 residential courses and converted them for online delivery. Within three to six months, that old store suddenly had 35 different products on the shelves.
And here’s the key innovation: everyone else at the time was selling online classes. This institution became one of the first—outside of Phoenix—to sell online degrees. They fundamentally shifted the product, and that move blew up their market. Virtually overnight, they went from 8% to 42% growth.
AU: Wow. But surely it changed the culture of the campus?
JTB: It did. People talked about the tension between the residential and online sides of the institution. The student population ballooned so dramatically that it went from being majority residential to, essentially, for every ten online students, there was one residential student. It radically transformed the institution. They were able to hold costs flat.
Now, the other entrepreneurial schools I studied were funneling their margins back into overhauling the residential campus. That’s what I call margin capitalization. Instead of looking for donors or venture capitalists, they turned to students.
This particular school made so much money—just north of two hundred million dollars a year—that they were not only able to completely rebuild their campus, but also to put hundreds of millions into their endowment.
What this institution effectively invented is a new form of philanthropy that I call margin philanthropy. Instead of relying on alumni—graduates who go out into the world and eventually give back—you’re leveraging the loans of students who are currently enrolled. They become your new philanthropists.
The risk of construction and the growth of the endowment aren’t borne by the institution anymore; they’re borne by the students themselves—who walk away with a degree in one hand and a student loan, anywhere from fifty to a hundred thousand dollars, in the other.
AU: The problem of ever-rising costs—Baumol’s disease, basically—is one that plagues every educational institution. Only by spending more money every year can you hope to stay in place. But achieving that means raising more money every year.
And I read your book as being fairly pessimistic about any institution’s ability to sustain that in the long run. Right? You can have all the strategies you want to increase revenue, but they all require hiring more staff, becoming more complicated—and then Baumol just reappears further down the line. Is that a fair summation? Do you think one of these strategies is actually more promising than the others? Or does Baumol’s law come for all of us eventually, no matter what?
JTB: I think one of the big takeaways from the book is that this sector is constantly marching upward in its market behavior.
When I arrived on these campuses, everyone was saying, “We’ve got to sustain. We need more. We need more revenue. We need more margins.”
Now, while Baumol, as an economist, has one way of looking at the world, I don’t think it’s entirely accurate. He was, after all, an economist from several generations ago. What’s spun out of economics since then is the field of strategy and management, which focuses more on the agency of actors within organizations.
Those working in strategy and management began to explore that agency—to explain the world in a more nuanced way. And that’s where this book differs from Baumol’s framework: it’s grounded in organizational theory, strategy, and management.
What you end up seeing—and what the book focuses on—is this: we often hear about public policies, particularly from the Federal Reserve in the U.S., that are based on the idea that if you increase competition and give students choice, the natural outcome will be higher quality. As institutions compete, quality should improve—at least in theory.
But what this book shows is that when you incentivize students to be more self-interested and to make market-based choices, you also incentivize institutions to be more self-interested.
That’s why we see institutions going after student loans and seeking margins from students—they’re also operating in a highly competitive market.
So, what this book illustrates are the trade-offs between mission and money that college leaders are forced to make when we choose to design a national education system based on market principles of competition. And that, I’d contend, is a challenge much bigger than Baumol himself.
AU: You’ve focused obviously on one group, the non–research-intensive private institutions, and a particular sub-sector within that. How much can you generalize from this book to other types of institutions—secular ones or public ones?
JTB: That’s a great question. The reason I narrowed the focus so tightly is that, in case studies, what you want to do is control for noise. So rather than mixing all types of tuition-driven institutions together, I chose one type and looked at the behavior across those cases.
But I would contend that because I’m really examining a single phenomenon—tuition—and specifically two questions: how do students get their money, and what do institutions do with it?—this framework is broadly applicable. And honestly, in the last six months especially, I think everyone is becoming tuition-driven.
We’re seeing decreases in research funding revenues, decreases in endowment revenues because of higher taxes. This morning’s headline from the Secretary of Commerce said they want to go after 50% of all patent revenue. And just yesterday, it was announced that all MSI funding would be decreased. The only stable thing left is tuition revenue.
What Capitalizing on College offers is a roadmap for how these institutions managed to survive in a highly competitive environment—and now everyone is entering that same space. So yes, I believe it’s highly generalizable, because this is the roadmap forward. This is the environment we’re heading into.
AU: Joshua Travis Brown, thank you so much for joining us today.
JTB: Thanks. A pleasure being here.
AU: And that just leaves me to thank our excellent producers, Sam Pufek and Tiffany MacLennan—and of course, you, our listeners and readers, for joining us.
If you have any comments or questions about today’s podcast, or suggestions for future episodes, please don’t hesitate to get in touch at [email protected].
Join us next week when our guest will be Luiz Augusto Campos, professor of sociology and political science at the Instituto de Estudos Sociais e Políticos at the State University of Rio de Janeiro. He’s the co-author of a new book on the effects of racial quotas in Brazilian universities. Join us next week. Bye for now.
*This podcast transcript was generated using an AI transcription service with limited editing. Please forgive any errors made through this service.Please note, the views and opinions expressed in each episode are those of the individual contributors, and do not necessarily reflect those of the podcast host and team, or our sponsors.
Welcome to TWTQTW for June-September. Things were a little slow in July, but with back to school happening in most of the Northern Hemisphere sometime between last August and late September, the stories began pouring in.
You might think that “back to school” would deliver up lots of stories about enrolment trends, but you’d mostly be wrong. While few countries are as bad as Canada when it comes to up-to date enrolment data, it’s a rare country that can give you good enrolment information in September. What you tend to get are what I call “mood” pieces looking backwards and forwards on long-term trends: this is particularly true in places like South Korea, where short-term trends are not bad (international students are backfilling domestic losses nicely for the moment) but the long-term looks pretty awful. Taiwan, whose demographic crisis is well known, saw a decline of about 7% in new enrolments, but there were also some shock declines in various parts of the world: Portugal, Denmark, and – most surprisingly – Pakistan.
Another perennial back-to-school story has to do with tuition fees. Lots of stories here. Ghana announced a new “No Fees Stress” policy in which first-year students could get their fees refunded. No doubt it’s a policy which students will enjoy, but this policy seems awfully close in inspiration to New Zealand’s First Year Free policy which famously had no effect whatsoever on access. But, elsewhere, tuition policy seems to be moving in the other direction. In China, rising fees at top universities sparked fears of an access gap and, in Iran, the decision of Islamic Azad University (a sort-of private institution that educates about a quarter of all Iranian youth) to continue raising tuition (partly in response to annual inflation rates now over 40%) has led to widespread dissatisfaction. Finally, tuition rose sharply in Bulgaria after the Higher Education Act was amended to link fees to government spending (i.e. more government spending, more fees). After student protests, the government moved to cut tuition by 25% from its new level, but this still left tuition substantially above where it was the year before.
On the related issue of Student Aid, three countries stood out. The first was Kazakhstan, where the government increased domestic student grants increased by 61% but also announced a cut in the government’s famous study-abroad scheme which sends high-potential youth to highly-ranked foreign universities.
One important debate that keeps popping up in growing higher education systems is the trade-off between qualityand quantity with respect to institutions: that is, to focus money on a small number of high-quality institutions or a large number of, well, mediocre ones. Back in August, the Nigerian President, under pressure from the National Assembly to open hundreds of new universities to meet growing demand, announced a seven-year moratorium on the formation of new federal universities (I will eat several articles of clothing if there are no new federal universities before 2032). Conversely, in Peru, a rambunctious Congress passed laws to create 22 new universities in the face of Presidential reluctance to spread funds too thinly.
But, of course, in terms of the politicization of research, very little can match the United States. In July, President Trump issued an Executive Order which explicitly handed oversight of research grants at the many agencies which fund extramural research to political appointees who would vet projects to ensure that they were in line with Trump administration priorities. Then, on the 1st of October (technically not Q3, but it’s too big a story to omit), the White House floated the idea of a “compact” with universities, under which institutions would agree to a number of conditions including shutting down departments that “punish, belittle” or “spark violence against conservative ideas” in return for various types of funding. Descriptions of the compact from academics ranged from “rotten” to “extortion”. At the time of writing, none of the nine institutions to which this had initially been floated had given the government an answer.
The Organization for Economic Co-operation and Development (OECD) released its annual stat fest, Education at a Glance (EAG), two weeks ago and I completely forgot about it. But since not a single Canadian news outlet wrote anything about it (neither it nor the Council of Ministers of Education, Canada saw fit to put together a “Canada” briefing, apparently), this blog – two weeks later than usual – is still technically a scoop.
Next week, I will review some new data from the Programme for International Assessment of Adult Competencies (PIAAC) that was released in EAG and perhaps – if I have time – some data from EAG’s newly re-designed section on tertiary-secondary. Today, I am going to talk a bit about some of the data on higher education and financing, and specifically, how Canada has underperformed the rest of the developed world – by a lot – over the past few years.
Now, before I get too deep into the data, a caveat. I am going to be providing you with data on higher education financing as a percentage of Gross Domestic Product. And this is one of those places where OECD really doesn’t like it when people compare data across various issues of EAG. The reason, basically, is that OECD is reliant on member governments to provide data, and what they give is not consistent. On this specific indicator, for instance, the UK data on public financing of higher education are total gibberish, because the government keeps changing its mind on what constitutes “public funding” (this is what happens when you run all your funding through tuition fees and student loans and then can’t decide how to describe loan forgiveness in public statistics). South Korea also seems to have had a re-think about a decade ago with respect to how to count private higher education expenditure as I recounted back here.
There’s another reason to be at least a little bit skeptical about the OECD’s numbers, too: it’s not always clear what is and is not included in the numbers. For instance, if I compare what Statistics Canada sends to OECD every year with the data it publishes domestically based on university and college income and on its own GDP figures, I never come up with exactly the same number (specifically, the public spending numbers it provides to OECD are usually higher than what I can derive from what is presumably the same data). I suspect other countries may have some similar issues. So, what I would remind everyone is simply: take these numbers as being broadly indicative of the truth, but don’t take any single number as gospel.
Got that? OK, let’s look at the numbers.
Figure 1: Public and Private Expenditure on Tertiary Institutions as a Percentage of GDP, Select OECD Countries, 2022
Canada on this measure looks…OK. Public expenditure is a little bit below the OECD average, but thanks to high private expenditure, it’s still significantly above the average. (Note, this data is from before we lost billions of dollars to a loss of international student fees, so presumably the private number is down somewhat since then). We’re not Chile, we’re not the US or the UK, but we’re still better than the median.
Which is true, if all you’re looking at is the present. Let’s go look at the past. Figure 2, below, shows you two things. First, the amount of money a country spends on its post-secondary education system usually doesn’t change that much. In most countries, in most years, moving up or down one-tenth of a percentage point is a big deal, and odds are even over the course of a decade or so, your spending levels just don’t change that much.
Figure 2: Total Expenditure on Tertiary Institutions as a Percentage of GDP, Select OECD Countries, 2005-2022
Second, it shows you that in both Canada and the United States, spending on higher education, as a percentage of the economy, is plummeting. Now, to be fair, this seems like more of a denominator issue than a numerator issue. Actual expenditures aren’t decreasing (much) but the economy is growing, in part due to population growth, which isn’t really happening in the same way in Europe.
There is a difference between the US and Canada, though. And that is where the decline is coming from. In the US, it is coming (mostly) from lower private-sector contributions, the result of a decade or more of tuition restraint. In Canada, it is coming from much lower public spending. Figure 3 shows change in public spending as a percentage of GDP since 2005.
Figure 3: Change in Public Expenditure on Tertiary Institutions as a Percentage of GDP since 2005, Select OECD Countries, 2006-2022
As you can see here, few countries are very far from where they started in terms of spending as a percentage of GDP per capita. Australia and Sweden are both down a couple of tenths of a percentage point. Lucky Netherlands is up a couple of tenths of a percentage point (although note this is before the very large cutbacks imposed by the coalition government last year). But Canada? Canada is in a class all of its own, down 0.6% of GDP since just 2011. (Again, don’t take these numbers as gospel: on my own calculations I make the cut in public funding a little bit less than that – but still at least twice as big a fall as the next-worst country).
In sum: Canada’s levels of investment in higher education are going the wrong way, because governments of all stripes at both the federal and provincial level have thought that higher education is easily ignorable or not worth investing in. As a result, even though our population and economy are growing, universities and colleges are being told to keep operating like it’s 2011. The good news is that we have a cushion: we were starting from a pretty high base, and for many years we had international student dollars to keep us afloat. As a result, even after fifteen years of this nonsense, Canada’s levels of higher education investment still look pretty good in comparison to most countries. The bad news: now that the flow of international student dollars has been reduced, the ground is rising up awfully fast.
Things have been bleak in higher education the last couple of years, and no doubt they will remain bleak for a while. But it recently became clear to me how we’ll know that we are turning the corner: it will be the moment when provincial governments start allowing significant rises in domestic tuition.
This became clear to me when I was having a discussion with a senior provincial official (in a province I shall not name) about tuition. I was arguing that with provincial budgets flat and declining international enrolment, domestic tuition needed to increase – and that there was plenty of room to do so given the affordability trends of the last couple of decades.
What affordability trends, you ask? I’m glad you asked. Affordability is a ratio where the cost of a good or service is the numerator and some measure of ability to pay is the denominator. So, let’s look at what it takes to pay average tuition and fees. Figure 1 shows average tuition as a percentage of the median income of couple families and lone-parent families aged 45-54. As you can see, for the average two-couple household, average tuition (which – recall last Wednesday’s blog – is an overestimate for most students) has never been more affordable in the twenty-first century. For lone-parent families, current levels of tuition are at a twenty-year low.
Figure 1: Average Undergraduate Tuition and Fees as a Percentage of Median Family Income, Couple Family and Lone-Parent Families aged 45-54, Canada, 2000-2024
Ah, you say, but that’s tuition as a function of parental ability-to-pay – what about students? Well, it’s basically the same story – calculated as a percentage of the average student wage, tuition has not been this cheap since the turn of the century, and in Ontario, it has dropped by 27% since 2017. And yes, the national story is to a large degree a function of what’s been going on in Ontario, but over the past decade or so, this ratio has been declining in all provinces except Manitoba, Saskatchewan and Alberta.
Figure 2: Number of Hours Worked at Median Hourly Income for Canadians Aged 15-24 Required to pay Average Undergraduate Tuition and Fees, Canada and Ontario, 1997-2024
And that’s before we even touch the issue of student aid, which as you all know is way up this century even after we take student population growth into account. In real dollars, we’ve gone from a $10B/year student aid system to a $20B/year system with the vast majority of growth coming on the non-repayable side, rather than from loans.
Figure 3: Total Student Financial Assistance by Type, Selected years, 1993-94 to 2023-2024, in Millions, in $2023
In fact, student aid expenditures are so high nowadays that across both universities and colleges we spend about $3 billion more in student aid than we take in from tuition fees. That’s NEGATIVE NET TUITION, PEOPLE.
Figure 4: Aggregate Non-Repayable Aid vs Aggregate Domestic Tuition fees, 2007-08 to 2023-24, in Billions, in $2023
So, yeah, affordability trends. They are much more favorable to students than most people think.
Anyway, the provincial official seemed a bit nonplussed by my reply: my sense is that they had never been briefed on the degree to which tuition increases have been thrown into reverse these past few years, and he certainly didn’t know about the huge increase in non-repayable aid over the past few decades. They didn’t push back on any of this evidence, BUT, they insisted, tuition fees weren’t going up because doing so ishard and it’sunpopular.
To which I responded: well, sure. But was raising tuition any easier or less unpopular in 1989 when the Quebec Liberal government more than doubled tuition? Than in the mid-90s when both the NDP and Conservative governments allowed tuition to rise? Than in 2001 when the BC Liberals allowed tuition to increase by 50%? This has been done before. There’s absolutely no reason it can’t be done again. The only thing it will take is the courage to put the requirements of institutions that actually build economies and societies ahead of the cheap, short-term sugar highs of chasing things like “affordability”.
Now, to be fair, I don’t for the moment see any provincial governments prepared to do this. If there is one thing that seems to unite provincial governments these days, it is an inability to make hard decisions. But this particular political moment won’t last forever. It might take a serious, long-term recession to knock it into various heads that no matter how much money we sink into them, natural resources and construction alone won’t run this economy. Eventually, we’re going to have to re-build the great college and university system we’re in the middle of trashing.
And we’ll know that moment has come when provincial governments agree that domestic tuition should rise again.
For most of the past 30 or so years, big Canadian universities have all been working off more or less the same business model: find areas where you can make big profits and use those profits to make yourself more research-intensive.
That’s it. That’s the whole model.
International students? Big profit centres. Professional programs? You better believe those are money-makers. Undergraduate studies – well, they might not make that much money in toto but holy moly first-year students are taken advantage of quite hideously to subsidize other activities, most notably research-intensity.
Just to be clear, when I talk about “research-intensity”, I am not really talking about laboratories or physical infrastructure. I am talking about the entire financial superstructure that allows profs to teach 2 courses per semester and to be paid at rates which are comparable to those at (generally better-funded) large public research universities in the US. It’s about compensation, staffing complements, the whole shebang – everything that allows our institutions to compete internationally for research talent. Governments don’t pay enough, directly, for institutions to do that. So, universities have found ways to offer new products, or re-arrange the products they offer, in such a way as to support these goals of competitive hiring.
Small universities do not have quite the same imperatives with respect to research, but this business model affects them nonetheless. To the extent that they wish to compete for staff with the research-intensive institutions, they have to pay higher salaries as well. Maybe the most extreme outcome of that arms race occurred at Laurentian, whose financial collapse was at least in part due to the university implicitly trying to align itself to U15 universities’ pay scales rather than, say, the pay scale at Lakehead (unions, which like to write ambitious pay “comparables” into institutional collective agreements, are obviously also a factor here).
Anyways, the issue is that for one reason or another, governments have been chipping away at these various sources of profit that have been used to cross-subsidize research-intensity. The situation with international students is an obvious one, but this is happening in other ways too. Professional master’s degrees are not generating the returns they used to as private universities, both foreign and domestic, begin to compete, particularly in the business sector. (A non-trivial part of the reason that Queen’s found itself in financial difficulty last year was because its business school didn’t turn a profit for the first time in years. I don’t know the ins and outs of this, but I would be surprised if Northeastern’s aggressive push into Toronto wasn’t eating some of its executive education business).
Provincial governments – some of them, anyway – are also setting up colleges to compete with universities in a number of areas for undergraduate students. In Ontario, that has been going on for 20-25 years, but in other places like Nova Scotia it is just beginning. Some on the university side complain about these programs, primarily in polytechnics, being preferred by government because they are “cheap”, but they rarely get into specifics about quality. One reason college programs are often better on a per-dollar measure? The colleges aren’t building in a surplus to pay for research-intensity – this is precisely what allows them to do revolutionary things like not stuffing 300 first-year students in a single classroom.
In brief then: the feds have taken away a huge source of cross-subsidy. Provinces, to varying degrees (most prominently in Ontario), have been introducing competition to chip-away at other sources of surplus that allowed universities to cross-subsidize research intensity. Together, these two processes are putting the long-standing business model of big Canadian universities at risk.
The whole issue of cross-subsidization raises two policy questions which are not often discussed in polite company – in Canada, at least. The first has to do with cross-subsidization and whether it is the correct policy or not. I suspect there is a strong majority among higher education’s interested public that think it probably is a good policy; we just don’t know for sure because the policy emerged, as so many Canadian policies do, through a process of extreme passive-aggressiveness. Institutions were mad at governments for not directly funding what they wanted to do, so they went off and did their own thing. Governments, grateful not to be harassed for money, said nothing, which institutions took for approval whereas in fact it was just (temporary) non-disapproval.
(I should add here – precisely because of all the passive-aggressiveness – it is not 100% clear to me the extent to which provincial governments understand the implications of introducing competition. When they allow new private or college degree programs, they likely think “we are improving options for students” not “I wonder how this might degrade the ability of institutions to conduct research”. And, of course, the reason they don’t think that is precisely because Canadians achieve everything through passive-aggression rather than open policy debates which might illuminate choices and trade-offs. Yay, us.)
The second policy question – which we really never ever raise – is whether or not research-intensity, as it is practiced in Canadian universities, is worth subsidizing in the first place. I know, you’re all reading that in shock and horror because what is a university if it is not about research? Well, that’s a pretty partial view, and historically, a pretty recent one. Even among the U15, there are several institutions whose commitment to being big research enterprises is less than 40 years old. And, of course, we already have plenty of universities (e.g. the Maple League) where research simply isn’t a focus – what’s to say the current balance of research-intensive to non-research-intensive universities is the correct one?
I am not, of course, advocating this as a course of policy. But given the way both the politics of research universities and the economics of their business models are heading, we might need to start discussing this stuff. Maybe even openly, for a change.
Cast your minds back to January of 2024, when the federal government suddenly decided that housing was an issue, international students were the problem and implemented a complicated and irritating-to-implement set of caps that were 35% lower nationally than for 2023 (and in Ontario significantly more than that). Then, in 2025 came another set of changes including a 10% cut in the national limit. And then, on top of that, a set of new conditions on post-graduate work visas were imposed which were specifically designed to depress demand for certain types of education.
To the extent that the world outside post-secondary education absorbed this news and didn’t dismiss it outright because Ontario colleges in particular “deserved it” for pouring gasoline onto a housing shortage bonfire, the reaction to all this was: “boy, losing nearly half your international students is really going to lead to a financial pinch”. But this reaction was wrong in two ways. First, that 50-percent was an average – in most cases, institutions either saw drops that were either significantly higher or significantly lower than that. Partly, this was because the federal government designed the cap drop to hit provinces unequally (Ontario to the max and Quebec not at all, for instance) and part of it had to do with the fact that some provinces distributed the cap hit in some peculiar ways (see back here for an earlier blog on this).
But second, and most importantly, not many institutions actually even met these significantly-lowered quotas. Talk to folks in institutions these days and they will tell you that it’s not that the caps are too low, but that demand for Canadian post-secondary has simply dried up: no one wants to come to Canada anymore. I believe this. Former Immigration Minister Marc Miller did a serious number on the reputation of Canada’s post-secondary. If you go around accusing institutions of fraud and deceit and imposing clampdowns on student visas (it wasn’t just the caps – visa processing times are up and visa refusal rates are rising too), foreign students might get the idea that the country doesn’t want them, and so they never apply in the first place. I am sure Marc Miller would deny ever wanting to dry up demand, but it is exactly what his ham-fisted, Attila-the-Hun in a China shop approach to student visas managed to achieve.
(And still, so many bien-pensant people think Liberals are the good guys on higher education. Or think more federal involvement in the higher education file would be a good thing. God Save Us All.)
Anyways, as a result of this, universities and colleges are in a funk and wondering if and when international students will come back and (partially) save their bacon, financially speaking. But what is shocking, to me at least, is how unbelievably passive the sector is. They are waiting for students to come. Just waiting. ‘Why don’t they come?’ people ask. ‘It’s that darn Marc Miller! Nothing we can do about it’.
You see the problem with the international student industry in Canada is that institutions themselves never grew an overseas recruitment game the way UK and Australian institutions did. By the time Canadian institutions started thinking about the whole international-students-as-revenue thing, the feds had already created the student-to-permanent immigration pathway via our post-graduate work visas and the like. And then, when things got hotter, aggregators like ApplyBoardcame along and made it so easy to attract students that a lot of Canadian institutions just never upped their ground game on student recruitment.
You see, despite Canadian institutions’ tendency to congratulate themselves on their “international outlook” and their ability to attract international students, very few of them ever bothered to go deep either on recruitment tactics (spending time abroad, juicing the recruitment pipeline) or on paying attention to the international student experience on campus. Some did, of course, but I can count the number who would be considered on par with the top institutions in the anglosphere on one hand.
When it comes to internationalization, Canada is the kid who was born on third base and thinks they hit a triple. So many unearned advantages. And so, when Attila-the-Minister came along and took away most of those unearned advantages, people did not know what to do. The simple answer – UP YOUR GROUND GAME IN A FEW KEY TARGET MARKETS FOR GOD’S SAKE – seems not to have been considered very widely.
I suspect one of the reasons for this is a deeply unsexy one: internal funding formulas for non-academic units. You see, under the enshittification model that is widely prevalent in Canadian institutions (more so in universities than colleges, but the latter aren’t immune from it), when a budget crunch happens, everyone needs to cut back. And so, international units, far from being given more money to go fight for students in overseas markets, sometimes have to scale back their activities (or at least not increase them as they should). The idea that it takes money to make money does not fit easily with a budget model that bases this year’s budget on what you got last year plus or minus a percentage point or two.
This is bananas, of course. Self-destructive, even. But even if you gave international offices more money, they wouldn’t necessarily know how to spend it. The born-on-third-base thing meant we never needed to fight that hard for international students – they just kind of showed up. The situation Canadian institutions are in right now requires a lot more bodies on the ground overseas, understanding individual city markets, developing relationships with schools and agents, and attending more fairs, in more cities and more countries. This is how Australia and the UK developed their international markets. We managed to skip a lot of that in the ‘10s. We are going to have to learn it now.
The shock, pain and impact of both the visa caps and Marc Miller setting fire to the country’s reputation are all real. Never forgive, never forget (but also: never again wish for the federal government to be more active in post-secondary education). But institutions are not without agency here. My feeling is that in too many cases they are just throwing up their hands, either because they prefer not to spend on recruitment or are insufficiently skilled at doing so in the absence of a cuddly national image or an absurdly favorable visa system.
You want markets? Invest in them. Fight for them. If Canadian post-secondary education is as good as everyone claims it is, students will come. Passiveness helps no one.
Monday, we looked at the country’s overall financial situation (dire), and yesterday we looked at how cuts of a magnitude of 15% might affect key programs like the Canada Education Savings Program and the Canada Student Financial Assistance Program. Today, we’re going to look at how a 15% cut might affect the Government of Canada’s research subsidies, which in the main are run through the Ministry of innovation, Science and Economic Development (ISED).
(I will be speaking about “the tri-councils” as a single funding line; I am aware that the Canadian Institute for Health Research (CIHR) is funded through Health Canada but for this exercise it is easier just to lump them together).
Let’s start by acknowledging that ISED is a sprawling mess of a department with small programs with very little political protection littered all over the place. I wouldn’t bet the farm on the $12 million “Futurpreneur Canada” making it out of this budget round alive. I also doubt the Universal Broadband Fund is going to continue at $900 million per year. Computers for Schools (sounded great in the 90s, less so now) and Computers for Schools Interns would also be on my endangered list. I suspect that the various regional development funds might be in for an outsized hit as well. All of which is to say that it is possible that the research enterprise – that is, the tri-Councils, the National Research Council (NRC), the Canada Foundation for Innovation (CFI) and all those organizations that get part or all their money through the Strategic Science Fund – might not get hit with a 15% cut. It’s quite possible all these other areas might take an outsized hit and allow the actual science stuff to get off with a lighter cut.
That said, remember this key point: the budget exercise is not about cutting 15% of funding from where it should theoretically be in three years’ time (the government has a fiscal framework that extends out four or five years). It is about cutting expenditures from a 2024-25 baseline. That means that to get through any previously planned increase in spending, the cuts to existing programs must be more than 15%.
This matters for two reasons. First, it is because the government runs its subsidies to electric vehicles manufacturers through ISED. Those subsidies were worth $39M in 2024-25; they were planned to cost $2.1 billion this year and $4.2 billion in 2027-28 (i.e. it’s about half the department’s direct budget spend come two years from now, and about a third of total sci/tech spend if you include the tri-councils). To accommodate that increase while following the letter of the budget reduction request would basically mean requiring the entire department to shut down. That’s probably not happening (though one presumes that Carney’s announcement last week releasing Canadian auto manufacturers from their 20% EV sales target in 2026 might also lead to a reduction in EV subsidies to manufacturers).
Second, remember budget 2024? The one where the Liberals promised $1.8 billion in new spending on research and the whole sector cheered with relief? Yeah, well only $75 million went into the budget framework for 2024-25; 87% of that 1.8 billion is backloaded until after spring 2026. So, basically none of it is protected, and it’s all at risk. I wouldn’t be surprised in the least if they just cancelled the whole thing. And then, on top of that, we must worry about what happens to existing programs, and whether they take a 15% hit.
CIHR transfers about $1.2 billion to Canadian post-secondary institutes each year, while the National Science and Engineering Research Council (NSERC) transfers about $1 billion, and the Social Sciences and Humanities Research Council (SSHRC) transfers about $440 million (although a fair bit of that last one includes combined tri-council projects which administratively run through SSHRC, including – if I am not mistaken – funding for the Canada First Research Excellence Fund). CFI is another $550 million a year or so. NRC is about $1.7 billion per year. The Strategic Science Fund is another $900 million or so, closer to a billion if you include base funding for Genome Canada. Canada Research Chairs are another $300 million. Call it $6.2 billion in total. Required savings to get to a 15% cut is therefore just under $1 billion.
Where to start?
Ask most researchers at universities what they would prefer, and the answer is likely that they would eliminate everything except the tri-council funding. Ditch CFI, significantly cut NRC, definitely obliterate the Strategic Science Fund – anything, anything, anything but touch tri-Council grants. I understand the preference, but as I noted last week, this is a monumentally detrimental position for the sector to take. Yes, basic research and the existing grant system are the basis of the existing tenure and promotion system, and as such is naturally dear to those in the system, but almost no one in Ottawa thinks that’s what these systems are for. If we’re going to keep research funding afloat, it’s probably going to be through more spending on things like the Strategic Science Fund.
I have very little insight into the state of official Ottawa’s current thinking on the relative value of these various programs, but I could imagine three basic scenarios that get us to $1 billion in savings.
Option 1 is a straight 15% cut across the board. Take out $400 million or so from the granting councils, $80 million from CFI, $250 million from NRC, cut the Strategic Science Fund and Genome Canada to the tune of $150 million or so, and lose about 350 Canada Research Chairs.
Option 2 would be the spare the professors approach. Now, you probably can’t spare them entirely, because they are such a big proportion of the overall expenditure, but if you jacked up the cuts to CFI, NRC and Strategic Science to say 25%, you could hold the losses to CRCs and the tri-councils to under $100M. I think this is unlikely, but it is a possible scenario.
Option 3 would be the hammer the tri-councils approach. Because, as I said, I don’t think they are particularly well-liked at Finance/PMO. This is close to the inverse of option 2; zero cuts to NRC and Strategic Science, keep the CFI cut at 15% and take the rest of the necessary money out of the tri-councils. That would mean a cut of about $800 million or about 30% to council funding.
And remember, all of this is on top of walking back the measures announced in the 2024 Budget. Ugly doesn’t even begin to cover it.
To be clear: I suspect it is unlikely that the research area will get a cut of 15%, in part because officials will feel bad about doing serious damage to existing budgets after, I suspect, already taking away the Budget 2024 measures. If I had to guess, I would say that the department will probably come down hardest on regional development subsidies. Nevertheless, the scenarios above are possible even if not probable. Universities should start thinking about what they might mean and how they might cope.
Yesterday, I explained why the federal government now finds itself in a position where it has to cut program budgets by at least 15% just to keep the budget deficit to $50 billion by 2028. Today, I am going to explain how this will play out at Employment and Social Development Canada (ESDC), which plays a major role in funding for skills and education in Canada, mainly through the Canada Education Savings Program (CESP) and the Canada Student Financial Assistance Program (CSFAP).
Now, just a note at the start. It is vanishingly unlikely that the feds will actually look for 15% savings in every program. The 15% rule is for the Department as a whole, and ESDC is one big mother of a department. It includes all sorts of programs including EI (which in theory is exempt from cuts), and child care.
So, let’s start with CESP, which delivers about a billion dollars a year via matching grants to parents saving for their kids’ education via Registered Education Savings Plans (RESPs). This program doesn’t allow for a lot of nuance in cutting. The program gives out about $1.1 billion a year in Canada Education Savings Grants (CESGs), roughly 85% of which goes on a basic 20 cent-to the dollar match rate and about 15% of which goes to “additional” (i.e. higher) matching rates for lower-income Canadians (A-CESGs). It also runs the Canada Learning Bond Program, which is another roughly $150 million per year which is a non-matching grant of up to $2000 to children from low-income backgrounds to start their educational savings.
There are basically four options here:
1)The government could cut program spending across the board by 15%. That is, it could lower the base CESG matching rate from 20% to 17%, and A-CESG payment rates for lower income contributors to 26.5% and 34% from the current 30% and 40%. That would save about $150 million/year. It could also reduce the CLB payout to $1700.
2)The government couldeliminate the A-CESG pieces entirely and go with a flat 20% coverage. That’s a pretty quick way to a 15% reduction.
3)The government could axe the CLB. Again, a very quick way to get close to 15% reduction.
4)The government could hold the A-CESG and CLB harmless and reduce the CESG base rate even further, to about 15%.
Now, personally, I think CESG probably comes out of this unscathed – that is, a 0% cut – because it’s one of the most popular government programs in existence. But these options give you a sense of what cuts might be, if applied uniformly across the department.
(Yes, there are also presumably some savings to be made on the personnel side, but it’s a pretty simple and lean program – if you could get savings equal to even 0.5% of total expenditures from that, I’d be shocked).
Let’s now head over to CSFAP spending and see how that might fare. It’s a bit more complex than CESG so it’s worth looking at its basic cost-structure. Using data from the CSFAP’s 2023 Actuarial report, it’s possible to look at overall direct program costs, as shown below in Figure 1. Technically, this is not a full state of program costs because there’s another billion or so in “alternative payments” to jurisdictions that do not participate in the CSFAP (i.e. Quebec, Nunavut and the NWT). But since this sum is calculated as a fraction of direct programs, we can more or less ignore them here – a 15% cut of the direct costs automatically translates through to a 15% cut in alternative payments as well. And our target number – given that CSFAP direct expenses are about $4.2 billion – would be about $628 million.
Figure 1: Major areas of CSFAP spending, in millions, 2023-24
So where do you carve out that much money from CSLP? Well for starters we could and should get rid of the $429 million we spent eliminating interest on loans after graduation. These subsidies do nothing for access; rather, they boost the incomes of middle-class 20–30-year-olds who have already finished school. And it is not a long-standing program. It is, in fact, a quite recent thing, announced by then-finance minister Chrystia Freeland in 2023 when the Liberals were desperately trying to throw a bone to house-poor urban twenty-somethings who at the time were threatening to vote not-Liberal. Now cutting this wouldn’t be a straight $429 million savings – loss of that subsidy would likely lead to increases in bad debt and Repayment Assistance program (RAP) charges somewhat. So, let’s call that a $350M win.
Where to find the other $275 million? Not administration: most of the admin money is tied up in payments to provinces for running the front end of the program or to the National Student Loans Service Centre (an outsourced agency which resides over by Square One in Mississauga for running the back end), neither of which can easily be changed in the short term. Maybe you could lose a couple of million in staff costs but not much more. Very little you can do about bad debts either. RAP and interest subsidies before consolidation could be made less generous. In particular, the income threshold for access to RAP could be brought back down from the current $45K (roughly – it depends on family size) to say $38K, and interest during school could be brought up from zero to the current inflation rate or the government rate of borrowing (i.e. somewhere between 2 and 2.5%). I don’t have access to detailed financial figures on this, but my guess is that the RAP measure might save $50M or so; in-school interest might get you $100M.
That still doesn’t quite get us to the required $625 million, so the only option left here is to start hacking away at grants. A straight cut in the maximum grant would be the easiest way to cut costs; bringing that down from $4200/year to, say, $3500/year would reduce spending by something along the lines of $400M/year. Another and more likely option would be for the feds to copy what Doug Ford did when he wanted to contain student aid costs – change grant eligibility criteria in such a way as to make grants harder to obtain. The obvious way to do this, I think, would be to change the rules for dependent/independent student status (i.e. the point at which students are considered to no longer get money from their parents) so that it took students five years to reach such independent status instead of four. I am not exactly sure how much that would save, but I’d wager it would be a minimum of a quarter-billion.
So, your menu of cut options for cutting CSFAP is, essentially:
Bring back interest after graduation
$350 million
Admin
$3-5 million
Reduce RAP threshold to $38K
$50 million
Introduce in-school interest of 2.5%
$100 million
Cut maximum grants by $700/year
$400/million
Change definition of independent student
$250 million
(To be clear here, I am guessing a bit on some of these numbers. Intelligently, I hope, but they are guesses. Don’t take the numbers here as gospel. And if any friends at CSLP want to correct me, please do!)
If it were me, to get to (roughly) the required $625 million I’d bring back interest after graduation – or introduce an equal-to-government-rate-of-borrowing interest rate for the entire life of the loan, which probably ends up with similar savings – and change the definition of independent students. Neither are pleasant but these are the ones that would probably affect access the least.
(Again, the Liberals may choose not to cut anything in CSFAP, because hey this is an income security program of a sort, and if we’re obsessing about “affordability” – but that just means cuts elsewhere in the portfolio will be larger).
Of course, ESDC is much more than these two programs. Take a gander at the full list of programs the programs the Ministry runs (I make it about fifty if you include everything). A lot of those are scattered skills initiatives like Youth Employment and Skills, Indigenous Skills and Employment Training, the Skills and Partnership Fund, Skills for Success Program, the Innovative Work-integrated Learning Initiative. I have no idea what most of these do exactly, nor is it easy to access any budget data about them. But let’s put it this way – few of these programs have a particularly large policy constituency to back them up. My guess is that cuts across these programs will be significantly higher than 15% and some of them may cease to exist altogether.
Enough for today. Tomorrow we’ll do research funding.
The biggest thing everyone is going to be talking about this year – barring another university doing a surprise Laurentian – is the set of federal cuts coming down the pike. They are big. And they are nasty. So, it’s worth understanding exactly the scale of what is heading in our direction. This is going to be a three-parter. Today, I will talk about the overall size of the cuts to come, and on Tuesday and Wednesday I will talk about how this will affect the two ministries that have the most to do with post-secondary education: Employment and Skills Development Canada (ESDC, tomorrow) and Innovation, Science and Economic Development Canada (ISED, Wednesday).
So: we don’t know the exact scope of the budget cuts the government is contemplating. What we do know is the following:
Preliminary budget figures for Fiscal 2024-25 show that the government of Canada posted a budget deficit of $43.2 billion on revenues of $495B, program expenses of $480B, debt charges (that is, interest on existing debt) of $54B and actuarial losses of $4B. We didn’t have a budget this spring, but spending projections for 25-26 from the 2024-25 budget show a projected deficit of $39 billion on revenues of $515B, program expenses of $496B, debt charges of $55B and actuarial losses of $2B.
The Liberal Manifesto for election 2025 planned deficits of $60 billion or so right through to 2028-29. Its fiscal plan was basically i) existing spending commitments, ii) 30-odd billion in new spending and tax cuts and iii) tiny revenue changes, plus $20 Billion or so in counter-tariffs for 2025-26. (Yes, they also promised “savings from increased productivity” – otherwise known as “frantic handwaving” – of $6B, $9B and $13B in fiscal years ’27, ’28 and ’29. I am excluding them here but will return to them in a sec).
Figure 1: Government of Canada fiscal picture according to the Liberal manifesto, minus the handwaving, in Billions.
(The foregoing might all sound strange to those of you who recall Carney making pledges about balanced budgets. But, of course, as I pointed out back here, he never actually promised that. He promised balanced operating budgets, that is budgets with an only vaguely defined “capital spending” netted out. By a complete coincidence, the Liberal platform claimed the government spent roughly $50 billion in capital, so basically the government is already basically in balance. Neat trick, but not sure bondholders will see it that way. I digress.)
Since the election, a few things have happened. Counter-tariffs are not collecting anything like the $20 billion forecast, we ditched the Digital Services Tax in a futile attempt to get the Americans to be nicer to us, and, most importantly of all, the prime minister promised to up defense spending by about $18 billion over the next four years in order to reach 2% of GDP by 2028. That means the actual fiscal picture, before any handwaving about savings, looks like this:
Figure 2: Government of Canada fiscal picture, according to the Liberal Manifesto, minus the handwaving, including proposed spending and tariffs since April 28, in Billions.
As you can see, we are a lot further away today from “operating balance” (i.e. a $50B deficit) than we were when Carney was elected. And this is where the handwaving/cuts come into play. So, let’s start thinking about how much money it would take to keep us at “operating balance”. In Figure 3, we see that by 2028-29, we are looking at about $32 Billion in cuts. The handwaving “efficiencies” in the Liberal manifesto were meant to cover just $13 billion of that, leaving another $19.2 billion or so to be made up, somewhere, somehow.
Figure 3: Cuts Required Just to Keep the Government of Canada at Operating Balance (i.e. a $50B deficit), By Source, in Billions.
I said “somewhere”, but there isn’t much mystery here. As Figure 4 shows, you divide government spending into four categories: debt charges (which the government has to pay regardless), transfers to provinces (which Carney has promised he won’t touch), transfers to individuals (ditto) and then “program spending”. As Figure 4 shows, the first three areas make up 58% of total spending. That means that the last area, program spending, is going to take up the entirety of these cuts. In 2025-26, program spending is estimated at $227 billion; a $32 billion cut to that equals an overall reduction in program spending of 14% by 2028. (Coincidentally, this was more or less exactly the size of the program cuts in the “savage” 1995 budget – $7 billion phased in over three years on a base budget of about $52 billion. Government grew back, as you can see.)
Figure 4: Government of Canada Expenditures by Category, 2025-26
It’s worth being careful here. Overall program spending is $227 billion, but $46 billion of that is currently being spent on defense and housing, two areas that are almost certainly immune to cuts given the government’s overall priorities. Excluding these two fields from cuts means that the field of “cuttable” programs shrinks to $181 billion, and the size of the cuts required to meet the $50 billion target balloons to 17.7%.
This brings us to the program review that has been going on in Ottawa since July. Recall that Minsters were asked to bring forward scenarios that involved cuts of 7.5% for next year, 10% the year after that and 15% the year after that. Many thought initially that these numbers were deliberately overdone so that big cuts could be made in some departments so as to shield other departments from having to do the same. Now I am not so sure. That 15% target is awfully close to the 17% overall target the Liberals need to hit just to keep the deficit at $50 billion, and so I am starting to think that in fact the cuts might not be dispersed unequally between departments. They might really need 15% from everybody – and then some.
There are a couple of alternatives of course that could lessen the blow. For instance, while Carney promised not to cut transfers to provinces, to my knowledge he never ruled out cutting the rate of growth of transfer payments (currently about 5% per year, across CHT, CST and equalization combined). Slash that in half and you’ve got yourself another $8 billion to play with by 2028, thereby reducing by a quarter the required amount of program cuts. Something similar could be achieved by de-indexing pensions for a couple of years. Or, unlikely as it seems, the Government could actually increase taxes (elbows up requires some sacrifices, no?). But, absent those measures, I think we need to seriously brace for impact. These cuts are real, they are huge, and even if they don’t hit this fall (it’s not impossible that the alleged fall budget might actually just be the usual fall economic statement under another name), they are for sure going to hit in early 2026.
The question, really, is, what needs to be saved? What should the sectors’ priorities be? I’ll discuss that over the next two days.


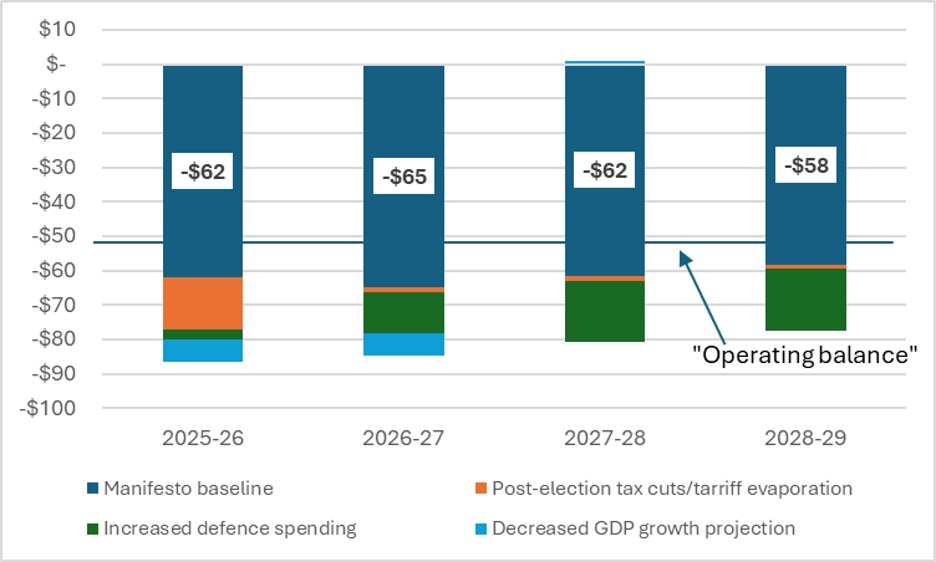
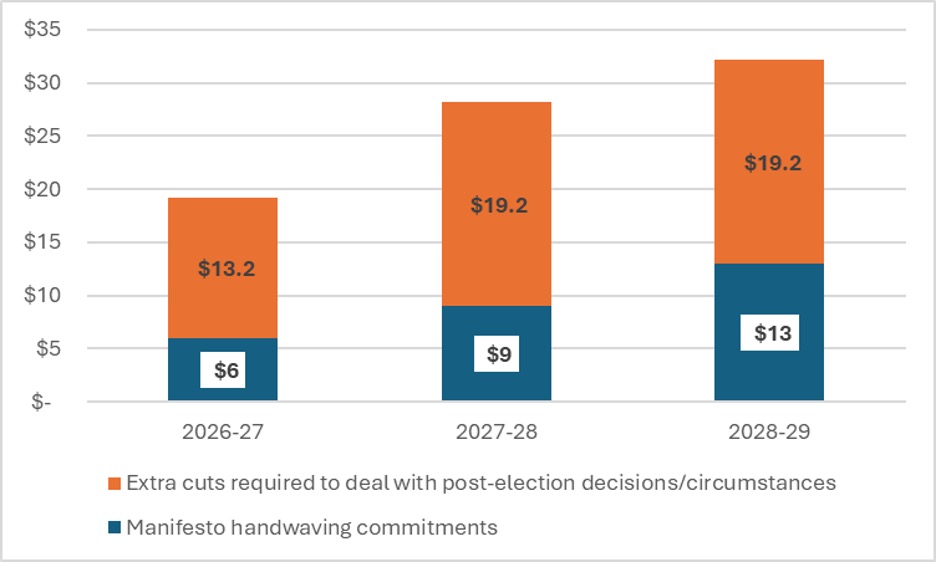
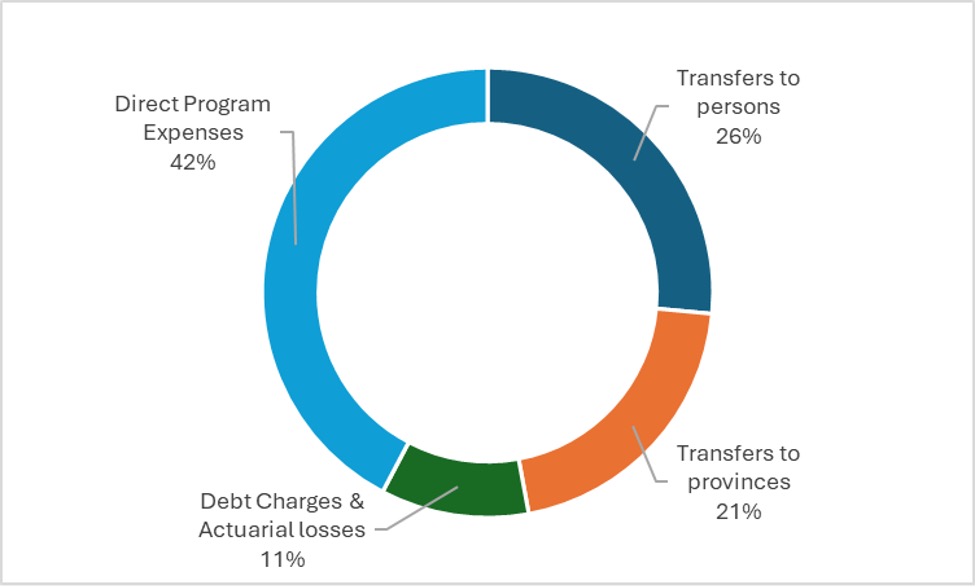
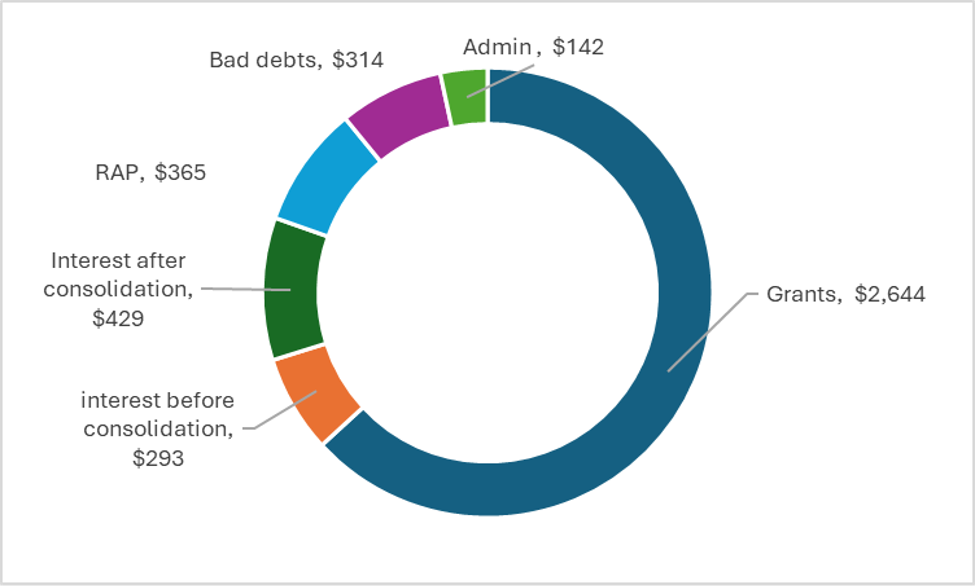
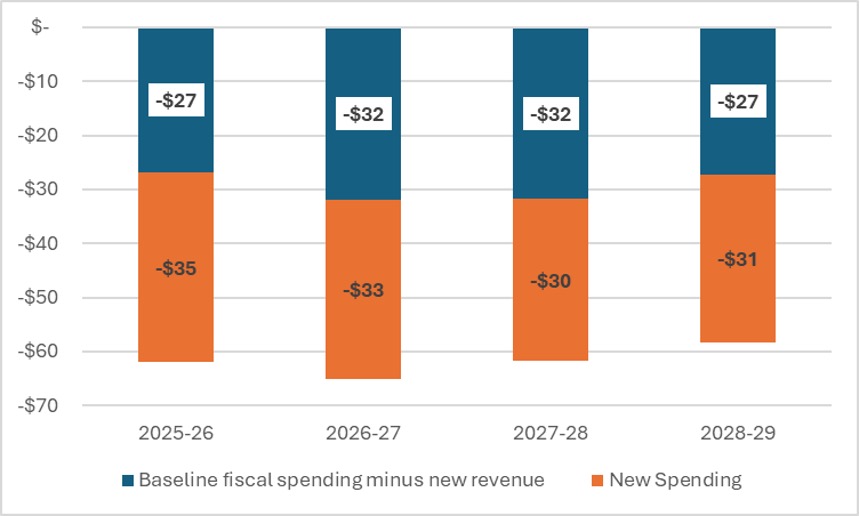