Category: graduate outcomes

  • Side hustles, moonlighting, resting actors, and multiple jobholding in creative work

    Side hustles, moonlighting, resting actors, and multiple jobholding in creative work

    How do creatives sustain their careers?

    We used large UK datasets to map how careers work in creative occupations, showing how having a second job is twice as prevalent in key creative jobs than occupations; mixing creative and non-creative jobs is normal, especially outside London; and having a non-creative main job and a creative “side hustle” rarely leads to a single full-time creative job.

    Having multiple jobs isn’t a stepping-stone into full-time creative work. It is how creatives sustain their careers.

    Who has two jobs?

    We used the UK Labour Force Survey (2015–2021) to look at occupational and social patterns, and Understanding Society (2011–2019) for longitudinal transitions. We used the DCMS definition of creative occupations, rather than industries (so graphic designers working in retail are in, accountants working in theatres are out). We also developed a typology of multiple jobholding: portfolio (both jobs creative); main creative (creative main job plus a non-creative second job); side creative (non-creative main job plus a creative second job).

    We found that having a second job is almost twice as common for core creative workers, (arts/culture production such as music, performance, visual arts, publishing, museums/libraries, film/TV/photo) compared to the rest of the workforce (6.8 per cent, against 3.5 per cent) but less common (3.2 per cent) for non-core creative jobs (advertising, architecture, crafts, design, IT). Some roles are extreme outliers, with relatively high proportions of actors (14 per cent) and musicians (12.8 per cent) having second jobs.

    These proportions are higher than the general workforce, but they are also lower than popular discourse might suggest. This might be explained by how the data is collected (both jobs need to have been worked at during the same, specified, week). Even with this note of caution, the demographic patterns of multiple jobholding, and changes over time, give important insights into creative careers.

    The type of second job held by people whose first job is creative is important. For those with second jobs, 38 per cent of those jobs are in other core creative occupations- true “portfolio” work. A further 27.5 per cent of those jobs are professional but non-creative roles, especially teaching and corporate training. And 25.5 per cent are non-creative, non-professional roles, for example retail, hospitality and admin roles.

    Even more notable was the size of the core creative workforce whose creative occupation was a second job: there are far more people with a non-creative first job and core creative second job (about 113,000 per year) than there are core creatives with a second job (about 54,000 per year). In other words, where people have two jobs, creative work is more often the add-on rather than the main job.

    What other characteristics have an impact?

    Our analysis compared multiple jobholders to creatives with a single job, and found that combining creative and non-creative work is significantly more likely outside London. Outside the capital, sustaining a purely creative main job looks harder, and mixing jobs is more common.

    Portfolio workers are more likely to be graduates and to come from non-middle class backgrounds than are single-job creatives. Side creatives are much more likely to be employees (rather than self-employed) in their main job, suggesting that it is more about balancing income volatility than it is about enjoying the freedom of self-employment. However, main creatives are less likely to be employees—reflecting the prevalence of self-employment in core creative roles. And side creatives are more likely to be men.

    Part-time work signals both constraint and choice: creatives in multiple jobs are more likely to work part-time because they couldn’t find full-time work—but also more likely to say they didn’t want full-time, suggesting both labour market scarcity and preferences are in play.

    Covid changed things, but did not totally overturn these patterns. In 2021 the share of workers making their living only from creative jobs fell, while main and side creative patterns increased—consistent with pandemic disruption pushing creatives to diversify.

    Does a creative side-job turn into a creative main job?

    After one year, portfolio and main creatives are somewhat more likely to move to a single creative job (45 per cent and 39 per cent, respectively) than to remain in their dual-job pattern (31 per cent and 36 per cent). Side creatives mostly remain side creatives – they rarely report a single creative job after a year. After three years, the pattern hardens: side creatives are still the least likely to have moved into a single creative job. Dual-jobholding looks like a strategy for persisting with a creative career rather than transitioning fully to a single creative job.

    Policymakers should understand that dual jobholding is an endemic and long-lasting feature of creative work. It needs to be incorporated into “good work” policies, rather than removed completely from the creative economy. It can be an important counterbalance to income volatility associated with creative projects.

    This research also has implications for one of the common measures of success for graduates, which specifies a good, skilled, full-time job. Creative occupations are counted as skilled, but the LFS analysis shows how difficult it is to find full time creative work, and that creative work is highly likely to be hidden behind primary employment in a less-skilled occupation. This means that in various places, including regulatory outcomes and league tables, there is a likelihood of positive outcomes for creative graduates being under-reported.

    At the same time, policy must address the inequalities associated with creatives and second jobs. For example, the chances of making a living solely from creative work outside London are substantially lower, and London-centric career pathways are unrealistic for many during a cost-of-living crisis.

    For many creatives, multiple jobholding isn’t a stepping stone on the way to a single steady role, it’s their actual career. It should not be understood as a failure to “achieve” a single creative job. It is a pragmatic but unequal employment pattern, which needs to be accounted for in industrial strategies.

    Source link

  • Why ideas of graduate success need to catch up with portfolio careers

    Why ideas of graduate success need to catch up with portfolio careers

    For many graduates in the creative industries, the question “what do you do?” has never had a simple answer.

    A graduate might be holding down part-time work in a gallery, freelancing in digital design, tutoring on the side, stage managing in the summer, and selling their own work online. It’s a patchwork, a blend, a portfolio.

    And yet when we measure their success through Graduate Outcomes, the official data collection exercise on graduate employment, they’re told to tick a single box. The reality of hybridity is flattened into the illusion of underemployment.

    This is not a trivial issue. Policymakers rely on Graduate Outcomes (and reports based on the collection, like this year’s What do graduates do? out today) to make judgements about which subjects, courses and institutions are “succeeding” in employability terms. Yet in the creative arts, where portfolio working is both the norm and, in many ways, a strength, these categories misrepresent lived reality. The result is a story told back to government, employers and students in which creative graduates appear more precarious, less stable, and less successful than they often are.

    Portfolio careers are current and they’re the future

    The creative economy has been pointing towards this future for years. In What Do Graduates Do? , the creative arts overview that Elli Whitefoot and I authored, we found repeated evidence of graduates combining multiple sources of income, employment, freelancing, self-employment, often in ways that nurtured both security and creativity. The forthcoming 2025 overview by Burtin and Halfin reinforces the same point: hybridity is a structural feature, not a marginal quirk.

    This hybridity is not inherently negative. Portfolio work can provide resilience, satisfaction and autonomy. As Sharland and Slesser argued in 2024, the future workforce needs creative thinkers who can move across boundaries. Portfolio careers develop precisely those capabilities. At the Advance HE Symposium earlier this year, I led a workshop on future-proofing creative graduates through AI, entrepreneurship and digital skills, all of which thrive in a portfolio setting.

    Policy writers and senior leaders need to wake up quickly to realise that creative graduates are early adopters of what more of the labour market is beginning to look like. Academic staff, for example, increasingly combine research grants, teaching roles, consultancy and side projects. Tech and green industries are also normalising project-based work, short-term contracts and hybrid roles. In other words, the creative industries are not an outlier; they are a preview.

    Why measurement matters

    If the data system is misaligned with reality, the consequences are serious. Universities risk being penalised in performance frameworks like TEF or in media rankings if their graduates’ outcomes are deemed “poor.” Students risk being discouraged from pursuing creative courses because outcomes data suggests they are less employable. Policymakers risk designing interventions based on a caricature rather than the real graduate experience.

    As Conroy and Firth highlight, employability education must learn from the present, and the present is messy, hybrid, and global. Yet our data systems remain stuck in a single-job paradigm.

    The wider sector context is equally pressing. Graduate vacancies have collapsed from around 180,000 in 2023 to just 55,000 this year, according to Reed. Almost seven in ten undergraduates are now working during term-time just to keep going according to the latest student academic experience survey. And international graduates face higher unemployment rates, around 11 per cent, compared with 3 per cent for UK PGT graduates. The labour market picture is not just challenging, it is distorted when portfolio working is coded as failure.

    Without intervention, this issue will persist. Not because creative graduates are difficult to track, but because our measurement tools are still based on outdated assumptions. It is therefore encouraging that HESA is taking steps to improve the Graduate Outcomes survey questionnaire through its cognitive testing exercise. I am currently working with HESA and Jisc to explore how we can better capture hybrid and portfolio careers. These efforts will help bridge the gap in understanding, but far more nuanced data is needed if we are to fully represent the complex and evolving realities of creative graduates.

    So what should change?

    Data collection needs to become more granular, capturing the combination of employment, self-employment, freelancing and further study rather than forcing graduates into a false hierarchy. Recognising hybridity would make Graduate Outcomes a more accurate reflection of real graduate lives.

    One complicating factor is that students who do not complete a creative programme, for example, those who transfer courses or graduate from non-creative disciplines but sustain a creative portfolio, are even less likely to record or recognise that work within Graduate Outcomes. Because it isn’t linked to their area of study, they rarely see it as a legitimate graduate destination, and valuable evidence of creative contribution goes uncounted.

    We also need to value more than salary. The “graduate premium” may be shrinking in monetary terms, but its non-monetary returns, civic participation, wellbeing, and resilience, are expanding. Research from Firth and Gratrick in BERA Bites identifies clear gaps in how universities support learners to develop and articulate these broader forms of employability.

    Evidence must also become richer and longer-term. The work of Prospects Luminate, AGCAS CITG and the Policy and Evidence Centre on skills mismatches shows that snapshot surveys are no longer sufficient. Graduates’ careers unfold over years, not months, and portfolio working often evolves into sustainable, fulfilling trajectories.

    Beyond the UK there are instructive examples of how others have rethought the link between learning and employability. None offers a perfect model for capturing the complexity of graduate working lives, but together they point the way. The Netherlands Validation of Prior Learning system recognises skills gained from outside formal education, Canada’s ELMLP platform connects education and earnings data to map real career pathways, and Denmarks register-based labour statistics explicitly track people holding more than one job. If the UK continues to rely on outdated, single-job measures, it risks being left behind.

    Beyond the creative industries

    This is not an argument limited to art schools or design faculties. The wider labour market is moving in the same direction. Skills-based hiring is on the rise, with employers in AI and green sectors already downplaying traditional degree requirements in favour of demonstrable competencies. Academic precarity is, in effect, a form of portfolio career. The idea of a single linear graduate role is increasingly a historical fiction.

    In this context, the creative industries offer higher education a lesson. They have been navigating portfolio realities for decades. Rather than treating this as a problem to be solved, policymakers could treat it as a model to be understood.

    The full beauty of graduate success

    When we collapse a graduate’s career into a single tick-box, we erase the full beauty of what they are building. We turn resilience into precarity, adaptability into instability, creativity into failure.

    If higher education is serious about employability, we need to update our measures to reflect reality. That means capturing hybridity, valuing breadth as well as salary, and designing policy that starts with the lived experiences of graduates rather than the convenience of categories.

    Portfolio careers are not the exception. They are the shape of things to come. And higher education, if it is to remain relevant, must learn how to see them clearly.

    Source link

  • Can there ever be a definitive graduate premium?

    Can there ever be a definitive graduate premium?

    The idea of a graduate premium is a central plank of the way the Westminster government justifies the level of tuition fees, the existence of maintenance loans, and the design of an increasingly punishing repayment system based on earnings.

    In essence we tell applicants that they will earn more on average, so they will pay more for the privilege of study.

    One policy question that urgently needs attention is whether the graduate premium in an expanding and diverse system is equal to the task of supporting increasingly onerous repayments – and how much (or how little) of this debt needs to be waived because of low graduate salaries in certain industries.

    We should not fall into the trap of equating low salaries with the “worth” of undergraduate study: however poorly we pay them we need the army of graduates that run the public sector, and even the industrial strategy admits that without the (infamously low pay) creative industries we may as well pack up the idea of civilisation and go home.

    But we do need to think about whether the system as a whole stacks up in periods like we have been living through – low wage growth overall and high interest rates. And at this point the graduate repayment (annual earnings) threshold isn’t far off the annualised minimum wage.

    The minimum

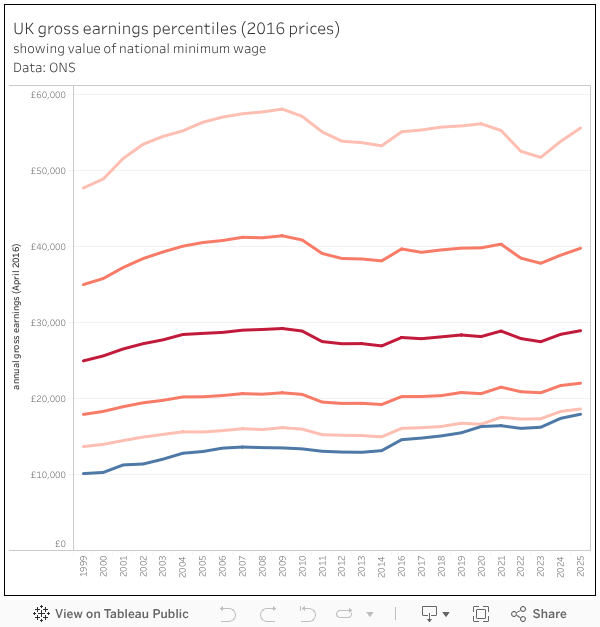
    The national minimum wage, since 1999, has set hourly lower limits on pay at various age points.

    Compliance is high among employers (though not complete: ONS estimates around 447,000 or 1.5 per cent of all jobs held by those aged 16 or over were paid below the relevant minimum wage). It has raised earnings among the very lowest paid in society.

    It has probably been the single most transformative means of addressing poverty in recent times: in most years since the minimum has risen beyond inflation – in real terms the value of the higher rate has increased by 77 per cent since it was introduced.

    [Full screen]

    Over a period where wages more generally have largely stagnated in real terms this is a remarkable uplift – and it is to the credit of governments of all stripes that this policy of direct and tangible improvements to low pay has continued through multiple economic downturns.

    But is it possible that a large increase in the earnings of the lowest decile will have an impact on the way we understand the earnings benefits that a degree could bring?

    Certainly if we plot the minimum wage against income percentiles (these are gross figures, at 2016 prices) it is notable how close its value has crept to the tenth percentile of income, suggesting that earnings at the lower end of the spectrum are now bunching at a higher real-terms level.

    [Full screen]

    The question has to be what, if any, impact this has on the graduate earnings premium and thus repayments.

    Low earners and graduates

    Currently around 10 per cent of those in employment are paid an hourly wage equivalent to the national minimum wage. If this rate of pay was linked to a full time role (eight hours a day for each of the 253 annual working days in England) it would make for annual earnings of around £24,700.

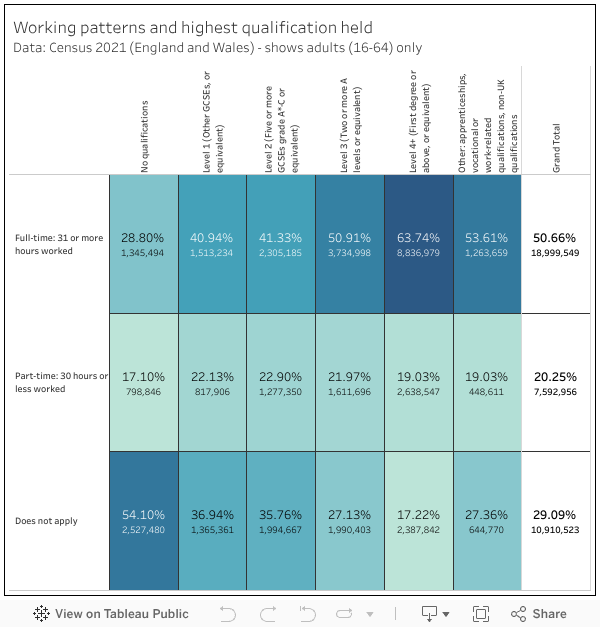
    However, workers on a low hourly wage are more likely to be on part-time hours, while we also know that the likelihood of you holding a full time job increases in line with the highest qualification you hold.

    [Full screen]

    The jobs involved are more likely to be elementary roles. In the main, jobs like this are primarily held by those with lower level qualifications, or no qualifications at all.

    [Full screen]

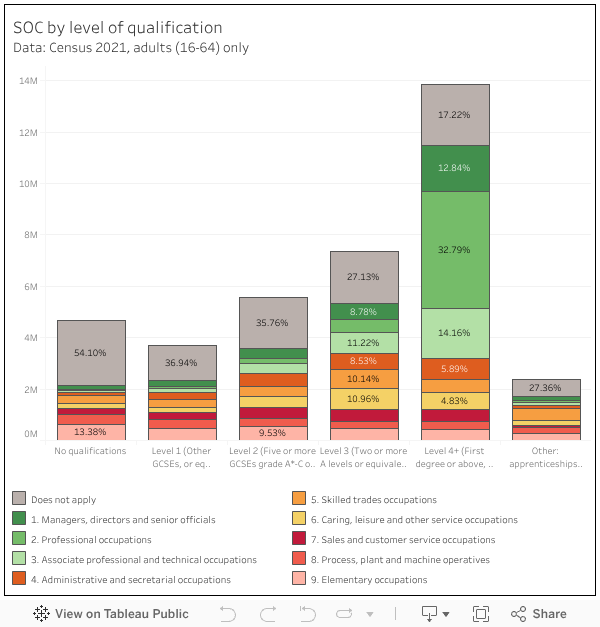
    Conversely, jobs done by graduates are far more likely to be full time, and are more likely to be managerial, professional, and associated professional roles – what the Office for Students calls “graduate jobs” than those with other levels of qualification. Around 60 per cent of graduates are in these roles, compared with around 27 per cent of those with level 3 qualifications (two A levels, so enough to have the option to attend some kind of higher education).

    Strikingly, the number (not the proportion) of graduates in “non-graduate” jobs is broadly similar to the number of those qualified to level 3 with “non-graduate” jobs.

    LEO and the minimum wage

    Instinctually, you’d expect a graduate to be earning comfortably above what is set at a national minimum for reasons of avoiding worker poverty. For this reason, it is fair to assume that gross earnings below the minimum wage relate to part-time work. The canonical failing of LEO is that it doesn’t differentiate between part-time and full-time work, but from the Census (so, 2020–21 issues apply to a certain extent) we know that graduates are less likely to be in part-time work (and more likely to be working at all) than all other groups.

    However, there are industry-based differences, and it is reasonable to assume that subject-based differences between earnings are derived from these. To give one obvious example, part-time work is a huge deal in creative and performing arts – so a lower than expected graduate salary in subjects like these would suggest that graduates are participating (at low/no pay) in the industry they have trained for and supporting this with part-time work.

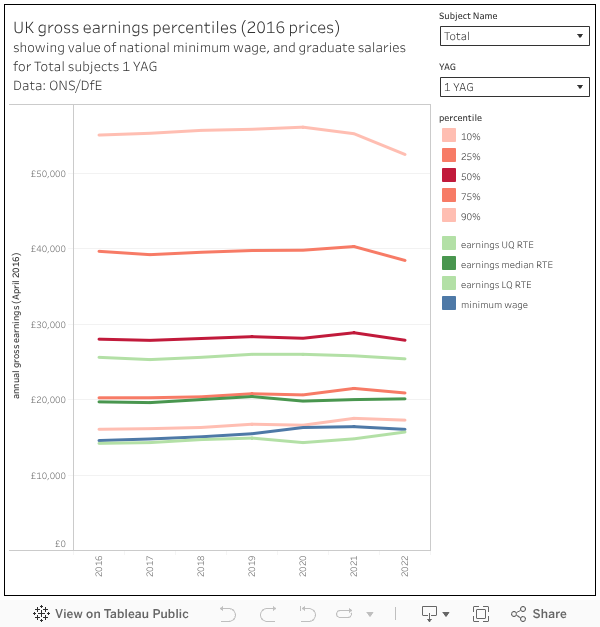
    With this caveat in mind, I have plotted LEO earnings against income percentiles for the whole working population and the value of the national minimum wage, all indexed to 2016 prices. The available LEO data extends from 2016 through to 2022, and in the latter year salaries across the economy experienced a real-terms downturn – something which (as we see from the chart above) has been cancelled out over the past few years.

    [Full screen]

    The two filters allow you to choose a subject area of interest, and to look at graduate gross earnings 1,3,5, and 10 years after graduation for each tax year.

    The median gross earnings of graduates is slightly above the median gross earnings of all earners (all ages, all levels of qualification) after ten years – though there is substantial industry-driven variation by subject. After one year (so comparing the gross earnings of 21-22 year olds with national averages) graduate earnings are around the lower quartile – and the intervening years see the difference between the two gradually bridged.

    Recall here that graduates are included within the percentile values – we are not looking here at a premium over non-graduates but a premium when compared to all earners. At the end of the day graduates are probably more concerned with the buying power of their own earnings than whether they are doing better than non-graduates.

    And, given how close the minimum wage is to the repayment threshold, looking at the premium over the minimum wage  (in cash term) is probably a more reasonable thing to do than I would have thought back at the birth of LEO.

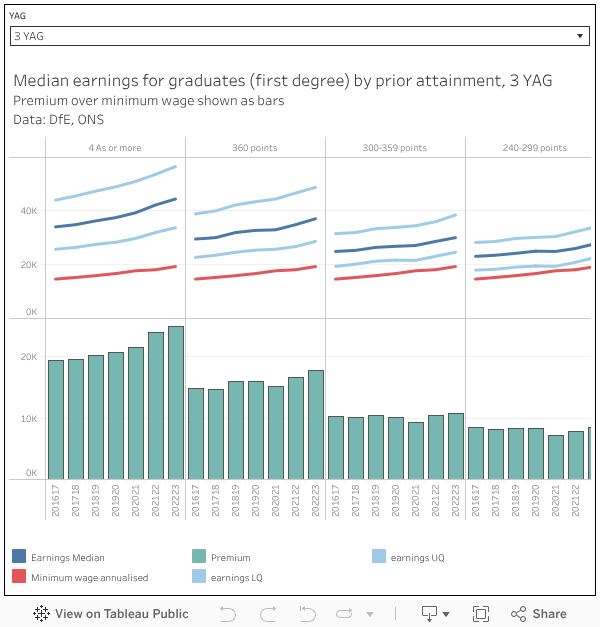
    We know prior attainment is one indicator of future salary (mostly as an indicator of deprivation more generally) so hear is a visualisation that plots LEO by prior attainment against the annualised minimum wage.

    [Full screen]

    How earnings are annualised in LEO

    The temptation with LEO is to read the figures as salaries, and to be fair the presentation of the data does everything it possibly can to encourage that reading. But inside the sausage machine, things are very different.

    The medians and quartiles familiar to us are based on individual graduate tax records for pay as you earn (PAYE, usually used by people in employment) and self assessment (SA, usually used by freelancers and the self-employed).

    With PAYE, earnings for a given tax year are divided by the number of days of employment recorded, to give an average daily wage. This is then multiplied by the number of working days in a tax year (which would appear to be different across the UK due to differing numbers of bank holidays: so 253 in England, 252 in Scotland, and 251 in Northern Ireland) to give annualised earnings.

    Because SA doesn’t offer dates of employment, LEO just uses the raw earnings. Annualised PAYE and raw SA income are then added together to give the final figure for each graduate, which are then used to produce the median and quartile data that is published.

    Another way

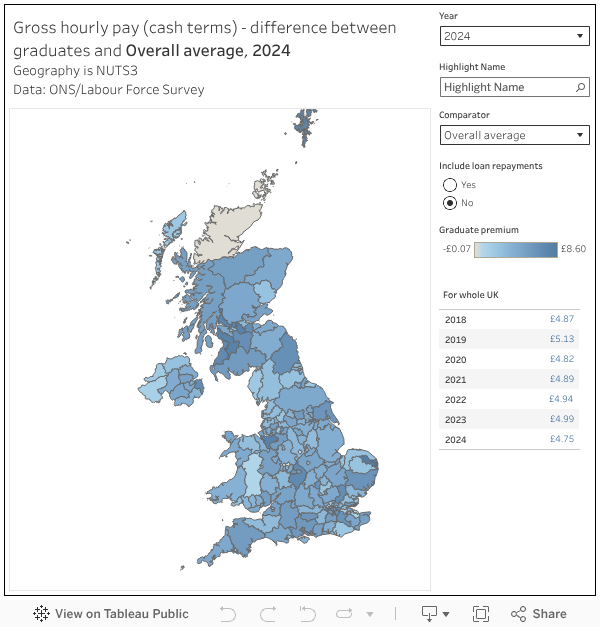
    I chanced upon some Labour Force Statistics data which neatly cuts across this issue by using gross hourly pay (and as luck would have it, broken down by NUTS3 regions over a number of years) as a measure of earnings. Big thanks to the ONS team for answering my questions on this one, and offering me information on the numbers in each group and an extra year of data.

    Now, LFS isn’t half as good as administrative data – it is a large, representative, survey of UK residents which has been dogged by low response rates in recent years – but it was, at the time, official statistics and thus is worth taking reasonably seriously. We do get two big benefits – the first is with hourly earnings we can confirm like with like, rather than needing to compensate for differing patterns of work; while the second is we get some regional data.

    A note of caution on that latter one – I’d be looking at the UK wide figures more closely as the NUTS3 regions (roughly equivalent to a top level local authority) may have quite low numbers of workers in each group (see the tooltips).

    [Full screen]

    What jumps out at me here is a clear and substantial wage premium for being a graduate, both nationally and in pretty much any area of the country. This largely holds against any qualification group of comparators, against average hourly earnings for everyone, and (very much) against the national minimum wage for the year in question. If you include loan repayments (take nine per cent off the hourly gross) there are a handful of areas of the UK where graduates are paid less than those with level three qualifications – and these largely map to other measures of deprivation.

    You would expect a result like that given what we know about the impact of place on income and the tendency among graduates to move to maximise opportunities and earnings. But even so, national premiums do hold up and appear to be broadly stable or growing since 2018. You can see the impact of the pandemic here – where graduate earnings overall remained stronger during 2020 and 2021.

    I should note here again that if you compare graduates with all earners, you are including the graduates themselves on both sides of the equation.

    Reasons to be GLMS

    Now you are probably ahead of me here, but the government used to do a graduate focused look at labour force survey data – imaginatively enough, called “graduate labour market statistics” (GLMS). I say “used to” because the 2024 iteration (released in summer 2025) is to be the last one ever. There’s an open consultation (follow the link) if you have thoughts on that – but you need to hurry, as responses are requested by the start of next month.

    The ostensible reason for discontinuing GLMS is the problems faced by LFS – the falling number of responses leading to issues with sample variability. Since 2024 it has been badged as “official statistics in development” (meaning that testing of quality, volatility, and an ability to meet user needs is underway), while improvements have been made that affect data throughout 2023 and 2024. From 2025 these improvements are fully in effect, and from 2026 a new “transformed labour force survey” (TLFS) will be the means by which ONS generates its whole suite of employment data.

    GLMS has clearly had some recent issues (although to be clear, these issues have not had a meaningful impact on the published national level data) but the data above suggests that it does have the potential (with appropriate caveats) to provide a more nuanced look at qualification level and regional data. Certainly, comparing the graduate population with those who hold at least the two A levels or equivalent that could get them into higher education feels like a simple and meaningful comparison we could learn from.

    A transformed LEO?

    If we are interested in graduate earnings premiums, the most useful thing that could be included in future LEO releases is hourly earnings. This would neatly address the part-time work issue, and focus directly on earning power rather than working patterns (which may vary for a number of reasons).

    Of course, earnings are only one part of the benefit of being a graduate – and for some (I’m looking at my creative peers here) the ability to make enough money to live on by doing the thing they love is probably going to be a bigger incentive than the ability to earn more than their neighbour. That’s not to say the salary data isn’t important for them to see, but telling me that I won’t earn much as a musician is not going to stop me from wanting to study music.

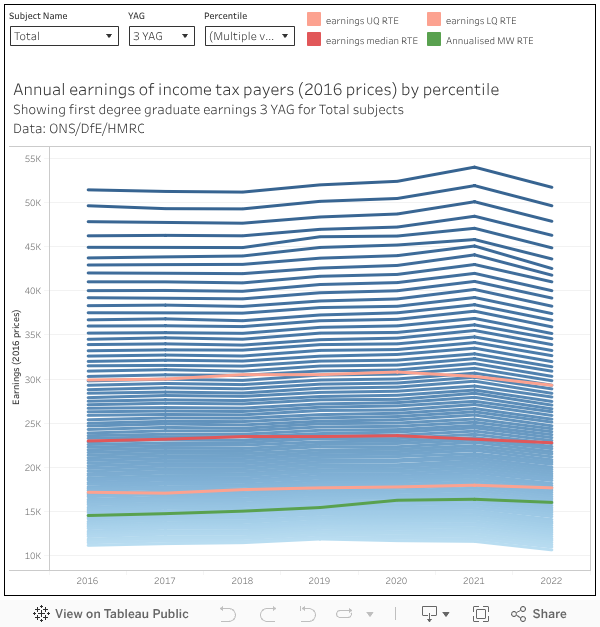
    That said, it does appear that (over the last few years at least) median graduate earnings have remained stable (or grown slightly) in real terms when compared to a given percentile of income tax payers. This isn’t a fair comparison – in that LEO data includes non-taxpayers and this particular HMRC data does not, but as a benchmarking tool it is interesting. By default I’m showing all but the top 10 percentiles of taxpayer income, alongside LEO by subject, and the minimum wage (all at 2016 prices).

    [Full screen]

    We know in LEO that a number of factors influence earnings: provider and subject (yes), but also prior disadvantage (of which prior attainment is one visible metric), sex, industry of employment (an economist will earn more in a bank than in a university), and region of employment. And if you control for all of these factors you are not going to get big enough groups to make statistically valid observations.

    All of which is a rather maths-heavy way of saying that past performance does not tell us a great deal about the future career prospects and earnings of a single applicant chosen at random. Looking at very broad, national, figures suggests to me that a boost in earning power (which grows throughout your career) is available for three years of study – but I would caveat that by saying if your sole interest in higher study is to increase your earning power then there are other metrics available that could help you maximise this particular benefit.

    Source link

  • How social mobility in HE can reproduce inequality – and what to do about it

    How social mobility in HE can reproduce inequality – and what to do about it

    by Anna Mountford-Zimdars, Louise Ashley, Eve Worth, and Chris Playford

    Higher education has become the go-to solution for social inequality over the past three decades. Widening access and enhancing graduate outcomes have been presented as ways to generate upward mobility and ensure fairer life chances for people from all backgrounds. But what if the very ecosystem designed to level the playing field also inadvertently helps sustain the very inequalities we are hoping to overcome? 

    Social mobility agendas appear progressive but are often regressive in practice. By focusing on the movement of individuals rather than structural change, they leave wealth and income disparities intact. A few people may rise, but the wider system remains unfair – but now dressed up with a meritocratic veneer. We explore these issues in our new article in the British Journal of Sociology, ‘Ambivalent Agents: The Social Mobility Industry and Civil Society under Neoliberalism in England’. We examined the role of the UK’s ‘social mobility industry’: charities, foundations, and third-sector organisations primarily working with universities to identify ‘talented’ young people from less advantaged backgrounds and help them access higher education or elite careers. We were curious – are these organisations transforming opportunity structures and delivering genuine change, or do they help stabilise the present system? 

    The answer to this question is of course complex but, in essence, we found the latter. Our analysis of 150 national organisations working in higher education since the early 1990s found that organisations tend to reflect the individualistic approach outlined above and blend critical rhetoric about inequality with delivery models that are funder-compatible, metric-led and institutionally convenient. Thus – and we expect unintentionally on part of the organisations – they often perform inclusion of ‘talent’ without asking too many uncomfortable structural questions about the persistence and reproduction of unequal opportunities. 

    We classified organisations in a five-part typology. Most organisations fell into the category of Pragmatic Progressives: committed to fairness but shaped by funder priorities, accountability metrics, and institutional convenience. A smaller group acted as Structural Resistors, pushing for systemic change. Others were System Conformers, largely reproducing official rhetoric. The Technocratic deliverers were most closely integrated with the state, often functioning as contracted agents with managerial, metrics-focused delivery models.   Finally, Professionalised Reformers seek reform through evidence-based programmes and advocacy, often with a focus on elite education and professions.

    This finding matters beyond higher education. Civil society – the world of charities, voluntary groups, and associations – has long been seen as the sphere where resistance to inequality might flourish. Yet our findings show that many organisations are constrained or co-opted into protecting the status quo by limited budgets, demanding funders, and constant requirements to demonstrate ‘impact’. Our point is not to disparage gains or to criticise the intentions of the charity sector but to push for honest and genuine change. 

    Labour’s new Civil Society Covenant, which promises to strengthen voluntary organisations and reduce short-termism, could create opportunities. But outsourcing responsibility for social goods to arm’s-length actors also risks producing symbolic reforms that celebrate individual success stories without changing the odds for the many. If higher education is to deliver genuine fairness, we must distinguish between performing fairness for a few and redistributing opportunities for the many. We thus want to conclude by suggesting three practical actions for universities, access and participation teams, and regulators such as the Office for Students.

    1. Audit for Ambivalence 

    Using our typology, do you find you are working with a mix of organisations, or mainly those focused on individuals? (Please contact us for accessing our coding framework to support your institutional or regional audits.) 

    • Rebalance activity towards structural levers

    Continue high-quality outreach, but, where possible, shift resources towards systemic interventions such as contextual admissions with meaningful grade floors, strong maintenance support, foundation pathways with guaranteed progression and fair, embedded work placements 

    Ask the regulator to measure structural outcomes as well as individual ones, at sector and regional levels. When commissioning work, ask for participatory governance and community accountability and measure that too.

    We believe civil-society partnerships can play a vital role – but not if they become the sole heavy-lifter or metric of success. Universities are well positioned to embrace structural levers, protect space for critique, and hold themselves accountable for distributional outcomes. If this happens, the crowded charity space around social mobility could become a vibrant counter-movement for genuine change to opportunities and producing fairness rather than a prop for maintaining an unequal status quo. 

    In terms of research, our next step is speaking directly to people working in the ‘social mobility industry.’ Do they/you recognise the tensions we highlight? How do they navigate them? Have we fairly presented their work? We look forward to continuing the discussion on this topic and how to enhance practice for transformative change.

    Anna Mountford-Zimdars is a Professor in Education at the University of Exeter.

    Louise Ashley is Associate Professor in the School of business and management at Queen Mary University London.

    Eve Worth is a Lecturer in History at the University of Exeter.

    Christopher James Playford is a Senior Lecturer in Sociology at the University of Exeter.

    Author: SRHE News Blog

    An international learned society, concerned with supporting research and researchers into Higher Education

    Source link

  • What might lower response rates mean for Graduate Outcomes data?

    What might lower response rates mean for Graduate Outcomes data?

    The key goal of any administered national survey is for it to be representative.

    That is, the objective is to gather data from a section of the population of interest in a country (a sample), which then enables the production of statistics that accurately reflect the picture among that population. If this is not the case, the statistic from the sample is said to be inaccurate or biased.

    A consistent pattern that has emerged both nationally and internationally in recent decades has been the declining levels of participation in surveys. In the UK, this trend has become particularly evident since the Covid-19 pandemic, leading to concerns regarding the accuracy of statistics reported from a sample.

    A survey

    Much of the focus in the media has been on the falling response rates to the Labour Force Survey and the consequences of this on the ability to publish key economic statistics (hence their temporary suspension). Furthermore, as the recent Office for Statistics Regulation report on the UK statistical system has illustrated, many of our national surveys are experiencing similar issues in relation to response rates.

    Relative to other collections, the Graduate Outcomes survey continues to achieve a high response rate. Among the UK-domiciled population, the response rate was 47 per cent for the 2022-23 cohort (once partial responses are excluded). However, this is six percentage points lower than what we saw in 2018-19.

    We recognise the importance to our users of being able to produce statistics at sub-group level and thus the need for high response rates. For example, the data may be used to support equality of opportunity monitoring, regulatory work and understand course outcomes to inform student choice.

    So, HESA has been exploring ways in which we can improve response rates, such as through strategies to boost online engagement and offering guidance on how the sector can support us in meeting this aim by, for example, outlining best practice in relation to maintaining contact details for graduates.

    We also need, on behalf of everyone who uses Graduate Outcomes data, to think about the potential impact of an ongoing pattern of declining response rates on the accuracy of key survey statistics.

    Setting the context

    To understand why we might see inaccurate estimates in Graduate Outcomes, it’s helpful to take a broader view of survey collection processes.

    It will often be the case that a small proportion of the population will be selected to take part in a survey. For instance, in the Labour Force Survey, the inclusion of residents north of the Caledonian Canal in the sample to be surveyed is based on a telephone directory. This means, of course, that those not in the directory will not form part of the sample. If these individuals have very different labour market outcomes to those that do sit in the directory, their exclusion could mean that estimates from the sample do not accurately reflect the wider population. They would therefore be inaccurate or biased. However, this cause of bias cannot arise in Graduate Outcomes, which is sent to nearly all those who qualify in a particular year.

    Where the Labour Force Survey and Graduate Outcomes are similar is that submitting answers to the questionnaire is optional. So, if the activities in the labour market of those who do choose to take part are distinct from those who do not respond, there is again a risk of the final survey estimates not accurately representing the situation within the wider population.

    Simply increasing response rates will not necessarily reduce the extent of inaccuracy or bias that emerges. For instance, a survey could achieve a response rate of 80 per cent, but if it does not capture any unemployed individuals (even when it is well known that there are unemployed people in the population), the labour market statistics will be less representative than a sample based on a 40 per cent response rate that captures those in and out of work. Indeed, the academic literature also highlights that there is no clear association between response rates and bias.

    It was the potential for bias to arise from non-response that prompted us to commission the Institute for Social and Economic Research back in 2021 to examine whether weighting needed to be applied. Their approach to this was as follows. Firstly, it was recognised that for any given cohort, it is possible that the final sample composition could have been different had the survey been run again (holding all else fixed). The sole cause of this would be a change in the group of graduates who choose not to respond. As Graduate Outcomes invites almost all qualifiers to participate, this variation cannot be due to the sample randomly chosen to be surveyed being different from the outset if the process were to be repeated – as might be the case in other survey collections.

    The consequence of this is that we need to be aware that a repetition of the collection process for any given cohort could lead to different statistics being generated. Prior to weighting, the researchers therefore created intervals – including at provider level – for the key survey estimate (the proportion in highly skilled employment and/or further study) which were highly likely to contain the true (but unknown) value among the wider population. They then evaluated whether weighted estimates sat within these intervals and concluded that if they did, there was zero bias. Indeed, this was what they found in the majority of cases, leading to them stating that there was no evidence of substantial non-response bias in Graduate Outcomes.

    What would be the impact of lower response rates on statistics from Graduate Outcomes?

    We are not the only agency running a survey that has examined this question. Other organisations administering surveys have also explored this matter too. For instance, the Scottish Crime and Justice Survey (SCJS) has historically had a target response rate of 68 per cent (in Graduate Outcomes, our target has been to reach a response rate of 60 per cent for UK-domiciled individuals). In SCJS, this goal was never achieved, leading to a piece of research being conducted to explore what would happen if lower response rates were accepted.

    SCJS relies on face-to-face interviews, with a certain fraction of the non-responding sample being reissued to different interviewers in the latter stages of the collection process to boost response rates. For their analysis, they looked at how estimates would change had they not reissued the survey (which tended to increase response rates by around 8-9 percentage points). They found that choosing not to reissue the survey would not make any material difference to key survey statistics.

    Graduate Outcomes data is collected across four waves from December to November, with each collection period covering approximately 90 days. During this time, individuals have the option to respond either online or by telephone. Using the 2022-23 collection, we generated samples that would lead to response rates of 45 per cent, 40 per cent and 35 per cent among the UK-domiciled population by assuming the survey period was shorter than 90 days. Similar to the methodology for SCJS therefore, we looked at what would have happened to our estimates had we altered the later stages of the collection process.

    From this point, our methodology was similar to that deployed by the Institute for Social and Economic Research. For the full sample we achieved (i.e. based on response rate of 47 per cent), we began by generating intervals at provider level for the proportion in highly skilled employment and/or further study. We then examined whether the statistic observed at a response rate of 45 per cent, 40 per cent and 35 per cent sat within this interval. If it did, our conclusion was there was no material difference in the estimates.

    Among the 271 providers in our dataset, we found that, at a 45 per cent response rate, only one provider had an estimate that fell outside the intervals created based on the full sample. This figure rose to 10 (encompassing 4 per cent of providers) at a 40 per cent response rate and 25 (representing 9 per cent of providers) at a 35 per cent response rate, though there was no particular pattern to the types of providers that emerged (aside from them generally being large establishments).

    What does this mean for Graduate Outcomes users?

    Those who work with Graduate Outcomes data need to understand the potential impact of a continuing trend of lower response rates. While users can be assured that the survey team at HESA are still working hard to achieve high response rates, the key-take away message from our study is that a lower response rate to the Graduate Outcomes survey is unlikely to lead to a material change in the estimates for the proportion in highly skilled employment and/or further study among the bulk of providers.

    The full insight and associated charts can be viewed on the HESA website:
    What impact might lower response rates have had on the latest Graduate Outcomes statistics?

    Read HESA’s latest research releases. If you would like to be kept updated on future publications, please sign-up to our mailing list.

    Source link

  • That Was The Quarter That Was, Summer 2025

    That Was The Quarter That Was, Summer 2025

    Welcome to TWTQTW for June-September. Things were a little slow in July, but with back to school happening in most of the Northern Hemisphere sometime between last August and late September, the stories began pouring in. 

    You might think that “back to school” would deliver up lots of stories about enrolment trends, but you’d mostly be wrong. While few countries are as bad as Canada when it comes to up-to date enrolment data, it’s a rare country that can give you good enrolment information in September. What you tend to get are what I call “mood” pieces looking backwards and forwards on long-term trends: this is particularly true in places like South Korea, where short-term trends are not bad (international students are backfilling domestic losses nicely for the moment) but the long-term looks pretty awful. Taiwan, whose demographic crisis is well known, saw a decline of about 7% in new enrolments, but there were also some shock declines in various parts of the world: Portugal, Denmark, and – most surprisingly – Pakistan

    Another perennial back-to-school story has to do with tuition fees. Lots of stories here. Ghana announced a new “No Fees Stress” policy in which first-year students could get their fees refunded. No doubt it’s a policy which students will enjoy, but this policy seems awfully close in inspiration to New Zealand’s First Year Free policy which famously had no effect whatsoever on access. But, elsewhere, tuition policy seems to be moving in the other direction. In China, rising fees at top universities sparked fears of an access gap and, in Iran, the decision of Islamic Azad University (a sort-of private institution that educates about a quarter of all Iranian youth) to continue raising tuition (partly in response to annual inflation rates now over 40%) has led to widespread dissatisfaction. Finally, tuition rose sharply in Bulgaria after the Higher Education Act was amended to link fees to government spending (i.e. more government spending, more fees). After student protests, the government moved to cut tuition by 25% from its new level, but this still left tuition substantially above where it was the year before.

    On the related issue of Student Aid, three countries stood out. The first was Kazakhstan, where the government increased domestic student grants increased by 61% but also announced a cut in the government’s famous study-abroad scheme which sends high-potential youth to highly-ranked foreign universities. 

    Perhaps the most stunning change occurred in Chile, where two existing student aid programs were replaced by a new system called the Fondo para la Educación Superior (FES), which is arguably unique in the world. The idea is to replace the existing system of student loans with a graduate tax: students who obtain funds through the FES will be required to pay a contribution of 10% of marginal income over about US$515/week for a period of twenty years. In substance, it is a lot like the Yale Tuition Postponement Plan, which has never been replicated at a national level because of the heavy burden placed on high income earners. A team from UCL in London analyzed the plan and suggested that it will be largely self-supporting – but only because high-earning graduates in professional fields will pay in far more than they receive, thus creating a question of potential self-selection out of the program.

    In Colombia, Congress passed a law mandating ICETEX (the country’s student loan agency which mostly services students at private universities) to lower interest rates, offer generous loan forgiveness and adopt an income-contingent repayment system. However, almost simultaneously, the Government of Gustavo Petro actually raised student loan interest rates because it could no longer afford to subsidize them. This story has a ways to run, I think.

    On to the world government cutbacks. In the Netherlands, given the fall of the Schoof government and the call for elections this month, universities might reasonably have expected to avoid trouble in a budget delivered by a caretaker government. Unfortunately, that wasn’t the case: instead, the 2026 imposed significant new cuts on the sector. In Argentina, Congress passed a law that would see higher education spending rise to 1% of GDP (roughly double the current rate). President Milei vetoed the law, but Congress overturned President Milei’s veto. In theory, that means a huge increase in university funding. But given the increasing likelihood of a new economic collapse in Argentina, it’s anyone’s guess how fulfilling this law is going to work out.

    One important debate that keeps popping up in growing higher education systems is the trade-off between quality and quantity with respect to institutions: that is, to focus money on a small number of high-quality institutions or a large number of, well, mediocre ones. Back in August, the Nigerian President, under pressure from the National Assembly to open hundreds of new universities to meet growing demand, announced a seven-year moratorium on the formation of new federal universities (I will eat several articles of clothing if there are no new federal universities before 2032). Conversely, in Peru, a rambunctious Congress passed laws to create 22 new universities in the face of Presidential reluctance to spread funds too thinly. 

    The newson Graduate Outcomes is not very good, particularly in Asia. In South Korea, youth employment rates are lower than they have been in a quarter-century, and the unemployment rate among bachelor’s grads is now higher than for middle-school grads. This is leading many to delay graduation. The situation in Singapore is not quite as serious but is still bad enough to make undergraduates fight for spots in elite “business cubs”. In China, the government was sufficiently worried about the employment prospects of the spring 2025 graduating class that it ordered some unprecedented measures to find them jobs, but while youth employment stayed low (that is, about 14%) at the start of the summer, the rate was back up to 19% by August. Some think these high levels of unemployment are changing Chinese society for good. Over in North America, the situation is not quite as dire, but the sudden inability of computer science graduates to find jobs seems deeply unfair to a generation that was told “just learn how to code”. 

    Withrespect to Research Funding and Policy, the most gobsmacking news came from Switzerland where the federal government decided to slash the budget of the Swiss National Science Foundation (SNSF) by 20%. In Australia, the group handling the Government’s Strategic Examination of Research and Development released six more “issue” papers which, amongst other things, suggested forcing institutions to choose particular areas of specialization in areas of government “priority”, a suggestion which was echoed in the UK both by the new head of UK Research and Innovation and the President of Universities UK.     

    But, of course, in terms of the politicization of research, very little can match the United States. In July, President Trump issued an Executive Order which explicitly handed oversight of research grants at the many agencies which fund extramural research to political appointees who would vet projects to ensure that they were in line with Trump administration priorities. Then, on the 1st of October (technically not Q3, but it’s too big a story to omit), the White House floated the idea of a “compact” with universities, under which institutions would agree to a number of conditions including shutting down departments that “punish, belittle” or “spark violence against conservative ideas” in return for various types of funding. Descriptions of the compact from academics ranged from “rotten” to “extortion”. At the time of writing, none of the nine institutions to which this had initially been floated had given the government an answer.

    And that was the quarter that was.


    Source link

  • Graduate outcomes should present a bigger picture

    Graduate outcomes should present a bigger picture

    September marks the start of the next round of Graduate Outcomes data collection.

    For universities, that means weeks of phone calls, follow-up emails, and dashboards that will soon be populated with the data that underpins OfS regulation and league tables.

    For graduates, it means answering questions about where they are, what they’re doing, and how they see their work and study 15 months on.

    A snapshot

    Graduate Outcomes matters. It gives the sector a consistent data set, helps us understand broad labour market trends, and (whether we like it or not) has become one of the defining measures of “quality” in higher education. But it also risks narrowing our view of graduate success to a single snapshot. And by the time universities receive the data, it is closer to two years after a student graduates.

    In a sector that can feel slow to change, two years is still a long time. Whole programmes can be redesigned, new employability initiatives launched, employer engagement structures reshaped. Judging a university on what its graduates were doing two years ago is like judging a family on how it treated the eldest sibling – the rules may well have changed by the time the younger one comes along. Applicants are, in effect, applying to a university in the past, not to the one they will actually experience.

    The problem with 15 months

    The design of Graduate Outcomes reflects a balance between timeliness and comparability. Fifteen months was chosen to give graduates time to settle into work or further study, but not so long that recall bias takes over. The problem is that 15 months is still very early in most careers, and by the time results are published, almost two years have passed.

    For some graduates, that means they are captured at their most precarious: still interning, trying out different sectors, or working in roles that are a stepping stone rather than a destination. For others, it means they are invisible altogether, portfolio workers, freelancers, or those in international labour markets where the survey struggles to track them.

    And then there is the simple reality that universities cannot fully control the labour market. If vacancies are not there because of a recession, hiring freezes, or sector-specific shocks, outcomes data inevitably dips, no matter how much careers support is offered. To read Graduate Outcomes as a pure reflection of provider performance is to miss the economic context it sits within.

    The invisible graduates

    Graduate Outcomes also tells us little about some of the fastest-growing areas of provision. Apprentices, CPD learners, and in future those engaging through the Lifelong Learning Entitlement (LLE), all sit outside its remit. These learners are central to the way government imagines the future of higher education (and in many cases to how universities diversify their own provision) yet their outcomes are largely invisible in official datasets.

    At the same time, Graduate Outcomes remains prominent in league tables, where it can have reputational consequences far beyond its actual coverage. The risk is that universities are judged on an increasingly narrow slice of their student population while other important work goes unrecognised.

    Looking beyond the survey

    The good news is that we are not short of other measures.

    • Longitudinal Education Outcomes (LEO) data shows long-term earnings trajectories, reminding us that graduates often see their biggest salary uplift years into their careers, not at the start. An Institute for Fiscal Studies report highlighted how the biggest benefits of a degree are realised well beyond the first few years.
    • The Resolution Foundation’s Class of 2020 study argued that short-term measures risk masking the lifetime value of higher education.
    • Alumni engagement gives a richer picture of where graduates go, especially internationally. Universities that invest in tracer studies or ongoing alumni networks often uncover more diverse and positive stories than the survey can capture.
    • Skills data (whether through Careers Registration or employer feedback) highlights what students can do and how they can articulate it. That matters as much as a job title, particularly in a labour market where roles evolve quickly.
    • Case studies, student voice, and narratives of career confidence help us understand outcomes in ways metrics cannot.

    Together, these provide a more balanced picture: not to replace Graduate Outcomes, but to sit alongside it.

    Why it matters

    For universities, an over-reliance on Graduate Outcomes risks skewing resources. So much energy goes into chasing responses and optimising for a compliance metric, rather than supporting long-term student success.

    For policymakers, it risks reinforcing a short-term view of higher education. If the measure of quality is fixed at 15 months, providers will inevitably be incentivised to produce quick wins rather than lifelong skills.

    For applicants, it risks misrepresenting the real offer of a university. They make choices on a picture that is not just partial, but out of date.

    Graduate Outcomes is not the enemy. It provides valuable insights, especially at sector level. But it needs to be placed in an ecosystem of measures that includes long-term earnings (LEO), alumni networks, labour market intelligence, skills data, and qualitative student voice.

    That would allow universities to demonstrate their value across the full diversity of provision, from undergraduates to apprentices to CPD learners. It would also allow policymakers and applicants to see beyond a two-year-old snapshot of a 15-month window.

    Until we find ways to measure what success looks like five, ten or twenty years on, Graduate Outcomes risks telling us more about the past than the future of higher education.

    Source link

  • Graduate Outcomes, 2022-23 graduating year

    Graduate Outcomes, 2022-23 graduating year

    The headline numbers from this year’s graduate outcomes data – which represents the activities and experiences of the cohort that graduated in 2022-23 around 15 months after graduation look, on the face of it, disappointing.

    There’s a bunch of things to bear in mind before we join the chorus claiming to perceive the end of graduate employment as a benefit of higher education due to some mixture (dilute to preference) of generative AI, the skills revolution, and wokeness.

    We are coming off an exceptional year both for graduate numbers and graduate recruitment – as the pandemic shock dissipates numbers will be returning to normal: viewed in isolation this looks like failure. It isn’t.

    But we’ve something even more fundamental to think about first.

    Before we start

    We’re currently living in a world in which HESA’s Graduate Outcomes data represents the UK’s only comprehensive official statistics dealing with employment.

    If you’ve not been following the travails of the ONS Labour Force Survey (the July overview is just out) large parts of the reported results are currently designated “official statistics in development” and thus not really usable for policy purposes – the response rate is currently around 20 per cent after some very hard work by the transformation team, having been hovering in the mid-teens for a good while.

    Because this is Wonkhe we’re going to do things properly and start with looking at response rates and sample quality for Graduate Outcomes, so strap in. We’ll get to graduate activities in a bit. But this stuff is important.

    Response rates and sample quality

    Declining survey response rates are a huge problem all over the place – and one that should concern anyone who uses survey data to make policy or support the delivery of services. If you are reading or drawing any actionable conclusions from a survey you should have the response rate and sample quality front and centre.

    The overall completion rate for the 2022-23 cohort for Graduate Outcomes was 35 per cent, which you can bump up to 39 per cent if you include partial completions (when someone started on the form but gave up half-way through). This is down substantially from 48 per cent fully completing in 2019-20, 43 per cent in 2020-21, and 40 per cent in 2021-22.

    There’s a lot of variation underneath that: but provider, level of previous study (undergraduate responses are stronger than postgraduate responses), and permanent address all have an impact. If you are wondering about sampling errors (and you’d be right to be at these response rates!) work done by HESA and others assures us that there has been no evidence of a problem outside of very small sub-samples.

    Here’s a plot of the provider level variation. I’ve included a filter to let you remove very small providers from the view based on the number of graduates for the year in question – by default you see nothing with less than 250 graduates.

    [Full screen]

    What do graduates do?

    As above, the headlines are slightly disappointing – 88 per cent of graduates from 2022-23 who responded to the survey reported that they were in work or further study, a single percentage point drop on last year. The 59 per cent in full-time employment is down from 61 per cent last year, while the proportion in unemployment is up a percentage point.

    However, if you believe that (on top of the general economic malaise) that generative AI is rendering entry level graduate jobs obsolete (a theme I will return to) you will be pleasantly surprised by how well employment is holding up. The graduate job market is difficult, but there is no evidence that it is out of the ordinary for this part of the economic cycle. Indeed, as Charlie Ball notes, we don’t see the counter-cyclical growth in further study that would suggest a full-blown downturn.

    There are factors that influence graduate activities – and we see a huge variation by provider. I’ve also included a filter here to let you investigate the impact of age: older graduates (particularly those who studied at a postgraduate level) are more likely to return to previous employment, which flatters the numbers for those who recruit more mature students.

    [Full screen]

    One thing to note in this chart is that the bar graph at the bottom shows proportions of all graduates, not the proportions of graduates with known destinations as we see at the top. I’ve done this to help put these results into context: though the sample may be representative it is not (as is frequently suggested) really a population level finding. The huge grey box at the top of each bar represents graduates that have not completed the survey.

    A lot of the time we focus on graduates in full-time employment and/or further study – this alternative plot looks at this by provider and subject. It’s genuinely fascinating: if you or someone you know is thinking about undergraduate law with a view to progressing a career there are some big surprises!

    [Full screen]

    Again, this chart shows the proportion of graduates with a known destination (ie those who responded to the Graduate Outcomes survey in some way), while the size filter refers to the total number of graduates.

    Industrial patterns

    There’s been a year-on-year decline in the proportion of graduates from UG courses in paid employment in professional services – that is the destination of just 11.92 per cent of them this year, the lowest on record. Industries that have seen growth include public administration, wholesale and retail, and health and social care.

    There’s been a two percentage point drop in the proportion of PG level graduates working in education – a lot of this could realistically put down to higher education providers recruiting fewer early-career staff. This is a huge concern, as it means a lot of very capable potential academics are not getting the first jobs they need to keep them in the sector.

    And if you’ve an eye on the impact of generative AI on early career employment, you’d be advised to keep an eye on the information and communication sector – currently machine generated slop is somehow deemed acceptable for many industrial applications (and indeed employment applications themselves, a whole other can of worms: AI has wrecked the usual application processes of most large graduate employers) in PR, media, and journalism. The proportion of recent undergraduates in paid employment in the sector has fallen from nearly 8 per cent in 2020-21 to just 4.86 per cent over the last two years. Again, this should be of national concern – the UK punches well above its weight in these sectors, and if we are not bringing in talented new professionals to gain experience and enhance profiles then we will lose that edge.

    [Full screen]

    To be clear, there is limited evidence that AI is taking anyone’s jobs, and you would be advised to take the rather breathless media coverage with a very large pinch of salt.

    Under occupation

    Providers in England will have an eye on the proportion of those in employment in the top three SOC codes, as this is a key part of the Office for Students progression measure. Here’s a handy chart to get you started with that, showing by default providers with 250 or more graduates in employment, and sorted by the proportion in the top three SOC categories (broadly managers and directors, professionals, and associate professionals).

    [Full screen]

    This is not a direct proxy for a “graduate job”, but it seems to be what the government and sector have defaulted to using instead of getting into the weeds of job descriptions. Again, you can see huge differences across the sector – but do remember subject mix and the likely areas in which graduates are working (along with the pre-existing social capital of said graduates) will have an impact on this. Maybe one day OfS will control for these factors in regulatory measures – we can but hope.

    Here’s a plot of how a bunch of other personal characteristics (age of graduates, ethnicity, disability, sex) can affect graduate activities, alongside information on deprivation, parental education, and socio-economic class for undergraduates. The idea of higher education somehow levelling out structural inequalities in the employment market completely was a fashionable stick to beat the sector with under the last government.

    [Full screen]

    [Full screen]

    Everything else

    That’s a lot of charts and a lot of information to scratch the surface of what’s in the updated graduate outcomes tables. I had hoped to see the HESA “quality of work” measure join the collection – maybe next year – so I will do a proxy version of that at some point over the summer. There’s also data on wellbeing which looks interesting, and a bunch of stuff on salaries which really doesn’t (even though it is better than LEO in that it reflects salaries rather than the more nebulous “earnings”) There’s information on the impact of degree classifications on activity, and more detail around the impact of subjects.

    Look out for more – but do bear in mind the caveats above.

    Source link

  • What SHAPE graduates do | Wonkhe

    What SHAPE graduates do | Wonkhe

    As debates continue about the value of degrees, and the role of universities in society and the future economy, understanding graduate outcomes is more important than ever.

    Yet much of the current discussion – and policymaking – is shaped by narrow metrics, which over-focus on graduate earnings.

    This approach overlooks many of the ways graduates contribute to society and distorts our understanding of the value of different subjects.

    The right SHAPE

    The British Academy represents SHAPE disciplines; social sciences, humanities and arts for people and the economy. SHAPE graduates develop crucial skills like critical thinking, creativity and problem solving. These skills help them contribute to tackling many of today’s most pressing challenges, from climate change to the ethical deployment of AI.

    However, we wanted to know more. How do they use these skills? What do SHAPE graduates do after university? How can we best measure the full breadth of their contribution to the UK economy and society? And do we have the data to address these questions comprehensively?

    To help provide answers, the British Academy has launched a new data-rich policy resource, Understanding SHAPE Graduates, which illustrates exactly how SHAPE graduates contribute to the UK economy and society. The toolkit consists of an interactive data dashboard, a series of key findings drawn from the data, and a policy briefing contextualising the measurement of graduate outcomes.

    SHAPE graduates and the economy

    The toolkit offers several myth-busting insights into SHAPE graduate activity, some of which we will outline here. Importantly, it challenges the narrative that SHAPE graduates have weak labour market prospects, showing that their employment rates are strong: 87 per cent of SHAPE graduates were in work in 2023, compared to 79 per cent of non-graduates with level 3 qualifications and 88 per cent of STEM graduates.

    SHAPE graduates also earn significantly more than non-graduates, with an average real hourly wage of £21 in 2023 – £5 higher than the average for those with at least two A levels or equivalent. And you can increasingly find them working in the UK’s fastest growing sectors; between 2010 and 2022, the top three sectors by GVA growth – manufacturing; transport and communication; and professional, scientific and technical services – saw growing numbers of SHAPE graduates. These sectors are outlined in the Government’s Industrial Strategy green paper, and SHAPE graduates comprised 52.8 per cent of the graduate workforce in all of them combined in 2023, up from 45.8 per cent in 1997.

    They are also well represented in the UK’s most productive regions. In 2023, SHAPE first-degree graduates accounted for 71 per cent per cent of the graduate workforce in London, 64 per cent in the North West and 58 per cent in the South East of England – the three regions with the highest GDP levels that year.

    What the data doesn’t show

    While the Academy’s policy toolkit marks a step forward, it also highlights the limitations of current graduate data. For example, while broad categories like SHAPE and STEM are useful, they can mask significant variations between disciplines.

    The toolkit uses the Labour Force Survey (LFS) and the Longitudinal Education Outcomes (LEO) dataset. Most significantly, both LEO and LFS focus primarily on earnings and employment. This narrow lens misses non-financial aspects of graduate impact – such as contributions to public life, wellbeing, culture, and civic engagement – which are especially important in understanding the SHAPE disciplines.

    Limitations in longitudinal graduate data also present specific challenges. Response rates to the LFS have declined in recent years, affecting its robustness, particularly for smaller cohorts like doctoral graduates. And the LEO dataset, which offers rich England-only data by tracking individuals from education into the labour market, has its own knowledge gaps. For example, LEO does not distinguish between full-time and part-time work, making it harder to interpret earnings data, especially for female graduates who are more likely to work part-time due to caregiving responsibilities. LEO also struggles to fully capture self-employed graduates, including freelancers in the creative industries and other sectors, due to its reliance on PAYE data.

    Looking ahead, the HESA Graduate Outcomes Survey (which replaced the Destination of Leavers from Higher Education (DLHE) survey in 2018) offers promise. Over time, it will offer increasingly longitudinal insights to help us deepen our understanding, and it is encouraging to see that HESA is already exploring non-financial measures of graduate activity. We plan to incorporate these into future work.

    Starting the conversation

    The Understanding SHAPE Graduates toolkit shows that SHAPE graduates are vital to the UK economy. As we approach the government’s Comprehensive Spending Review and await the publication of its refreshed Industrial Strategy, we must remember that the UK’s future success depends on drawing talent from across all disciplines.

    We want to continue exploring how we capture non-financial outcomes, to reflect the full value of a university education.

    At the British Academy, we will continue to champion the diverse and vital contributions that SHAPE graduates make across society and the economy. We look forward to working with the sector to develop better data, better metrics, and better understanding.

    You can see and use the data here.

    Source link

  • Subject-level insights on graduate activity

    Subject-level insights on graduate activity

    We know a lot about what graduates earn.

    Earnings data—especially at subject level—has become key to debates about the value of higher education.

    But we know far less about how graduates themselves experience their early careers. Until now, subject-level data on graduate job quality—how meaningful their work is, how well it aligns with their goals, and whether it uses their university-acquired skills—has been missing from the policy debate.

    My new study (co-authored with Fiona Christie and Tracy Scurry and published in Studies in Higher Education) aims to fill this gap. Drawing on responses from the 2018-19 graduation cohort in the national Graduate Outcomes survey, we provide the first nationally representative, subject-level analysis of these subjective graduate outcomes.

    What we find has important implications for how we define successful outcomes from higher education—and how we support students in making informed choices about what subject to study.

    What graduates tell us

    The Graduate Outcomes survey includes a set of questions—introduced by HESA in 2017—designed to capture core dimensions of graduate job quality. Respondents are asked (around 15 months after graduation) whether they:

    • find their work meaningful
    • feel it aligns with their future plans
    • believe they are using the skills acquired at university

    These indicators were developed in part to address the over-reliance on income as a measure of graduate success. They reflect a growing international awareness that economic outcomes alone offer a limited picture of the value of education—in line with the OECD’s Beyond GDP agenda, the ILO’s emphasis on decent work, and the UK’s Taylor Review focus on job quality.

    Subject-level insights

    Our analysis shows that most UK graduates report positive early-career experiences, regardless of subject. Across the sample, 86 per cent said their work felt meaningful, 78 per cent felt on track with their careers, and 66 per cent reported using their degree-level skills.

    These patterns generally hold across disciplines, though clear differences emerge. The chart below shows the raw, unadjusted proportion of graduates who report positive outcomes. Graduates from vocational fields—such as medicine, subjects allied to medicine, veterinary science, and education—tend to report particularly strong outcomes. For instance, medicine and dentistry graduates were 12 percentage points more likely than average to say their work was meaningful, and over 30 points more likely to report using the skills they acquired at university.

    However, the results also challenge the narrative that generalist or academic degrees are inherently low value. As you can see, most subject areas—including history, languages, and the creative arts, often targeted in these debates—show strong subjective outcomes across the three dimensions. Only one field, history and philosophy, fell slightly below the 50 per cent threshold on the skills utilisation measure. But even here, graduates still reported relatively high levels of meaningful work and career alignment.

    Once we adjusted for background characteristics—such as social class, gender, prior attainment, and institutional differences—many of the remaining gaps between vocational and generalist subjects narrowed and were no longer statistically significant.

    This chart shows the raw proportion of 2018-19 graduates who agree or strongly agree that their current work is meaningful, on track and using skills, by field of study (N = 67,722)

    Employment in a highly skilled occupation—used by the Office for Students (OfS) as a key regulatory benchmark—was not a reliable predictor of positive outcomes. This finding aligns with previous HESA research and raises important questions about the appropriateness of using occupational classification as a proxy for graduate success at the subject level.

    Rethinking what we measure and value

    These insights arrive at a time when the OfS is placing greater emphasis on regulating equality of opportunity and ensuring the provision of “full, frank, and fair information” to students. If students are to make informed choices, they need access to subject-level data that reflects more than salary, occupational status, or postgraduate progression. Our findings suggest that subjective outcomes—how graduates feel about their work—should be part of that conversation.

    For policymakers, our findings highlight the risks of relying on blunt outcome metrics—particularly earnings and occupational classifications—as indicators of course value. Our data show that graduates from a wide range of subjects—including those often labelled as “low value”—frequently go on to report meaningful work shortly after graduation that aligns with their future plans and makes use of the skills they developed at university.

    And while job quality matters, universities should not be held solely accountable for outcomes shaped by employers and labour market structures. Metrics and league tables that tie institutional performance too closely to job quality risk misrepresenting what higher education can influence. A more productive step would be to expand the Graduate Outcomes survey to include a wider range of job quality indicators—such as autonomy, flexibility, and progression—offering a fuller picture of early career graduate success.

    A richer understanding

    Our work offers the first nationally representative, subject-level insight into how UK graduates evaluate job quality in the early stages of their careers. In doing so, it adds a missing piece to the value debate—one grounded not just in earnings or employment status, but in graduates’ own sense of meaning, purpose, and skill use.

    If we are serious about understanding what graduates take from their university experience, it’s time to move beyond salary alone—and to listen more carefully to what graduates themselves are telling us.

    DK notes: Though the analysis that Brophy et al have done (employing listwise deletion, examining UK domiciled first degree graduates only) enhances our understanding of undergraduate progression and goes beyond what is publicly available, I couldn’t resist plotting the HESA public data in a similar way, as it may be of interest to readers:

    [Full screen]

    Source link