Category: NSS

  • Is it time to change the rules on NSS publication?

    Is it time to change the rules on NSS publication?

    If we cast our minds back to 2005, the four UK higher education funding bodies ran the first ever compulsory survey of students’ views on the education they receive – the National Student Survey (NSS).

    Back then the very idea of a survey was controversial, we were worried about the impact on the sector reputation, the potential for response bias, and that students would be fearful of responding negatively in case their university downgraded their degree.

    Initial safeguards

    These fears led us to make three important decisions all of which are now well past their sell-by date. These were:

    • Setting a response rate threshold of 50 per cent
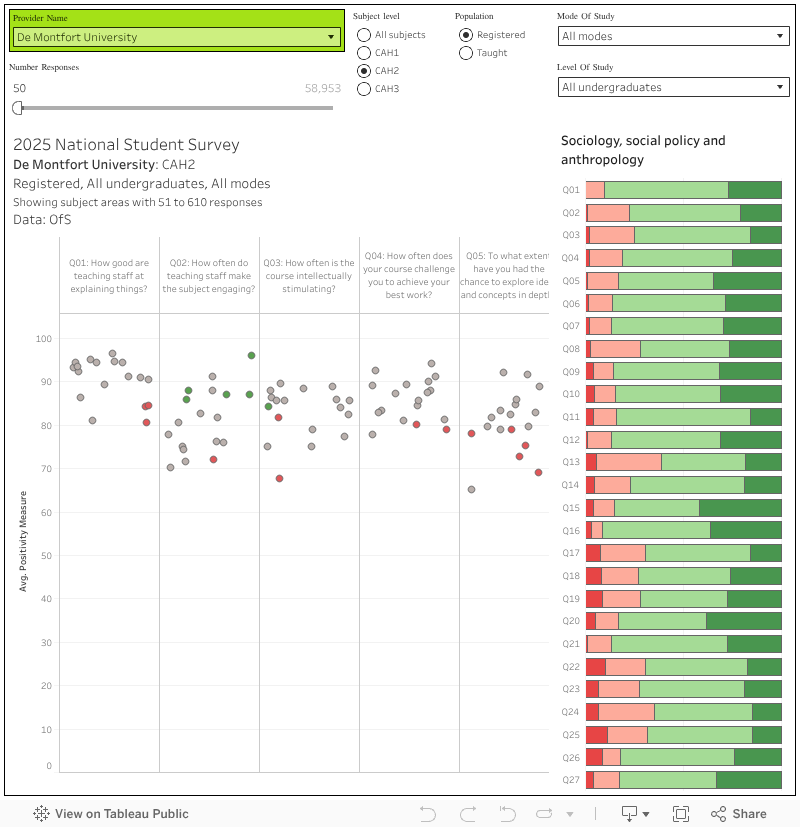
    • Restricting publication to subject areas with more than 22 respondents
    • Only providing aggregate data to universities.

    At the time all of these were very sensible decisions designed to build confidence in what was a controversial survey. Twenty years on, it’s time to look at these with fresh eyes to assure ourselves they remain appropriate – and to these eyes they need to change.

    Embarrassment of riches

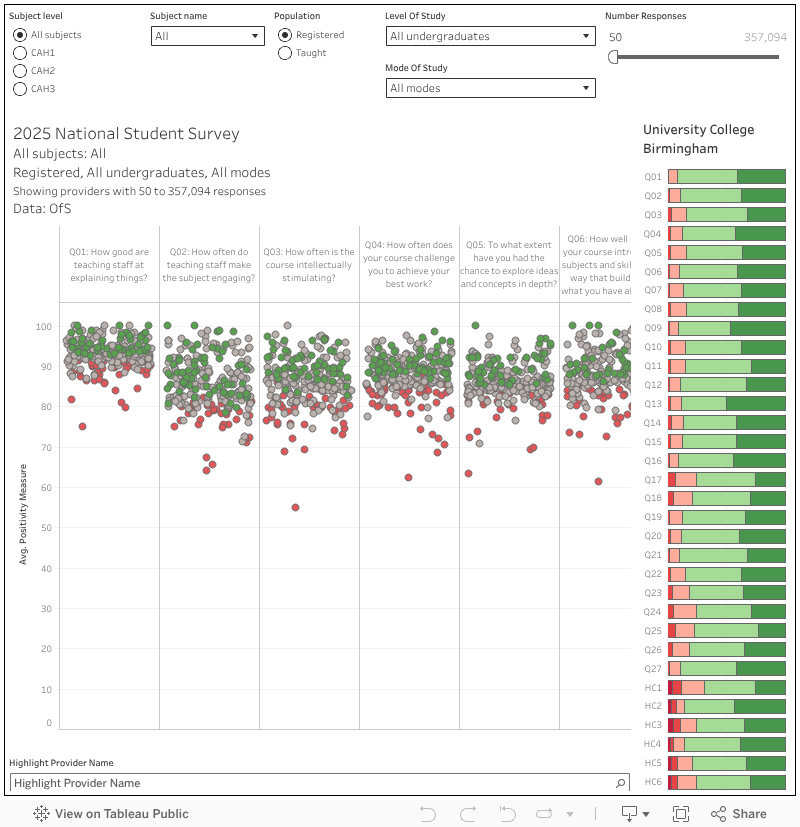
    One of these rules has already changed: responses are now published where 10 or more students respond. Personally, I think this represents a very low bar, determined as it is by privacy more than statistical reasoning, but I can live with it especially as research has shown that “no data” can be viewed negatively.

    Of the other two, first let me turn to the response rate. Fifty per cent is a very high response rate for any survey, and the fact the NSS achieves a 70 per cent response rate is astonishing. While I don’t think we should be aiming to get fewer responses, drawing a hard line at 50 per cent creates a cliff edge in data that we don’t need.

    There is nothing magical about 50 per cent – it’s simply a number that sounds convincing because it means that at least half your students contributed. A 50 per cent response rate does not ensure that the results are not subject to bias for example, if propensity to respond was in some way correlated with a positive experience the results would still be flawed.

    I would note that the limited evidence that there is suggests that propensity to respond is not correlated with a positive experience, but it’s an under-researched area and one the Office for Students (OfS) should publish some work on.

    Panel beating

    This cliff edge is even more problematic when the data is used in regulation, as the OfS proposes to do a part of the new TEF. Under OfS proposals providers that don’t have NSS data either due to small cohorts or a “low” response rate would have NSS evidence replaced with focus groups or other types of student interaction. This makes sense when the reason is an absolute low number of responses but not when it’s due to not hitting an exceptionally high response rate as Oxford and Cambridge failed to do for many years.

    While focus groups can offer valuable insights, and usefully sit alongside large-scale survey work, it is utterly absurd to ignore evidence from a survey because an arbitrary and very high threshold is not met. Most universities will have several thousand final year students, so even if only 30 per cent of them respond you will have responses from hundreds if not thousands of individuals – which must provide a much stronger evidence base than some focus groups. Furthermore, that evidence base will be consistent with every other university creating one less headache for assessors in comparing diverse evidence.

    The 50 per cent response rate threshold also looks irrational when set against a 30 per cent threshold for the Graduate Outcomes survey. While any response rate threshold is arbitrary to apply, applying two different thresholds needs rather more justification than the fact that the surveys are able to achieve different response rates. Indeed, I might argue that the risk of response bias might be higher with GO for a variety of reasons.

    NSS to GO

    In the absence of evidence in support of any different threshold I would align the NSS and GO publication thresholds at 30 per cent and make the response rates more prominent. I would also share NSS and GO data with TEF panels irrespective of the response rate, and allow them to rely on their expert judgement supported by the excellent analytical team at the OfS. And the TEF panel may then choose to seek additional evidence if they consider it necessary.

    In terms of sharing data with providers, 2025 is really very different to 2005. Social media has arguably exploded and is now contracting, but in any case attitudes to sharing have changed and it is unlikely the concerns that existed in 2005 will be the same as the concerns of the current crop of students.

    For those who don’t follow the detail, NSS data is provided back to Universities via a bespoke portal that provides a number of pre-defined cuts of the data and comments, together with an ability to create your own cross-tabs. This data, while very rich, do not have the analytical power of individualised data and suffer from still being subject to suppression for small numbers.

    What this means is that if we want to understand the areas we want to improve we’re forced to deduce it from a partial picture rather than being laser focussed on exactly where the issues are, and this applies to both the Likert scale questions and the free text.

    It also means that providers cannot form a longitudinal view of the student experience by linking to other data and survey responses they hold at an individual level – something that could generate a much richer understanding of how to improve the student experience.

    Source link

  • National Student Survey 2025 | Wonkhe

    National Student Survey 2025 | Wonkhe

    After a few years of rapid changes and exogenous shocks we are pretty much back to normal on the national student survey.

    The 2025 results tell an overall tale of graduate improvement – of students being generally content that they are getting what they have been led to expect (or, for the cynics, having modulated their expectations appropriately), and of a sector where the majority of students are content with pretty much every area of their academic experience.

    The positivity is always worthy of noting as it balances out a popular image of unhappy students, poor quality courses, and failing universities. The inconvenient truth is that UK higher education as a whole is pretty good, and remains so despite the efforts and fervent wishes of many.

    Overall

    The main utility of the National Student Survey is to draw gentle but persistent external attention to the kind of internal problems that decent providers will already be aware of. If you know, for example, there is a problem with students receiving timely feedback on your undergraduate architecture course, the temptation in these times of budgetary restraint may be to let it slide – a negative NSS finding focuses attention where it is needed.

    Michelle Donelan (where is she now?) famously took against the framing of students being “satisfied” in her jeremiad against the old NSS – but the NSS has, since inception, acted as a tool to get students some satisfaction.

    [Full screen]

    Our first chart looks at the four home nations and the UK as a whole – you can examine subject areas of interest at three levels, choose to see registered or taught students, of all undergraduate levels and mode, and filter out areas with low response numbers. From this we learn that food and beverage studies is probably the most challenging course in the UK, with 94.8 per cent of respondents responding positively to question 4 (“how often does your course challenge you to achieve your best work”).

    In Wales, medical technology students were least likely to be positive about the fairness of marking and assessment. In England, maritime technology students are least likely to feel their student union represents them. To be clear, at CAH3 we are often looking at very small numbers of students (which may pertain to a single course in a single provider) – cranking things up to CAH1 means we can be much more confident that veterinary science students in Scotland find their course “intellectually stimulating”.

    By provider

    It gets interesting when you start comparing the national averages above to subject areas in your provider, so I’ve built a version of the dashboard where you can examine different aspects of your own provision. I’ve added a function where you click on a subject dot it updates the bar chart on the right, offering an overview of all responses to all questions.

    [Full screen]

    This helps put in perspective how cross your computer games and animation students are with your library resources – it turns out this is a national problem, and perhaps a chat to a professional body might be helpful in finding out what needs to be done

    Of course, there’s a whole industry out there that uses NSS results to rank providers, often using bizarre compound metrics now we don’t have an “overall satisfaction” question (if you’ve ever read nonsense about nursing students in a provider being the most satisfied among modern campus universities in the East Midlands then this is how we get there).

    There is a value in benchmarking against comparators, so this is my gentle contribution to this area of discourse which works in the same way as the one above (note that you need to select a subject area as well as a subject level). For the people who ask every year – the population sizes and response numbers are in the tooltips (you can also filter out tiny response numbers, by default I do this at fifty).

    I’ve not included the confidence intervals that OfS’s dashboard does because it simply doesn’t matter for most use cases and it makes the charts harder to read (and slower to load). You should be aware enough to know that a small number of responses probably doesn’t make for a very reliable number. Oh, and the colour of the dots is the old (very old) TEF flags – two standard deviations above (green) or below (red) the benchmark.

    [Full screen]

    Characteristics

    Beyond national trends, subject level oddities, and provider peculiarities the student experience is affected by personal characteristics.

    While there may be a provider level problem, many of these could equally be a national or UK-wide issue: especially when linked to a particular subject area. We get characteristic statistics up to CAH level 1 (very broad groups of subjects) in public data, which may be enough to help you understand what is going on with a particular set of students.

    For instance, it appears that – nationally – students with disabilities (including mental health struggles) are less likely to feel that information about wellbeing support is well communicated – something that is unlikely to be unique to a single provider, and (ideally) needs to be addressed in partnership to ensure these vulnerable students get the support they need.

    [Full screen]

    Conclusion

    If you take NSS at face value it is an incredibly useful tool. If we manage to leave it in a steady state for a few more years time series will add another level to this usefulness (sorry, a year-on-year comparison tells us little and even three years isn’t much better.

    As ammunition to allow you to solve problems in your own provider, to identify places to learn from, and iterate your way to happier and better educated students it is unsurpassed. It’s never really convinced as a regulatory tool, and (on a limb here) the value for applicants only really comes as a warning away from places that are doing outstandingly badly.

    Source link

  • How can students’ module feedback help prepare for success in NSS?

    How can students’ module feedback help prepare for success in NSS?

    Since the dawn of student feedback there’s been a debate about the link between module feedback and the National Student Survey (NSS).

    Some institutions have historically doubled down on the idea that there is a read-across from the module learning experience to the student experience as captured by NSS and treated one as a kind of “dress rehearsal” for the other by asking the NSS questions in module feedback surveys.

    This approach arguably has some merits in that it sears the NSS questions into students’ minds to the point that when they show up in the actual NSS it doesn’t make their brains explode. It also has the benefit of simplicity – there’s no institutional debate about what module feedback should include or who should have control of it. If there isn’t a deep bench of skills in survey design in an institution there could be a case for adopting NSS questions on the grounds they have been carefully developed and exhaustively tested with students. Some NSS questions have sufficient relevance in the module context to do the job, even if there isn’t much nuance there – a generic question about teaching quality or assessment might resonate at both levels, but it can’t tell you much about specific pedagogic innovations or challenges in a particular module.

    However, there are good reasons not to take this “dress rehearsal” approach. NSS endeavours to capture the breadth of the student experience at a very high level, not the specific module experience. It’s debatable whether module feedback should even be trying to measure “experience” – there are other possible approaches, such as focusing on learning gains, or skills development, especially if the goal is to generate actionable feedback data about specific module elements. For both students and academics seeing the same set of questions repeated ad nauseam is really rather boring, and is as likely to create disengagement and alienation from the “experience” construct NSS proposes than a comforting sense of familiarity and predictability.

    But separating out the two feedback mechanisms entirely doesn’t make total sense either. Though the totemic status of NSS has been tempered in recent years it remains strategically important as an annual temperature check, as a nationally comparable dataset, as an indicator of quality for the Teaching Excellence Framework and, unfortunately, as a driver of league table position. Securing consistently good NSS scores, alongside student continuation and employability, will feature in most institutions’ key performance indicators and, while vice chancellors and boards will frequently exercise their critical judgement about what the data is actually telling them, when it comes to the crunch no head of institution or board wants to see their institution slip.

    Module feedback, therefore, offers an important “lead indicator” that can help institutions maximise the likelihood that students have the kind of experience that will prompt them to give positive NSS feedback – indeed, the ability to continually respond and adapt in light of feedback can often be a condition of simply sustaining existing performance. But if simply replicating the NSS questions at module level is not the answer, how can these links best be drawn? Wonkhe and evasys recently convened an exploratory Chatham House discussion with senior managers and leaders from across the sector to gather a range of perspectives on this complex issue. While success in NSS remains part of the picture for assigning value and meaning to module feedback in particular institutional contexts there is a lot else going on as well.

    A question of purpose

    Module feedback can serve multiple purposes, and it’s an open question whether some of those purposes are considered to be legitimate for different institutions. To give some examples, module feedback can:

    • Offer institutional leaders an institution-wide “snapshot” of comparable data that can indicate where there is a need for external intervention to tackle emerging problems in a course, module or department.
    • Test and evaluate the impact of education enhancement initiatives at module, subject or even institution level, or capture progress with implementing systems, policies or strategies
    • Give professional service teams feedback on patterns of student engagement with and opinions on specific provision such as estates, IT, careers or library services
    • Give insight to module leaders about specific pedagogic and curriculum choices and how these were received by students to inform future module design
    • Give students the opportunity to reflect on their own learning journey and engagement
    • Generate evidence of teaching quality that academic staff can use to support promotion or inform fellowship applications
    • Depending on the timing, capture student sentiment and engagement and indicate where students may need additional support or whether something needs to be changed mid-module

    Needless to say, all of these purposes can be legitimate and worthwhile but not all of them can comfortably coexist. Leaders may prioritise comparability of data ie asking the same question across all modules to generate comparable data and generate priorities. Similarly, those operating across an institution may be keen to map patterns and capture differences across subjects – one example offered at the round table was whether students had met with their personal tutor. Such questions may be experienced at department or module level as intrusive and irrelevant to more immediately purposeful questions around students’ learning experience on the module. Module leaders may want to design their own student evaluation questions tailored to inform their pedagogic practice and future iterations of the module.

    There are also a lot of pragmatic and cultural considerations to navigate. Everyone is mindful that students get asked to feed back on their experiences A LOT – sometimes even before they have had much of a chance to actually have an experience. As students’ lives become more complicated, institutions are increasingly wary of the potential for cognitive overload that comes with being constantly asked for feedback. Additionally, institutions need to make their processes of gathering and acting on feedback visible to students so that students can see there is an impact to sharing their views – and will confirm this when asked in the NSS. Some institutions are even building questions that test whether students can see the feedback loop being closed into their student surveys.

    Similarly, there is also a strong appreciation of the need to adopt survey approaches that support and enable staff to take action and adapt their practice in response to feedback, affecting the design of the questions, the timing of the survey, how quickly staff can see the results and the degree to which data is presented in a way that is accessible and digestible. For some, trusting staff to evaluate their modules in the way they see fit is a key tenet of recognising their professionalism and competence – but there is a trade-off in terms of visibility of data institution-wide or even at department or subject level.

    Frameworks and ecosystems

    There are some examples in the sector of mature approaches to linking module evaluation data to NSS – it is possible to take a data-led approach that tests the correlation between particular module evaluation question responses and corresponding NSS question outcomes within particular thematic areas or categories, and builds a data model that proposes informed hypotheses about areas of priority for development or approaches that are most likely to drive NSS improvement. This approach does require strong data analysis capability, which not every institution has access to, but it certainly warrants further exploration where the skills are there. The use of a survey platform like evasys allows for the creation of large module evaluation datasets that could be mapped on to NSS results through business intelligence tools to look for trends and correlations that could indicate areas for further investigation.

    Others take the view that maximising NSS performance is something of a red herring as a goal in and of itself – if the wider student feedback system is working well, then the result should be solid NSS performance, assuming that NSS is basically measuring the right things at a high level. Some go even further and express concern that over-focus on NSS as an indicator of quality can be to the detriment of designing more authentic student voice ecosystems.

    But while thinking in terms of the whole system is clearly going to be more effective than a fragmented approach, given the various considerations and trade-offs discussed it is genuinely challenging for institutions to design such effective ecosystems. There is no “right way” to do it but there is an appetite to move module feedback beyond the simple assessment of what students like or don’t like, or the checking of straightforward hygiene factors, to become a meaningful tool for quality enhancement and pedagogic innovation. There is a sense that rather than drawing direct links between module feedback and NSS outcomes, institutions would value a framework-style approach that is able to accommodate the multiple actors and forms of value that are realised through student voice and feedback systems.

    In the coming academic year Wonkhe and evasys are planning to work with institutional partners on co-developing a framework or toolkit to integrate module feedback systems into wider student success and academic quality strategies – contact us to express interest in being involved.

    This article is published in association with evasys.

    Source link