Category: staff

  • The Wonkhe HE staff survey – how good is work in higher education?

    The Wonkhe HE staff survey – how good is work in higher education?

    As financial pressures continue to bear down on higher education institutions across the UK, there is a visible impact on higher education staff, as resources shrink, portfolios are rationalised, and redundancy programmes are implemented. These are definitively tough times for the sector and its people.

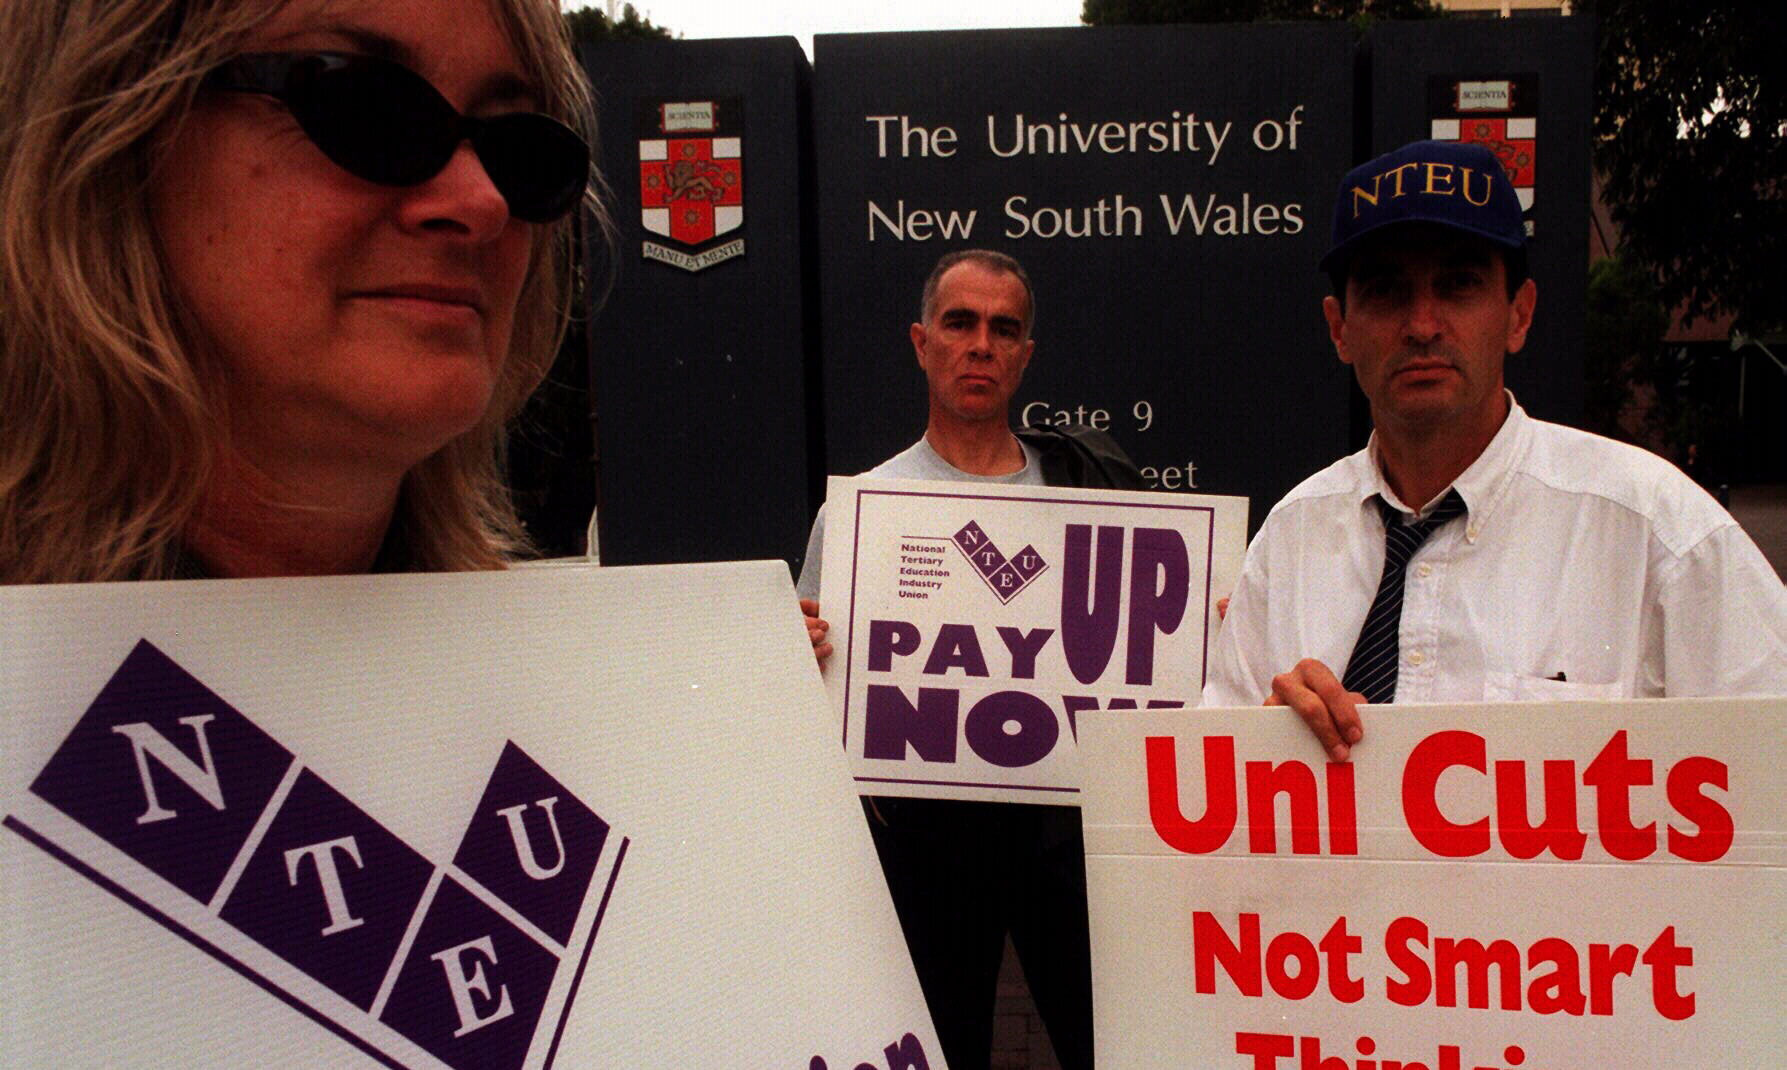
    One way this plays out is in the industrial relations landscape, with unions balloting for industrial action, as well as, on some specific issues, advancing joint work with employers.

    But there is a wider, arguably more nuanced, lens to bring to bear, about how the current circumstances are reshaping staff experiences of working in higher education, and what options are available to those with responsibility for leading and supporting higher education staff.

    When the Wonkhe team came up with the idea of running a national survey for higher education staff we knew from the outset that we would not be able to produce definitive statements about “the HE staff experience” derived from a representative sample of responses. There is no consensus over how you would define such a sample in any case.

    The best national dataset that exists is probably found in UCEA publications that combine institutional staff experience survey datasets at scale – one published in 2024 titled “What’s it really like to work in HE?” and one in May this year diving into some of the reported differences between academic and professional staff, “A tale of two perspectives: bridging the gap in HE EX.

    Instead we wanted to, firstly, ask some of the questions that might not get asked in institutional staff surveys – things like, how staff feel about their institution’s capacity to handle change, or the relative importance of different potential motivating factors for working in HE, or, baldly, how institutional cost-cutting is affecting individuals. And secondly, as best we can, to draw out some insight that’s focused on supporting constructive conversations within institutions about sustaining the higher education community during challenging times.

    We’ll be reporting on three key areas:

    1. “Quality of work” – discussed further below
    2. Professional motivations, the relative importance of different motivators for our sample group, and the gap between the level of importance afforded key motivators and the extent to which respondents believe they actually get to experience these in their roles – DK has tackled that subject and you can read about his findings here
    3. Views on institutional change capability – coming soon!

    We’ve not covered absolutely everything in this tranche of reporting – partly because of time pressures, and partly because of format constraints. We have a fair bit of qualitative data to dive into, as well as the third area of investigation on institutional change capability all still to come – watch this space.

    The methodology and demographics bit

    We promoted the survey via our mailing list (around 60,000 subscribers) during July and August 2025, yielding a total of 4,757 responses. We asked a whole range of questions that we hoped could help us make meaningful comparisons within our sample – including on things like nationality, and type and location of institutions – but only some of those questions netted enough positive responses to allow us to compare two or more good-sized groups.

    Our working assumption is that if there was a group of around 500 or more who share a particular characteristic it is reasonable to compare their responses to the group of respondents who did not have that particular characteristic. We have conducted analysis of the following subgroups:

    • Career stage: Early career (n=686), mid career (n=1,304), and late career (n=2,703)
    • Those with an academic contract (n=1,110) and those with a non-academic contract (n=3,394) – excluding some other kinds of roles/contracts
    • Time in higher education: five years or fewer (n=908); 6-10 years (n=981); 11-20 years (n=1,517) and more than 20 years (n=1,333)
    • Working arrangements: on-site (n=988); working from home or remotely (n=475); and flexible/hybrid (n=3,268)
    • Leadership role: respondents who said they have formal management or leadership responsibility in their current role for projects, programmes, resources, or people (n=3,506), and those who did not (n=1,214)

    And we also looked at the following identity characteristics:

    • Gender: men (n=1,386) and women (n=3,271)
    • Sexuality: those who identified as gay, lesbian, bisexual or queer (n=654) and those who did not (n=4,093)
    • Ethnicity: those who identified as being of a minoritised ethnicity (n=247) and those who did not (n=4,444)
    • Disability: those who identified as being disabled (n=478) and those who did not (n=4,269)

    In one case – that of respondents who identified as being of a minoritised ethnicity – our sample didn’t meet the threshold for wholly robust analysis, but we found some differences in reported experience, which we think is worth reporting given what we already know about this group of staff, and would caution that these findings should be viewed as indicative rather than definitive.

    In some cases we have combined subgroups to make larger groups – for example we’ve grouped various academic roles together to compare with roles on other kinds of contracts. In others we’ve ignored some very small (usually n=3 and below) groups to make for a more readable chart; for this reason we don’t often show all responses. And although our response rates are high you don’t have to refine things much to get some pretty low numbers, so we’ve not looked at intersections between groups.

    We have reported where we found what we considered to be a meaningful difference in response – a minimum of four percentage points difference.

    The financial context

    88 per cent of respondents said their institution has taken material steps to reduce costs in the last 12 months, offering a background context for answers to the wider survey and the assurance that the thing we are looking at is definitely staff views against a backdrop of change.

    51.6 per cent said they personally had been negatively affected by cost reduction measures, while 41.9 per cent said the personal impact was neutral. This suggests that while cost reduction may be widely viewed as negative, that experience or the views that arise from it may not be universal.

    Of those that said they had been negatively affected we found no meaningful differences among our various comparator groups. Leaders and those later in their career, were as likely to report negative impacts as those without leadership responsibilities or earlier in their career, suggesting that there is little mileage in making assumptions about who is more likely to be negatively impacted – though of course we did not try to measure the scale of the impact, and we’re mindful we were talking to people who had not lost their jobs as a result of cost-saving measures.

    The one exception was between those on academic contracts, of whom nearly two third (65.3 per cent) reported negative impacts, and those on non-academic contracts, of whom the number reporting negative impact was closer to half (47.4 per cent). This difference gives important context for the wider findings, in which those on academic contracts are consistently more likely to offer a negative perspective than those on non-academic contracts across a range of questions. This tallies to some degree with the national picture explored in UCEA’s “Bridging the gap” report in which academics were more likely to report challenges with workload, work-life balance, and reward and recognition, than professional staff – though higher levels of work satisfaction.

    Regretting and recommending HE

    We asked whether, taking into account what is known about other available career paths, whether respondents feel that choosing to work in HE was the right decision for them – two thirds said yes (66.9 per cent) while 23.8 per cent were unsure. Only 9 per cent said no.

    Those approaching the end of their career were more likely to agree (74.3 per cent) compared to those mid-career (65 per cent) or early career (61.2 per cent). Those with leadership responsibilities were also slightly more likely to agree, at 68.2 per cent, compared to 62.3 per cent for those without leadership responsibilities.

    Those on academic contracts were slightly less likely to agree, at 60.8 per cent compared to 68.9 per cent for those on non-academic contracts.

    However, the real divide opens up when we looked at responses to our follow up question: whether respondents would recommend a career in higher education to someone they cared about who was seeking their advice. A much smaller proportion of our sample agreed they would recommend a career in HE (42.2 per cent), with much higher rates of “unsure” (32.1 per cent) and “no” (24.5 per cent) – most likely reflecting the impact of current challenges as compared to people’s longer-term lived experience.

    For the recommend question, the career-stage trend reverses, with those approaching the end of their careers less likely to say they would recommend a career in HE (39.2 per cent) compared to 41.6 per cent for those mid-career and 50.4 per cent for early career respondents.

    There was a substantial difference by role: only 25.7 per cent of those on academic contracts would recommend a career in HE, compared to 46.9 per cent of those on non-academic contracts.

    We did not find any differences by gender, ethnicity, disability, or sexuality on either confidence in the decision to work in HE or willingness to recommend it as a career.

    Quality of work

    One of the great things about higher education as an employment sector is that there are lots of ways to be employed in it and lots of different types of jobs. What one person values about their role might be quite different from what another person appreciates – and the same for the perceived downsides of any given role.

    So rather than trying to drill down into people’s reported experiences based on our own probably biased views about what “good work” looks and feels like, we turned to the idea of “quality of work” as a guiding framework to look at respondents’ experiences and perceptions. We asked 16 questions in total derived from this 2018 Carnegie UK-RSA initiative on measuring job quality in the UK which proposes seven distinct dimensions of work quality, including pay and conditions, safety and wellbeing, job design, social support, voice, and work-life balance.

    We also kept in mind that, while support, safety and wellbeing at work are foundational conditions for success, so is effective performance management and the opportunity to apply your skills. In the spirit of Maslow’s hierarchy of needs we clustered our questions broadly into four areas: safety, security, and pay/conditions; the balance between support and challenge; relationships with colleagues; and “self-actualisation” incorporating things like autonomy and meaningfulness.

    For each question, respondents were offered a choice of Strongly disagree, Disagree, Agree, and Strongly agree. Here we report overall levels of agreement (ie Agree and Strongly Agree)

    You can see the full findings for all our comparator groups in the visualisation below.

    [Full screen]

    Headlines on quality of work and interaction with willingness to recommend

    You can see all the workings out below where I’ve gone through the results line by line and reported all the variations we could see, but the TL;DR version is that the quality dimensions that jump out as being experienced comparatively positively are physical safety, good working relationships with colleagues, and meaningfulness of work. Two key areas that emerge as being experienced comparatively negatively are feeling the organisation takes your wellbeing seriously, and opportunities for progression – the level of agreement is startlingly low for the latter.

    We compared the various quality dimensions against whether people would recommend a career in higher education for the whole sample and found that across every question there was a direct correlation between a positive response and likelihood to recommend a career in HE – and the inverse for negative responses. We think that means we’re asking meaningful questions – though we’ve not been able to build a regression model to test which quality questions are making the largest contribution to the recommend question (which makes us sad).

    [Full screen]

    Going through the various comparator groups for the quality of work questions we find that there are three core “at risk” groups – one of which is respondents of a minorised ethnicity, which comes with caveats regarding sample size. Another is those on academic contracts, and the third is disabled respondents. These groups did not consistently respond more negatively to every question on quality of work, but we did find enough differentiation to make it worth raising a flag.

    So to try to see whether we could find some core drivers for these “at risk” groups, we plotted the response to the “recommend” question against the responses to the quality questions just for these groups. At this point the samples for disabled and minoritised ethnic responses become just too small to draw conclusions – for example, under 100 respondents who identified as being of a minoritised ethnicity said they would not recommend a career in HE.

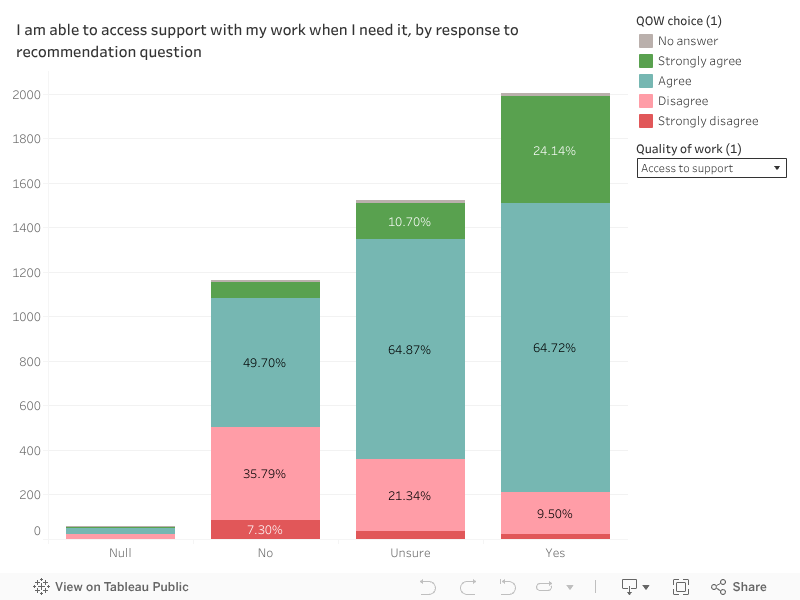
    However, over 400 of those on academic contracts said they would not recommend a career in HE, so we compared the answers of that group to those of respondents on non-academic contracts who also would not recommend a career in HE (just shy of 700 respondents). Interestingly for a number of the quality questions there was no differentiation in response between the groups, but there was noticeable difference for “reasonable level of control over work-life balance”, “able to access support with my work when I need it”, and “opportunities to share my opinion” – in the sense that among the group that would not recommend HE the academic cohort were more likely to give negative responses to these questions, giving a modest indication of possible priority areas for intervention.

    We also found that those who had worked in higher education for five years or fewer were frequently more likely to report agreement with our various propositions about quality work. While there’s clearly some overlap with those early in their career they are not entirely the same group – some may have entered HE from other sectors or industries – though early career respondents do also seem to emerge as having a slightly more positive view as well, including on areas like emotional safety, and wellbeing.

    Safety, security and pay and conditions

    The four statements we proposed on this theme were:

    • I feel reasonably secure in my job
    • I am satisfied with the pay and any additional benefits I receive
    • I feel physically safe at work
    • I feel emotionally safe at work

    On job security, overall two thirds (66.3 per cent) of our sample agreed or strongly agreed that they feel reasonably secure in their job. Those on academic contracts reported lower levels of agreement (57.8 per cent). Those who said they had been employed in higher education for five years or fewer reported higher levels of agreement (71.4 per cent). Respondents who identified as disabled reported slightly lower levels of agreement (61.9 per cent).

    On satisfaction with pay, conditions and additional benefits, overall 63.8 per cent of respondents agreed or strongly agreed that they were satisfied. Those on academic contracts reported lower levels of agreement (56.3 per cent). Those who identified as having a minoritised ethnicity had the lowest levels of agreement of all our various comparators (53.1 per cent), and were twice as likely to strongly disagree that they were satisfied with pay and benefits than those from non-minoritised ethnicities (15.2 per cent compared to 7.9 per cent). Those who identified as disabled had lower levels of agreement (54.6 per cent agreement) compared to those who did not consider themselves disabled (64.9 per cent agreement)

    On physical safety, the vast majority of respondents (95.8 per cent) agreed or strongly agreed they feel physically safe at work with very little variation across our comparator groups. While the overall agreement was similar between men and women, notably men were more likely to register strong agreement (66.3 per cent) than women (51.9 per cent).

    On emotional safety the picture is more varied. Overall 72 per cent agreed or strongly agreed they feel emotionally safe at work. Those who reported being earlier in their career reported higher levels of agreement (78.6 per cent), as did those who reported having worked in the HE sector for five years or fewer (78.6 per cent). Those with academic contracts reported lower levels of agreement (61.62). Those who identified as having a minoritised ethnicity had lower levels of agreement (62.7 per cent) and were more than twice as likely to strongly disagree they feel emotionally safe at work than those who are not minoritised (14.2 per cent compared to 6.1 per cent).

    Balance, challenge, and performance

    The four statements we proposed on this theme were:

    • The work I do makes appropriate use of my skills and knowledge
    • I have a reasonable level of control over my work-life balance
    • My organisation demonstrates that it takes my wellbeing seriously
    • My organisation demonstrates that it takes my performance seriously

    On using skills and knowledge 79.2 per cent of our sample agreed or strongly agreed that their work makes appropriate use of their skills and knowledge. There was very little variation between comparator groups – the one group that showed a modest difference was those who reported being disabled, whose agreement levels were slightly lower at 75.3 per cent.

    On control over work-life balance, 80.7 per cent of our sample agreed or strongly agreed they have a “reasonable” level of control. Those who had worked in higher education for five years or fewer were more likely to agree (87.2 per cent). 86.5 per cent of those who work from home agreed, compared to 74.4 per cent of those who work on campus or onsite, and 81.7 per cent of those who have hybrid or flexible working arrangements. Those who reported having leadership responsibilities had lower levels of agreement (78.9 per cent) compared to those who did not (85.9 per cent).

    The biggest difference was between those on academic contracts (66 per cent agreement) and those on non-academic contracts (85.3 per cent agreement). There were also slightly lower scores for disabled respondents (74.7 per cent compared to 81.2 per cent for non-disabled respondents) and for minoritised ethnicities (76.6 per cent compared to 81 per cent for non-minoritised ethnicities).

    On wellbeing, 57.8 per cent of our sample agreed or strongly agreed that their organisation demonstrates that it takes their wellbeing seriously. This was higher for early-career respondents – 60 per cent agreement compared to 57.9 per cent for those in mid-career, and 55.5 per cent for those approaching the end of their career. Agreement was higher for those with five years or fewer in higher education at 68.4 per cent agreement, compared with 54.5 per cent for those with more than 20 years’ experience.

    Those on academic contracts were substantially less likely to agree with only 39.7 per cent agreement that their organisation demonstrates that it takes their wellbeing seriously. Disabled respondents were also much less likely to agree than non-disabled respondents, at 47.7 per cent and 59 per cent respectively. Those working from home reported slightly lower levels of agreement, at 52.6 per cent.

    On performance, 63.1 per cent of our sample reported that their organisation demonstrates that it takes their performance seriously. This was slightly higher for those who had five years or fewer in higher education, at 69.6 per cent. Again, there was a difference between those on academic contracts with 57.8 per cent agreement and those on non-academic contracts, with 64 per cent agreement. Disabled respondents were slightly less likely to agree (58 per cent agreement) than non-disabled (63.8 per cent agreement).

    Relationships with colleagues

    The four statements we proposed on this theme were:

    • I am able to access support with my work when I need it
    • I am given sufficient opportunities to share my opinion on matters that affect my work
    • For the most part I have a good working relationship with my colleagues
    • I generally trust that the people who work here are doing the right things

    On accessing support, 76.2 per cent of our sample agreed they are able to access support when they need it. There was higher agreement among those early in their career at 81.3 per cent, and similarly among those who had worked five years or fewer in HE, at 82.8 per cent. There was lower agreement among those on academic contracts: 62.3 per cent agreement versus 80.5 per cent for those on non-academic contracts. Those from a minoritised ethnicity had lower agreement at 70.6 per cent, as did disabled respondents at 67.4 per cent.

    On opportunities to share opinion, 70.4 per cent of our sample agreed or strongly agreed they were given sufficient opportunities to share their opinion on matters that affect their work. There was a small difference between those who held a leadership role and those who did not, at 71.9 per cent and 66 per cent agreement respectively. Again, those on academic contracts had lower levels of agreement, at 58.2 per cent compared to 73.9 per cent for those on non-academic contracts. Disabled staff also had lower agreement at 60.9 per cent.

    On working relationships, cheeringly, 96.1 per cent of our sample agreed or strongly agreed they have good working relationships with their colleagues. While this held true overall across all our comparator groups regardless of leadership roles, working location, personal characteristics or any other factor, notably those of a minoritised ethnicity strongly agreed at a lower rate than those who did not identity as being from a minoritised ethnicity (39.6 per cent strong agreement compared to 48.3 per cent).

    On trust, 70.8 per cent of our sample agreed or strongly agreed that they generally trust the people they work with are doing the right things. This was very slightly lower among those who work from home or remotely, at 65.9 per cent. Agreement was lower among those on an academic contract, at 61.6 per cent, compared to 73.4 per cent of those on a non-academic contract. Agreement was also lower among disabled respondents, at 63.8 per cent.

    “Self-actualisation”

    The four statements we proposed on this theme were:

    • My current job fits with my future career plans and aspirations
    • I am comfortable with the level of autonomy I have in my job
    • There are sufficient opportunities for progression from this job
    • The work I do in my job is meaningful

    On career plans, 76.1 per cent of our sample agreed or strongly agreed that their current job fits with their future career plans and aspirations. Those who said they work from home or remotely had slightly lower levels of agreement at 69.3 per cent. Those who said they do not have any kind of leadership role had slightly lower levels of agreement at 69.4 per cent.

    On autonomy, 82.5 per cent of our sample agreed or strongly agreed they were comfortable with the level of autonomy they have in their job. Those with an academic contract had very slightly lower levels of agreement at 77.9, compared to 83.8 per cent agreement among those on non-academic contracts. Those of a minoritised ethnicity had lower levels of agreement at 73.9 per cent, as did disabled respondents, at 75.9 per cent agreement.

    On progression, a startling 29.5 per cent agreed or strongly agreed that there are sufficient opportunities for progression from their current position. There was a modest difference between those with leadership roles, 31.1 per cent of whom agreed, compared to 25 per cent of those without a leadership role. Those on academic contracts had higher levels of agreement at 38.5 per cent, compared to 26.8 per cent of those on non-academic contracts.

    On meaningful work, 86.1 per cent of our sample agreed or strongly agreed that the work they do in their job is meaningful. Those who work from home or remotely had very slightly lower levels of agreement at 77.9 per cent but otherwise this held true across all our comparator groups.

    Aspiration to lead and preparedness to lead

    We asked about whether respondents aspire to take on or further develop a leadership role in higher education, and if so, whether they are confident they know what a path to leadership in higher education involves in terms of support and professional development. These questions are particularly relevant given the generally negative view about opportunities to progress held by our survey respondents.

    [Full screen]

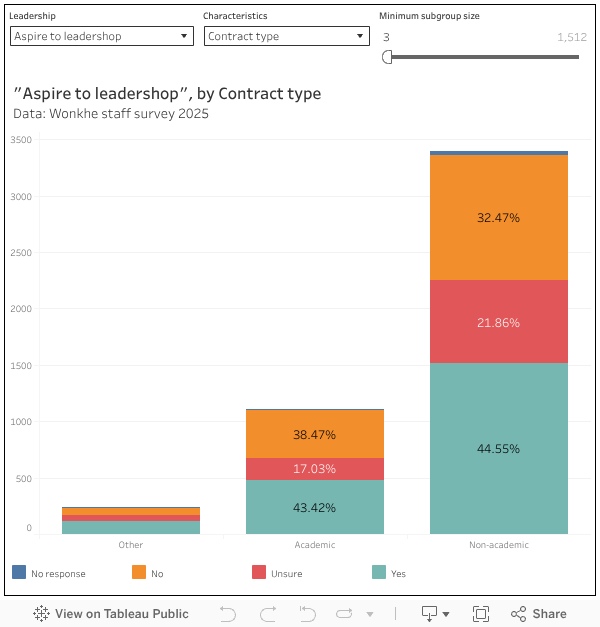
    Overall, 44.5 per cent of our sample said they aspire to take on or further develop a leadership role. Curiously, this was only slightly higher for those who already have some level of leadership responsibility, at 48.3 per cent. This can be explained to some degree by differentiation by career stage: 58.8 per cent of early career respondents aspired to take on or develop leadership roles, as did 50.9 per cent of mid-career respondents.

    Aspiration to lead was higher among those identifying as lesbian, gay, or bisexual at 52.6 per cent compared to 43.2 per cent for those who did not. Aspirations were also higher among respondents of a minoritised ethnicity, at 54.5 per cent, compared to 43.8 per cent among those not of a minoritised ethnicity.

    We also asked respondents whether they are confident they know what a path to leadership involves in terms of support and professional development, where we found some important variations. Confidence about pathways to leadership was lower among early career respondents, at 22.8 per cent agreement, and even mid-career respondents confidence was lower than the numbers reporting they aspire to leadership, at 36.6 per cent.

    While there was no difference in aspiration between respondents on academic contracts and those on non-academic contracts, those on academic contracts were more likely to say they are confident they know what a path to leadership involves, at 50.3 per cent compared to 34.8 per cent.

    While there was no difference in aspiration between men and women respondents, women were slightly less likely than men to report confidence in knowing about the path to leadership, at 37.5 per cent compared to 42 per cent. Those who identify as lesbian, gay or bisexual, those of a minoritised ethnicity, and disabled respondents were also slightly less likely than their comparator groups to express confidence, despite having expressed aspiration to lead at a higher rate.

    These findings around demographic difference suggest that there remains some work to be done to make leadership pathways visible and inclusive to all.

    We’ll be picking up the conversation about sustaining higher education community during tough times at The Festival of Higher Education in November. It’s not too late to get your ticket – find out more here.

    Source link

  • Exploring the motivation and satisfaction of higher education staff

    Exploring the motivation and satisfaction of higher education staff

    For all the criticisms leveled at the sector as a group of employers, the number of staff working in higher education keeps on growing.

    Understanding why they choose to work in higher education, what they value about their work, and how well the organisation they work for lives up to their expectations can help inform questions about what matters the most when resources are tight – pay and conditions are obviously important but people work in HE for a whole range of reasons, and not all of those expectations require resource to meet.

    In our summer staff survey we gathered nearly 5,000 responses on these topics from people who currently work in or around the sector. We don’t make any claims that this is a representative sample – we can’t say with certainty what the sector as a whole feels but comparing similar groups of staff (for example by contract type) with each other yields fascinating insights and points the way towards understanding this fundamental issue.

    For our motivation question bank we presented a range of possible motivations as follows:

    • Working in an organisation whose values I share
    • Opportunities for learning, development and professional growth
    • Working alongside and collaborating with like-minded colleagues
    • The generosity of the pay and benefits package
    • Having the autonomy to focus on the work that is important to me
    • Having a level of flexibility about where and when I work
    • My physical working environment and the resources I have access to within it
    • Receiving recognition for my hard work and contribution
    • Knowing the work I do makes a positive impact – on students, on the advancement of knowledge, on my community
    • Working in an organisation that I am confident is generally well run, and achieving its objectives
    • Having opportunities to engage in activities that enhance community connection eg networks, clubs and groups, volunteering, public lectures etc

    Then we asked people whether they felt each was an “important” motivation, and whether they were “happy” with their organisation’s performance against each one. A “yes” answer means that someone was happy, or agreed something was important.

    We’re not running any fancy statistics here, but our working assumption is that a difference of more than four percentage points between different groups is interesting and notable enough to report on. This would vary by the size of the groups in question.

    Two sectors?

    We don’t know for sure (it isn’t data that we collect via HESA for the population) but there’s as many professional and support services staff as there are academics. And the former are far more likely to have experience working outside higher education – from the responses to our staff survey we see that around 80 per cent of our professional and support staff had worked outside the sector, compared to 64 per cent of academics, though those numbers might be lower in both instances had we specifically excluded casual work such as temporary work while studying.

    The cliché of the unworldly professor in an ivory tower is clearly being left in the past – but the kinds of roles done by professional services staff are in demand right across the economy. On the face of it is far easier for them to find work elsewhere, and given the state of the sector, you’d assume this might be better paid.

    Given this, it was surprising to see that while 68.8 per cent of academic respondents cited pay and benefits packages as something that was important to them, nearly three quarters of professional and support staff found this area of the working experience important.

    In asking these kinds of questions you almost don’t expect people to say they are happy with their pay and benefits – so more than 40 per cent of our professional services respondents doing so is notable. After all, we hear enough from the various sector professional associations about the difficulty of recruiting and retaining skilled staff in a variety of key roles.

    [Full screen]

    Relative importance

    Of all the suggested motivations for working in higher education, only two were not selected as important by more than 80 per cent of respondents: pay and conditions (73.5 per cent) and having opportunities to engage in activities that enhance community connection (41.4 per cent) – the latter scoring significantly lower than every other suggestion.

    The three most important motivations selected were “knowing the work I do makes a positive impact” (87.5 per cent), “Working alongside and collaborating with like-minded colleagues” (86.9 per cent) and “Working in an organisation I am confident is generally well run” (84.5 per cent).

    Looking at the areas where there was the largest gap between those who said something was important to them and those that agreed they are happy with the extent they get to experience it in their working lives, by far the largest gap relates to confidence the organisation is run well and is achieving its objectives, only 31.7 per cent saying they are happy with this, a gap of 52.8 percentage points.

    The next highest gap relates to recognition: whereas 80.4 per cent of respondents said receiving recognition for their hard work and contribution was important, only 33.3 per cent said they were happy with this – a gap of 47.1 percentage points.

    The third highest gap was in opportunities for learning, development and professional growth: whereas 83 per cent of respondents said this was important, only 44.3 per cent said they were happy with this, a gap of 38.7 percentage points.

    Free as in freedom

    Academic respondents were far more likely to cite autonomy to focus on the work that is important to them as a key motivating factor (86.7 per cent), but the number is still high for other staff (79.6 per cent), whereas professional services staff (83.5 per cent) were slightly more likely than academics (79.9 per cent) to cite flexibility in when and where they work.

    Staff of all kinds are reasonably happy (c.65 per cent) with the levels of flexibility on offer. Clearly the experiences of Covid-19, and perhaps the drive for providers to rationalise estates – swapping offices for desks, or regular desks for hot desks – is also having an impact. You might expect that women would be more likely to value flexibility in working and you would be right – 84.8 per cent of women in our sample said this was important to them, compared to 76.5 per cent of men. However, similar proportions of men and women (around 65 per cent) reported being happy with the amount of flexibility on offer.

    In terms of autonomy – the ability that a member of staff has to focus on work that is important to them – a little under half of both academic and professional staff were happy with what was on offer. It is worth bearing in mind that autonomy is always limited in some way in any role; for example, marking and exam boards pretty much need to happen when they do.

    Value judgement

    Despite frequent accusations of cultural relativism, a strength of universities is their values. Intriguingly, 60 per cent of professional services staff by just 45 per cent of academics were happy with the way that this manifests – despite similar levels of importance (85.8 per cent for academics, 82.7 per cent for professional) being placed on sharing the values of the organisation one works for.

    If we think back to the idea that professional services staff would be more likely to work in other sectors, this does make sense. Values, and the sense of having a positive impact (86 per cent said this was important to them), are clearly going to be key motivations to work in a sector where perhaps pay and conditions don’t stack up.

    An amazing 90 per cent of academic staff said that knowing that the work they did has a positive impact (on students, the advancement of knowledge, and/or on their community) was important to them. But just 53 per cent of academics and of professional staff saw this in practice. To be fair, this was one of the best performing motivations in our survey – but it is interesting that staff are no longer seeing the good that higher education does, especially when it is becoming so important to make this case culturally and with the government.

    Recommend to others

    It’s easy to get disheartened when you think about the staffing needs of higher education providers and how they are met. Although academics are clamouring to work in the UK sector, it feels like the terms and conditions are worsening and newer staff – in particular – are getting a raw deal. With professional staff, the fact that many specialisms can get better paid work elsewhere has some wondering about the quality of the staff we are able to recruit.

    We asked all of our respondents whether they would recommend working in the sector to someone they cared about – and perhaps surprisingly three-quarters said “yes” or “maybe”. And there was very little difference between those making “yes”, “no”, or “maybe” on any of the motivation axes we discuss above (those who said “yes” were very marginally less likely to say pay and benefits were important to them).

    However those that were more likely to recommend the sector to others were significantly happier with every aspect we examined. In contrast more than 80 per cent of those who would not recommend working in the sector were not happy with the amount of recognition they got for their hard work and contribution, and more than 85 per cent felt that their organisation was not run well. Recommendation is generally considered a good proxy for job satisfaction, and this survey seems to bear that out.

    What people want to change

    We asked respondents to say more where they had identified a gap between something they consider to be important, but the degree to which they are happy with the extent they actually experience that.

    There were comments on workload and wellbeing, small-scale or systemic failures to offer recognition for achievement and, particularly from those in professional services, a desire for greater recognition, and development and/or progression opportunities. Some commented that the economic environment makes these asks more difficult.

    But in terms of messages for leaders there is a lot about communication and consultation – a sense that the people who work in the sector understand the financial problems the university faces but want to be told the truth about them and be constructive in helping to solve them.

    Clearer lines of communication and wider consultation on significant changes.

    Greater dialogue with leaders when major decisions are made which impact the way in which I can carry out my role and an opportunity to demonstrate my expertise to build trust in my decision making.

    Clear, transparent and timely sharing of strategy and the impact of the changes to come from the changes.

    Another challenge is on the perceived values driving strategy and tactics – there’s a sense that management decisions are perceived as being short term, and that it is financial expediency rather than an underlying (and shared) purpose that is informing decisions.

    There’s also commentary on issues around execution of strategy – the sense that while plans are spoken about they are not always put into practice or cascaded down the institution, or become snarled in bureaucracy.

    Greater consistency, both between faculties and also on strategic planning. At the moment there are so many different initiatives that, while we talk about working smarter, the opposite is actually the case.

    We need a clear strategy as to how we are going to get through the next couple of years which needs to be properly communicated. At the moment it feels like we are stuck in a vortex of chaos, with school level projects being put on hold whilst we wait for university level decisions, but the months go by and no meaningful direction or plan seems to be in place.

    Better delegation and direction from above, more collaboration across the institution as a whole but also with core departments where the work intercepts with others work, creating a network of colleagues in those core teams.

    A key takeaway is that the kind of organisational complexity in decision-making that has long been tolerated in higher education may not serve staff well when resources are stretched and bandwidth is low. Complexity may serve various legitimate organisational purposes but it can also cut staff off from understanding what’s happening, and what they personally need to do about it. It also creates a lack of consistency as multiple messages emerge from different quarters.

    But also, while we were specifically focused on areas for improvement, it’s worth adding that a good few comments gave a general thumbs up – their working environment was clearly motivating them in the right ways – and that shows that it can be done.

    The biggest risk of an exercise like this one is to suggest that where there is discontent or concern, that it is attributable to the wider environment, and not something that can be addressed or mitigated. While there’s clearly very little scope in most institutions to roll out shiny new initiatives, most comments suggest that some attention to hygiene factors – praise, involvement, honesty – could make a difference in sustaining staff motivation during these trying times.

    We’ll be picking up the conversation about sustaining higher education community during tough times at The Festival of Higher Education in November. It’s not too late to get your ticket – find out more here.

    Source link

  • Responsible recruitment means fostering diverse leadership potential

    Responsible recruitment means fostering diverse leadership potential

    Unfortunately, it is no secret that the higher education sector has a long way to go when it comes to equity in progression to senior leadership.

    While the number of staff from global majority ethnic backgrounds in universities has nearly tripled over the last 20 years (now c. 24 per cent), HESA data shows that still only 3.8 per cent of black academics in the UK hold the title of Professor, and less than one per cent of all professors in the UK are black. Though there has been an incredible 93.8 per cent increase since 2012–13, still only 30.8 per cent of professors in the UK identify as women. There has been real progress, but it has been slow.

    Recruitment from the inside

    In our position as a consultancy supporting talent development across higher education and wider sectors driven by social purpose, we’re constantly reminded of the barriers faced by global majority candidates in recruitment processes. We see selection bias; we see lack of communication and clarity around promotion criteria; we see challenges in individual confidence and imposter syndrome; we see anxiety around tokenism.

    There’s additionally a risk that diversity is becoming less of a priority in these times of financial challenge, when obvious questions around sustainability come to the fore. With many institutions going through restructures and cost-saving exercises, executive boards are under enormous pressure to justify any new appointments and associated expenditure. The ability to lead change, diversify income streams, and drive growth with limited resources are now constant topics in our conversations with candidates for senior roles.

    In part due to these pressures, recruitment panels seem increasingly less willing to think widely when appointing to leadership roles. There is often an increased sense of perceived risk when considering candidates from other sectors, overseas, or who would be taking a step up into the role, rather than making a sideways move. As domestic funding challenges worsen, international student numbers continue to decline, and operational costs rise across the sector, there’s understandably often a preference for candidates who have “been there, done that.” This has obvious implications for overall diversity in the sector.

    Though there has been some improvement, staff from global majority backgrounds are still disproportionately concentrated in lower-level roles and underrepresented in senior roles across the sector. It is less likely that a candidate from a global majority background will be in a position to make such a sideways move for a senior role. In our search work, we encourage committees to place a greater emphasis on capability and competence, alongside experience, and to consider which essential requirements on the job description might be more flexible than others. We do also see a growing recognition that things have to change and a genuine commitment to strive for greater representation at all levels.

    As headhunters, we have to strike a difficult balance between supporting and challenging the organisations we work with, particularly around such questions of equity of opportunity and perceived risk. We are committed to making a difference on a very practical level, and we work closely with clients and candidates to find ways to make our search processes more equitable. We take time in briefings meetings to really get a feel for the culture of each organisation we work with; we advise on the accessibility of recruitment material; and we structure interview processes so candidates can engage with an opportunity and organisation in multiple fora, for example.

    There is an inherent limitation to the work that we do as advisors on senior appointment processes, however. Through the lists of candidates we bring together for a role, and the way we support candidates and panels through these processes, we can have a direct impact on the individual and organisation, but we often feel that the most positive impact we can have on the composition of senior teams is through our broader leadership development work.

    Insider information

    We’ve been involved in the London Higher Global Majority Mentoring Programme for the last few years. In our annual masterclass with the programme’s participants, we discuss practical topics about engaging with opportunities for development and progress including at the level of CVs and cover letters, navigating informal interviews, internal marketing, and LinkedIn. We aim to demystify the recruitment process and help equip them with some tools to help them move into their next leadership positions. These topics are framed in the context of structural barriers to progression facing individuals from marginalised groups, which often hold candidates back from bringing their authentic selves to recruitment processes.

    We often hear about candidates’ experience of covering parts of their identities in interviews, feeling imposter syndrome when interviewing with a panel of white senior leaders, and concern around being a “token” on a shortlist.

    Several years ago, we developed Aspire, which is a pro-bono programme that supports mid-career professionals from global majority ethnic backgrounds as they work to move into senior leadership positions. The programme runs over six months and explores themes such authenticity and leadership profiles alongside practical approaches to promotion and recruitment. The programme aims to create a space in which participants can share their lived experience and create a community of practice as they look for their next role.

    Launched last year, Board Prospects pairs individuals from historically under-represented groups with non-executive boards. The participants join the board without voting rights for a year, before being appointed as full members.

    Participants across the programmes we work on have reported promotions, external job offers and more – though it is of course impossible to determine exactly how much the specific programme contributed to this success. The most significant impact reported is often the networks created through the sessions, and the sense of empowerment which can develop from a space in which experiences, support, and advice are shared safely. We’ve seen research collaborations, invitations to conferences and more emerge from these communities of practice.

    Our involvement in the Global Majority Mentoring Programme, and our work on our own leadership development programmes, is valuable in helping us shape our executive search work to be as inclusive and equitable as possible. We’ve learnt (and continue to learn) a huge amount from the programmes and their participants. Through hearing about participants’ lived experiences of career progression, we learn more about where we can provide the best support for development, and how we might advise clients on the “sticking points” in recruitment processes which can be especially limiting or off-putting to individuals from underrepresented groups.

    We also recognise that recruiting diverse talent is just one step in building inclusive and equitable organisations. Creating an environment in which staff from marginalised groups can thrive and progress requires a much more holistic approach that seeks to fundamentally change working cultures. Our work with individual institutions, such as the LEAP into Leadership Programme with the University of Greenwich, in which a group of mid-career delegates from global majority ethnic backgrounds are formally paired with a senior sponsor within the institution, has also stressed to us the need to acknowledge and engage with structural barriers and allyship at all levels of an institution if we are to ever meaningfully break down barriers to senior leadership.

    While recognising the huge amount of work that still needs to be done, and the ever-growing challenges facing universities across the UK, we’re hopeful that collaborative schemes like the Global Majority Mentoring Programme, alongside a commitment to challenging and adapting recruitment processes, can ultimately have a real impact in creating more diverse leadership teams which better reflect society and are best equipped to deal with sector challenges.

    This article is one of four exploring London Higher’s Global Majority Mentoring Programme – you can find the others here.

    Source link

  • More comprehensive EDI data makes for a clearer picture of staff social mobility

    More comprehensive EDI data makes for a clearer picture of staff social mobility

    Asking more granular EDI questions of its PGRs and staff should be a sector priority. It would enable universities to assess the diversity of their academic populations in the same manner they have done for our undergraduate bodies – but with the addition of a valuable socio-economic lens.

    It would equip us more effectively to answer basic questions regarding how far the diversity in our undergraduate community leads through to our PGT, PGR and academic populations, as well as see where ethnicity and gender intersect with socio-economic status and caring responsibilities to contribute to individuals falling out of (or choosing to leave) the “leaky” academic pipeline.

    One tool to achieve this is the Diversity and Inclusion Survey (DAISY), a creation of Equality, Diversity and Inclusion in Science and Health (EDIS) and the Wellcome Trust. This toolkit outlines how funders and universities can collect more detailed diversity monitoring data of their staff and PGRs as well as individuals involved in research projects.

    DAISY suggests questions regarding socio-economic background and caring responsibilities that nuance or expand upon those already in “equal opportunities”-type application forms that exist in the sector. DAISY asks, for example, whether one has children and/or adult dependents, and how many of each, rather than the usual “yes” or “no” to “do you have caring responsibilities?” Other questions include the occupation of your main household earner when aged 14 (with the option to pick from categories of job type), whether your parents attended university before you were 18, and whether you qualified for free school meals at the age of 14.

    EDI data journeys across the sector

    As part of an evolving data strategy, UCAS already collects several DAISY data points on their applicants, such as school type and eligibility for free school meals, with the latter data point is gaining traction across the university sector and policy bodies as a meaningful indicator for disadvantage.

    Funders are interested in collecting more granular EDI data. The National Institute for Health and Care Research (NIHR), for example, invested around £800 million in the creation of Biomedical Research Centres in the early 2020s. The NIHR encouraged the collection of DAISY data specifically on both the researchers each centre would employ and the individuals they would research upon, in the belief (see theme four of their research inclusion strategy) that a diverse researcher workforce will make medical science more robust.

    The diversity monitoring templates attached to recent UKRI funding schemes similarly highlight the sector’s desire for more granular EDI data. UKRI’s Responsive Mode Scheme, for example, requires institutions to benchmark their applicants against a range of protected characteristics, including ethnicity, gender, and disability, set against the percentage of the “researcher population” at the institution holding those characteristics. The direction of travel in the sector is clear.

    What can universities do?

    Given the data journeys of UCAS and funding bodies, it is sensible and proportionate, therefore, that universities ask more granular EDI questions of their PGRs and their staff. Queen Mary began doing so, using the DAISY toolkit as guide, for its staff and PGRs in October 2024, alongside work to capture similar demographic data in the patient population involved in clinical trials supported by Queen Mary and Barts NHS Health Trust.

    While we have excellent diversity in our undergraduate community, we see less in our PGR and staff communities, and embedding more granular data collection into our central HR processes for staff and admissions processes for PGRs allows us to assess (eventually, at least, given adequate disclosure rates) how far the diversity in our undergraduate population leads through to our PGT, PGR and academic population.

    Embedding the collection of more granular EDI data into central HR and admissions systems required collaboration across Queen Mary’s Research Culture, EDI, and HR teams, creating new information forms and systems to collect the data while ensuring it could be linked to other datasets. The process was also quickened by a clinical trials unit in our Faculty of Medicine & Dentistry who had piloted the collection of this data already on a smaller scale, providing a proof of concept for our colleagues in HR.

    EDI data and the PGR pipeline

    Securing the cooperation of our HR and EDI colleagues was made easier thanks to our doctoral college, who had already incorporated the collection of more granular EDI data into an initiative aimed at increasing the representation of Black British students in our PGR community: the STRIDE programme.

    Standing for “Summer Training Research Initiative to Support Diversity and Equity”, STRIDE gives our BAME undergraduate students the opportunity to undertake an eight-week paid research project over the summer, alongside a weekly soft skills programme including presentation and leadership training. Although the programme has run annually since 2020 with excellent outcomes (almost 70 per cent of the first cohort successfully applied to funded research programmes), incorporating more granular EDI questions into the application form for the 2024 cohort of 425 applicants highlighted intersectional barriers to postgraduate study faced by our applicants that would have been obscured had we only collected basic EDI data.

    Among other insights, 47 per cent of applicants to STRIDE had been eligible at some point for free school meals. This contrasts with our broader undergraduate community, 22 per cent of whom were eligible for free school meals. Some 55 per cent of applicants reported that neither of their parents went to university, and 27 per cent reported that their parents had routine or semi-routine manual jobs. Asking questions beyond the usual suite of EDI questions allows us here to picture more clearly the socio-economic and cultural barriers that intersect with ethnicity to make entry into postgraduate study more difficult for members of underrepresented communities.

    The data chimed with internal research we conducted in 2021, where we discovered that many of the key barriers to our undergraduates engaging in postgraduate research were the same as those who were first in family to go to university, namely lack of family understanding of a further degree and lack of understanding regarding the financial benefits of completing a postgraduate research degree.

    Collecting more granular EDI data will allow us to understand and support diversity that is intersectional, while enabling more effective assessment of whether Queen Mary is moving in the right direction in terms of making research degrees (and research careers) accessible to traditionally underrepresented communities at our universities. But collecting such data on our STRIDE applicants makes little sense without equivalent data from our PGR and academic community – hence Queen Mary’s broader decision to embed DAISY data collection into its systems.

    The potential of DAISY

    As Queen Mary’s experience with STRIDE demonstrates, nuancing our collection of EDI data comes with clear potential. Given adequate disclosure rates, collecting more granular EDI data makes possible more effective intersectional analyses of our PGRs and staff across our sector, and helps understand the social mobility of our PGRs and staff with more nuance, leading to a clearer image of the journey that those from less privileged social backgrounds and/or those with caring responsibilities face across our sector.

    More broadly, universities will always be crucial catalysts of social mobility, and collecting more granular data on socio-economic background alongside the personal data they already collect – such as gender, ethnicity, religion and other protected characteristics – is a logical and necessary next step.

    Source link

  • Did union fights for better conditions unintentionally casualise the workforce? – Campus Review

    Did union fights for better conditions unintentionally casualise the workforce? – Campus Review

    A new research paper has investigated the factors that have “legitimised” the creation and acceptance of a casual academic workforce in Australia.

    Please login below to view content or subscribe now.

    Membership Login

    Source link

  • Professional services staff need equal recognition – visibility in sector data would be a good start

    Professional services staff need equal recognition – visibility in sector data would be a good start

    Achieving recognition for the significant contribution of professional services staff is a collaborative, cross-sector effort.

    With HESA’s second consultation on higher education staff statistics welcoming responses until 3 April, AGCAS has come together with a wide range of membership bodies representing professional services staff across higher education to release a statement warmly welcoming HESA’s proposal to widen coverage of the higher education staff record to include technical staff and professional and operational staff.

    By creating a more complete staff record, HESA aim to deliver better understanding of the diverse workforce supporting the delivery of UK higher education. AGCAS, together with AHEP, AMOSSHE, ASET, CRAC-Vitae, NADP and UMHAN, welcome these proposals. We have taken this collaborative approach because we have a common goal of seeking wider recognition for the outstanding contributions and work of our members in professional services roles, and the impact they make on their institutions, regions, graduates and students.

    A matter of visibility

    Since the 2019–20 academic year, higher education providers in England and Northern Ireland have had the option to return data on non-academic staff to HESA. However, this has led to a lack of comprehensive visibility for many professional services staff. In the 2023–24 academic year, out of 228 providers only 125 opted to return data on all their non-academic staff – leaving 103 providers opting out.

    This gap in data collection has raised concerns about the recognition and visibility of these essential staff members – and has not gone unnoticed by professional services staff themselves. As one AGCAS member noted:

    Professional service staff have largely remained invisible when reporting on university staff numbers. Professional services provide critical elements of student experience and outcomes, and this needs to be recognised and reflected better in statutory reporting.

    This sentiment underscores the importance of the proposed changes by HESA, and the reason for our shared response.

    Who is and is not

    A further element of the consultation considers a move away from the term “non-academic” to better reflect the roles and contributions of these staff members and proposes to collect data on staff employment functions.

    Again, we collectively strongly support these proposed changes, which have the potential to better understand and acknowledge the wide range of staff working to deliver outstanding higher education across the UK. The term non-academic has long been contentious across higher education. While continuing to separate staff into role types may cause issues for those in the third space, shifting away from a term and approach that defines professional services staff by othering them is a welcome change.

    As we move forward, it is essential to continue fostering collaboration and mutual respect between academic and professional services staff. Challenging times across higher education can create or enhance partnership working between academic and professional services staff, in order to tackle shared difficulties, increase collaboration and form strategic alliances.

    A better environment

    By working in this way, we can create a more inclusive and supportive environment that recognises the diverse contributions of all staff members, ultimately enhancing outcomes for all higher education stakeholders, particularly students.

    Due to the nature of our memberships, our shared statement focuses on professional services staff in higher education – but we also welcome the clear focus on operational and technical staff from HESA, who again make vital contributions to their institutions.

    We all know that representation matters to our members, and the higher education staff that we collectively represent. HESA’s proposed changes could help to start a move towards fully and equitably recognising the vital work of professional services staff across higher education. By expanding data collection to include wider staff roles and moving away from the term “non-academic”, we can better understand and acknowledge the wide range of contributions that support the higher education sector.

    This is just the first step towards better representation and recognition, but it is an important one.

    Source link

  • Job titles matter for inclusive and meaningful work

    Job titles matter for inclusive and meaningful work

    Job titles, and the names given to organisational roles, are important for the meaning that individuals derive from their work and their engagement with their work.

    Yet within many UK universities, and especially the post-92s, the trend is towards new job titles with potentially negative connotations for the job holders in terms of the meaning of their work and their commitment to it and to their institution.

    Such universities have been moving away from the conventional “lecturer” titles, adopting the US system of titles. US institutions typically designate their junior (un-tenured) academics as Assistant Professors, with an intermediate grade of Associate Professor and then a full Professor grade. Within the US system, most long serving and effective staff can expect to progress to full Professor by mid-career.

    Yet, in this new UK system, only around 15-20 per cent of academics are (and likely ever to be) full Professors and many academics will spend their entire careers as Assistant Professors or Associate Professors, retiring with one of these diminutive job titles.

    The previous, additive, job titles of Lecturer to Senior Lecturer and then to Principal Lecturer or Reader had meaning outside the university and, crucially, had meaning for the post-holders, giving a sense of achievement and pride as they progressed. Retiring as a Senior or Principal Lecturer was deemed more than acceptable.

    Status and self-esteem

    It is not hard to imagine the impact that the changes in job titles is having upon mid and late-career academics who may have little chance of gaining promotion to full professor, perhaps because quite simply they draw the line at working “just” 60 hours a week, 50 weeks a year. The impact on status and self-esteem is immense. Imagine explaining to your grandkids that you are, in essence, an assistant to a professor. As an Associate Professor, and particularly in a vocational discipline, one of the authors is often asked, “I can understand you wanting to work part-time for a university, but what’s your main job?” Associate, affiliate, adjunct – these names are pretty much the same thing to outsiders.

    Managerially, though, the change from designating academics as Senior Lecturer to Assistant Professors and from Principal Lecturers to Associate Professors is genius. These diminutive job titles confer inferiority – but with the promise that if you keep your nose to the grindstone and keep up the 60+ hour weeks, 50 weeks a year, you might be in with a chance of a decent job title, as a professor. What a fantastic, and completely friction-free, way of turning the performative screw.

    The UK university sector is not alone and other public sector organisations have similarly got into a meaning muddle from the naming of their jobs. For example, in the British civil service, a key middle management role is labelled “Grade B2+”, whereas a relatively junior operational role is designated a rather grand sounding “Executive Officer”. And just last autumn, the NHS acknowledged that names do matter, abandoning the designation of “junior” doctor which was used to encompass all medics that sit within the grades below what is known as “consultant”, and which their union described as “misleading and demeaning” – it’s been replaced with “resident” doctor.

    Meaningful work

    A name gives meaning to workers. It gives status, prestige, and identity. While those organisations such as universities who fail to realise the importance of job titles may be able to turn the screw in the short-term, extracting ever more work from their junior-sounding Assistant and Associate Professors, they will in the longer-term, for sure, have an ever more demoralised and demotivated workforce for whom the job has little meaning other than the pay.

    And, since pay for university academics in the UK has been so badly eroded in recent decades, job title conventions are a self-inflicted injury – one that risks academics’ engagement and wellbeing and, ultimately, their institutions’ performance.

    Source link

  • HESA Spring 2025: staff | Wonkhe

    HESA Spring 2025: staff | Wonkhe

    HESA Spring 2025 kicks off in earnest with a full release of the staff data for 2023-24.

    Unlike in previous years, there’s been no early release of the headlines – the statistics release (which provides an overview at sector level) and the full data release (which offers detail at provider level) have both turned up on the same day.

    Staff data has, in previous years, generally been less volatile than student data. Whereas recruitment can and does lurch alarmingly around based on strategic priorities, government vacillation about student visas, and the vagaries of the student market – staff employment tends to be something with a merciful degree of permanency. Even if it isn’t the same staff working under the same terms and conditions, it does tend to need broadly the same number of people.

    With the increasing financial pressures felt by universities you would expect 2023-24 to be a deviation from this norm.

    Starters and leavers

    We’ll start by looking at the numbers of starters and leavers from each provider. This chart shows the change in academic staff numbers year on year between your chosen year and the year before (as the thick bars) and the total number of full and part time staff in the year of your choice (as the thin bars). Over on the other side of the visualisation under the controls you can see total staff numbers, broken down into full and part time as a time series – mouse over a provider on the main chart to change the provider focus here. You can filter by year, and (for the main chart) mode of employment.

    [Full screen]

    What’s apparent is that across quite a lot of the sector academic staff numbers didn’t change that much. There were some outliers at both end – Coventry University had 585 less academic staff in 2023-24 than 2022-23, while Cardiff University has 565 more (yes, the same Cardiff University that confirmed plans for 400 full time redundancies yesterday).

    If you’ve been following sector news this may surprise you – last year saw many providers announce voluntary or compulsory redundancies. The Queen Mary University of London UCU branch has been tracking these announcements over time.

    Schemes like this take time for a university to run – there is a mandatory consultation period, followed (hopefully) by some finessing of the scheme and then negotiations with individual staff members. It is not a way to make a quick, in year, saving. Oftentimes the original announcement is of a far higher number of staff redundancies than actually end up happening.

    Subject level

    If you work in a university or other higher education provider, you’ll know that stuff like this very often happens across particular departments and faculties rather than the whole university. I can’t offer you faculty level from public data, but there is data available by cost centre.

    [Full screen]

    Cost centres are usually used in financial data, and do not cleanly map to visible structures within universities. Here you can select a provider and choose between cost centre groups and cost centres as two levels of detail. I’ve added an option to select contract type – in the main I suggest you leave this as academic (excluding atypical).

    Zero hours

    I’m sure I say this every year, but not all providers return data for non-academic staff (in England they are not required to), and an “atypical” contract usually refers to a very short period of work (a single guest lecture or suchlike). There is a pervasive myth that these are “zero hours” contracts – even though HESA publishes data on these separately:

    Here’s a chart showing the terms of employment and pay arrangements related to zero hours contracts for 2023-24. You can see the majority of these are academic in nature, with a roughly even split between fixed term and open-ended terms. The majority (around 4,075) are paid by the hour.

    [Full screen]

    This represents a small year-on-year growth in the use of this kind of contract – in 2022-23, there were 3,915 academic staff on a zero hour contract

    Subject, age, and pay

    I often wonder about the conditions of academic staff across subject areas, and how this pertains to the age of the academics involved and how much they are paid. This visualisation allows use to view age against salary (relating to groups of spine points on the standard New JNCHES pay scale used in most larger providers).

    [Full screen]

    As you’d expect, overall there is a positive correlation between age and salary – if you are an older academic you are likely to be paid more. This is particularly pronounced in design, creative, and performing arts: where staff are likely to be older and better paid on average. Compare the physical sciences, where more staff are younger and spine points are lower.

    This chart allows you to select a cost centre (either a group or individual cost centre), and filter by academic employment function (teaching, research, both…) and contract level (senior academics and professors, others…). There’s a range of years on offer as well.

    Ethnicity

    The main news stories that tend to come out of this release relate to academic staff characteristics, and specifically the low number of Black professors. There is some positive movement on that front this year, though the sector at that level is in no way representative of staff as a whole, the student body, or wider society.

    [Full screen]

    Source link