Former education opposition spokeswoman Sarah Henderson has broken rank with her party after she pushed for a flat indexation cap on Labor’s student debt-slashing Bill.
Please login below to view content or subscribe now.
Membership Login


Former education opposition spokeswoman Sarah Henderson has broken rank with her party after she pushed for a flat indexation cap on Labor’s student debt-slashing Bill.
Please login below to view content or subscribe now.

by Ariane de Gayardon
Since the 1980s, massification, policy shifts, and changing ideas about who benefits from higher education have led to the expansion of national student loan schemes globally. For instance, student loans were introduced in England in 1990 and generalized in 1998. Australia introduced income-contingent student loans in the late 1980s. While federal student loans were introduced in the US in 1958, their number and the amount of individual student loan debt ramped up in the 1990s.
A lot of academic research has analysed this trend, evaluating the effect of student loans on access, retention, success, the student experience, and even graduate outcomes. Yet, this research is based on the choices and experiences of first-generation student borrowers and might not apply to current and future students.
First-generation borrowers enter higher education with parents who have either not been to higher education, or who have a tertiary degree that pre-dates the expansion of student loans. The parents of first-generation borrowers therefore did not take up loans to pay for their higher education and had no associated repayment burden in adulthood. Any cost associated with these parents’ studies will likely have been shouldered by their families or through grants.
Second-generation borrowers are the offspring of first-generation borrowers. Their parents took out student loans to pay for their own higher education. The choices made by second-generation borrowers when it comes to higher education and its funding could significantly differ from first-generation borrowers, because they are impacted by their parents’ own experience with student loans.
Parents and parental experience indeed play an important role in children’s higher education choices and financial decisions. On the one hand, parents can provide financial or in-kind support for higher education. This is most evident in the design of student funding policies which often integrate parental income and financial contributions. In many countries, eligibility for financial aid is means-tested and based on family income (Williams & Usher, 2022). Examples include the US where an Expected Family Contribution is calculated upon assessment of financial need, or Germany where the financial aid system is based on a legal obligation for parents to contribute to their children’s study costs. Indeed, evidence shows that parents do contribute to students’ income. In Europe, family contributions make up nearly half of students’ income (Hauschildt et al, 2018). But the role of parents also extends to decisions about student loans: parents tend to try and shield their children from student debt, helping them financially when possible or encouraging cost-saving behaviour (West et al, 2015).
On the other hand, parents transmit financial values to their children, which might play a role in their higher education decisions. Family financial socialization theory states that children learn their financial attitudes and behaviour from their parents, through direct teaching and via family interactions and relationships (Gudmunson & Danes, 2011). Studies indeed show the intergenerational transmission of social norms and economic preferences (Maccoby, 1992), including attitudes towards general debt (Almenberg et al, 2021). Continuity of financial values over generations has been observed in the specific case of higher education. Parents who received parental financial support for their own studies are more likely to contribute toward their children’s studies (Steelman & Powell, 1991). For some students, negative parental experiences with general debt can lead to extreme student debt aversion (Zerquera et al,2016).
As countries globally rely increasingly on student loans to fund higher education, many more students will become second-generation borrowers. Because their parents had to repay their own student debt, the family’s financial assets may be depleted, potentially leading to reduced levels of parental financial support for higher education. This is likely to be even worse for students whose parents are still repaying their loans. In addition, parental experiences of student debt could influence the advice they give their children with regard to higher education financial decisions. As a result, this new generation of student borrowers will face challenges that their predecessors did not, fuelled by the transmitted experience of student loans from their parents (Figure 1).
Figure 1 – Parental influence on second-generation borrowers
As the share of second-generation borrowers in the student body increases, the need to understand the decision-making process of these students when it comes to (financial) higher education choices is essential. Although the challenges faced by borrowers will emerge at different times and with varying intensity across countries — depending in part on loan repayment formats — we have an opportunity now to be ahead of the curve. By researching this new generation of student borrowers and their parents, we can better assess their financial dilemmas and the support they need, providing further evidence to design future-proof equitable student funding policies.
Ariane de Gayardon is Assistant Professor of Higher Education at the Center for Higher Education Policy Studies (CHEPS) based at the University of Twente in the Netherlands.

Hi all. Just a quick one today, this time on some data I recently got from StatsCan.
We know a fair a bit about student debt in Canada, especially with respect to distribution by gender, type of institution, province, etc. (Chapter 6 of The State of Postsecondary Education in Canada is just chock full of this kind of data if you’re minded to take a deeper dive). But to my knowledge no one has ever pulled and published the data on debt by ethnicity, even though this data has been collected for quite some time through the National Graduates Survey (NGS). So I ordered the data, and here’s what I discovered.
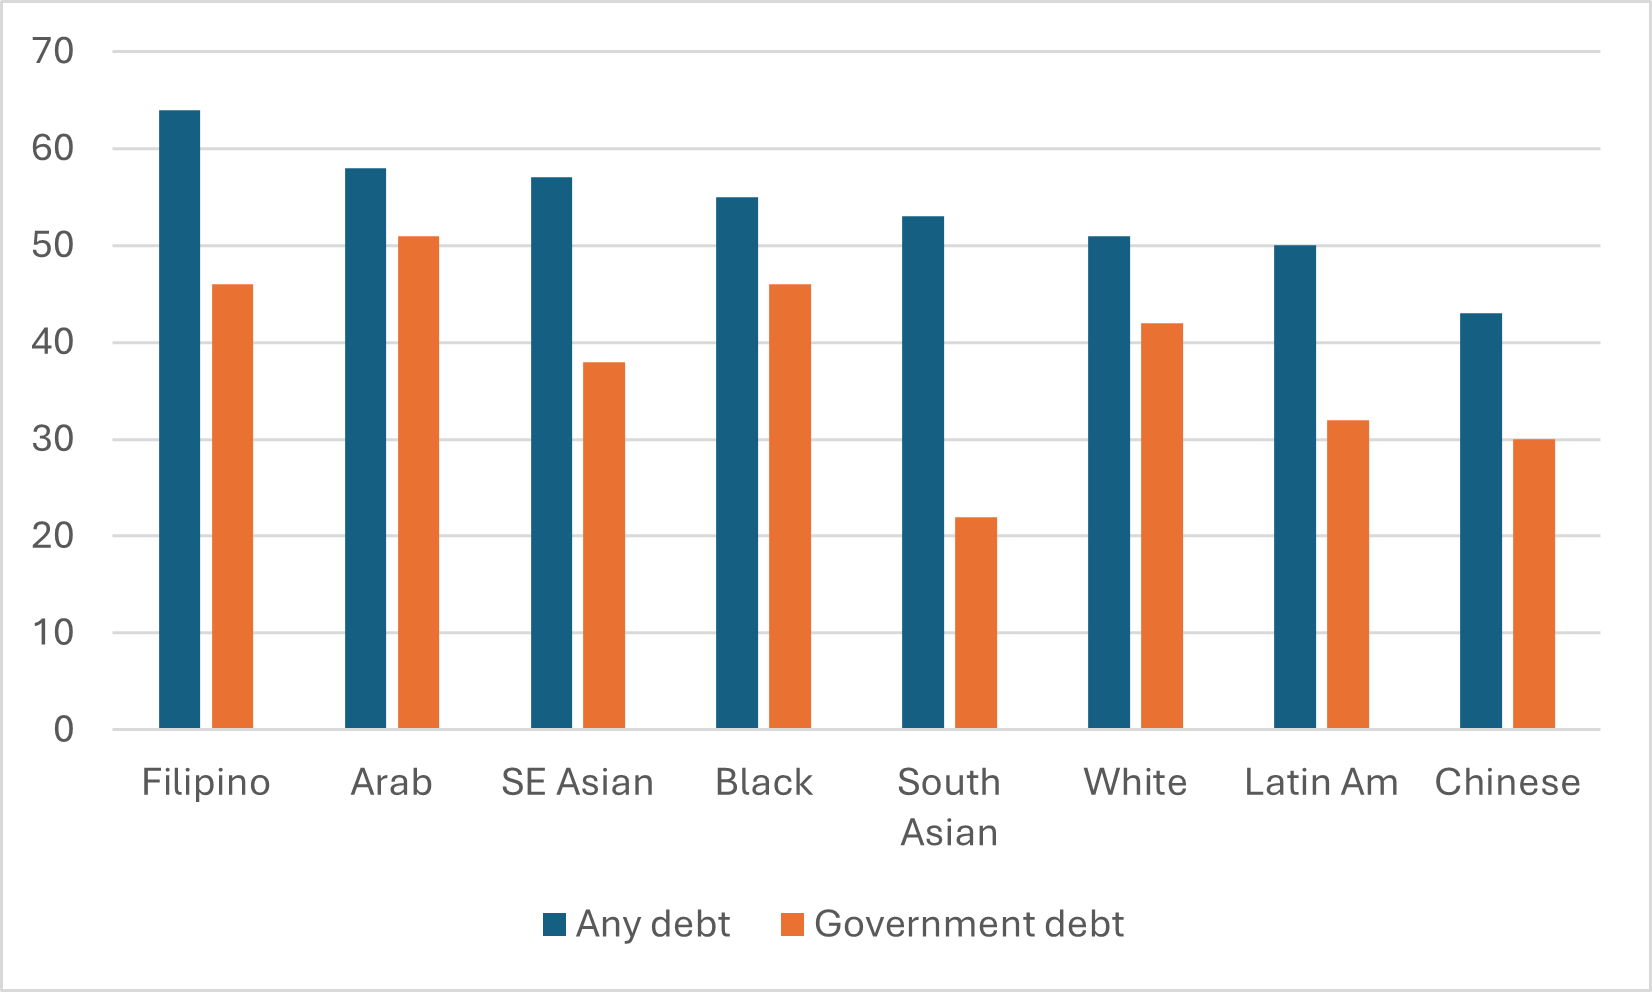
Figure 1 shows incidence of borrowing for the graduating class of 2020, combined for all graduates of universities and graduates, for the eight largest ethnicities covered by the NGS (and before anyone asks, “indigeneity” is not considered an ethnicity so anyone indicating an indigenous ethnicity is unfortunately excluded from this data… there’s more below on the challenges of getting additional data). And the picture it shows is…a bit complex.
Figure 1: Incidence of Borrowing, College and University Graduates Combined, Class of 2020
If you just look at the data on government loan programs (the orange bars), we see that only Arab students have borrowing rates in excess of 1 in 2. But for certain ethnicities, the borrowing rate is much lower. For Latin American and Chinese students, the borrowing rate is below 1 in 3, and among South Asian students the borrowing rate is barely 1 in 5. Evidence of big differences in attitudes towards borrowing!
Except…well when you add in borrowing from private sources (e.g. from banks and family) so as to take a look at overall rates of borrowing incidence, the differences in borrowing rates are a lot narrower. Briefly, Asian and Latin American students borrow a lot more money from private sources (mainly family) than do Arab students, whites, and Blacks. These probably come with slightly easier repayment terms, but it’s hard to know for sure. An area almost certainly worthy of further research.
There is a similarly nuanced picture when we look at median levels of indebtedness among graduates who had debt. This is shown below in Figure 2.
Figure 2: Median Borrowing, College and University Graduates Combined, Class of 2020
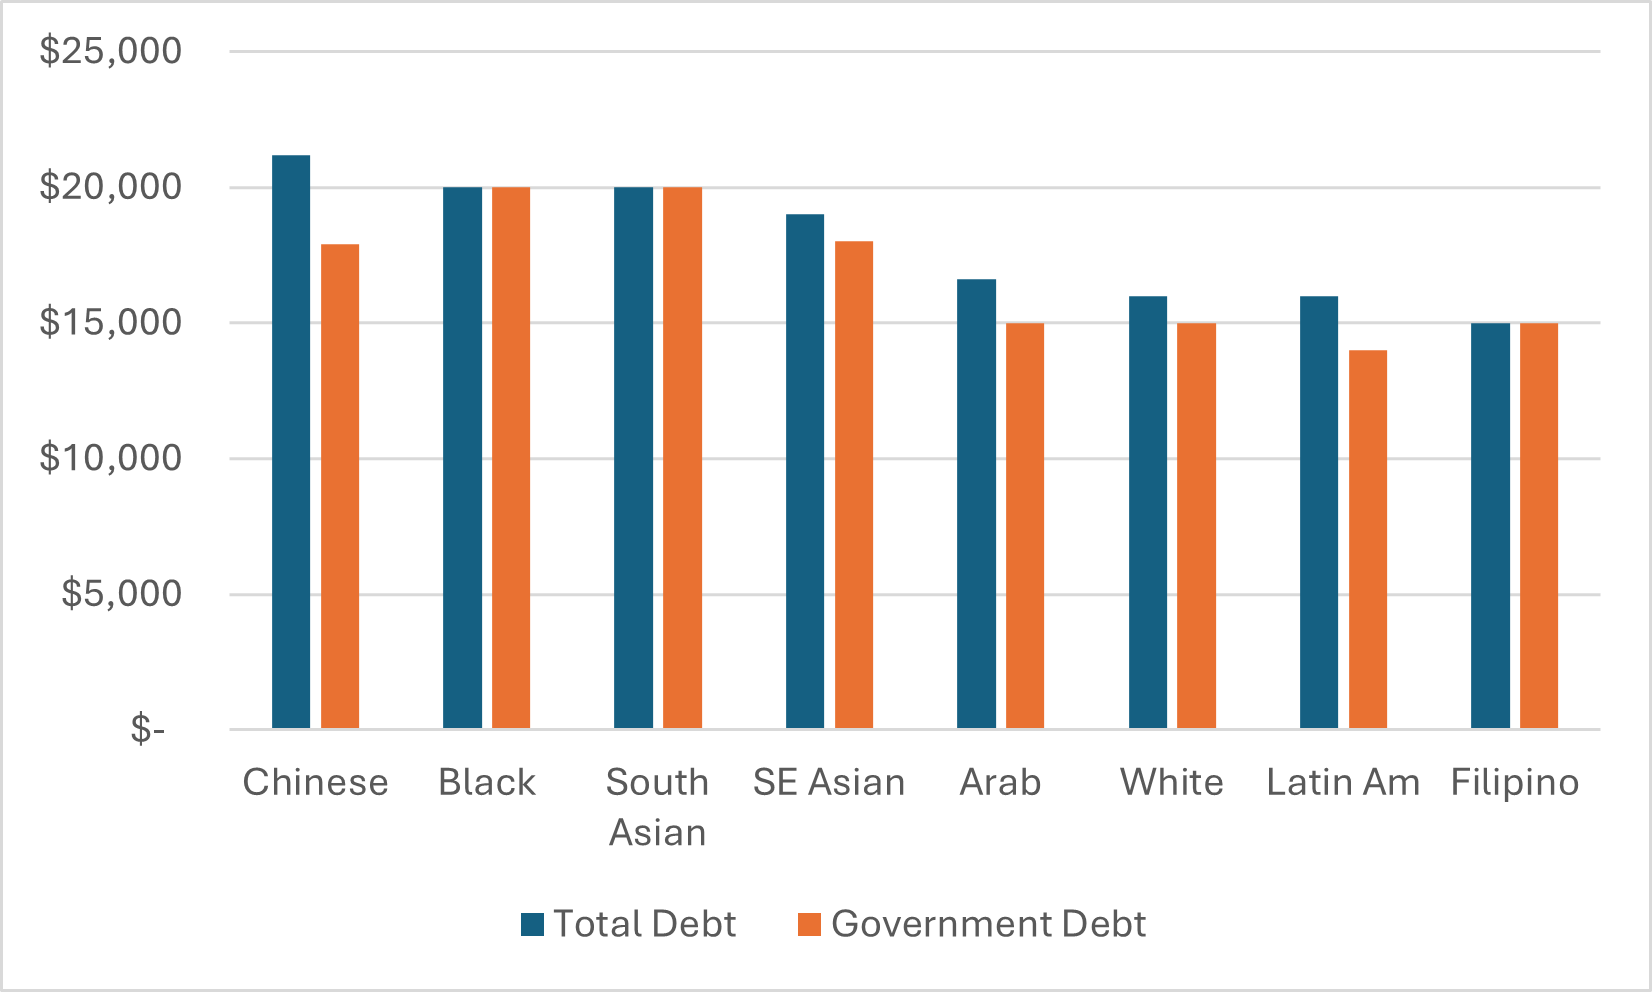
Now, there isn’t a huge amount of difference in exiting debt levels by ethnicity: the gap is only about $6,000 between the lowest total debt levels (Filipinos) and the highest (Chinese). But part of the problem here is that we can’t distinguish the reason for the various debt levels. Based on what we know about ethnic patterns of postsecondary education, we can probably guess that Filipino students have low debt levels not because they are especially wealthy and can afford to go to post-secondary without financial assistance. But rather because they are more likely to go to college and this spend less time, on average, in school paying fees and accumulating debt. Similarly, Chinese students don’t have the highest debt because they have low incomes; they have higher debt because they are the ethnic group the most likely to attend university and spend more time paying (higher) fees.
(Could we get the data separately for universities and colleges to clear up the confound? Yes, we could. But it cost me $3K just to get this data. Drilling down a level adds costs, as would getting data based on indigenous identity, and this is a free email, and so for the moment what we have above will have to do. If anyone wants to pitch in a couple of grand to do more drilling-down, let me know and I would be happy to coordinate some data liberation).
It is also possible to use NGS data to look at post-graduate income by debt. I obtained the data by in fairly large ranges (e.g. $0-20K, $20-60K, etc.), but it’s possible on the basis of that to estimate roughly what median incomes are (put it this way: the exact numbers are not exactly right, but the ordinal rank of income of the various ethnicities are probably accurate). My estimations of median 2023 income of 2020 graduates—which includes those graduates who are not in the labour market full-time, if you’re wondering why the numbers look a little low—are shown below in Figure 3.
Figure 3: Estimate Median 2023 Income, College and University Graduates Combined, Class of 2020
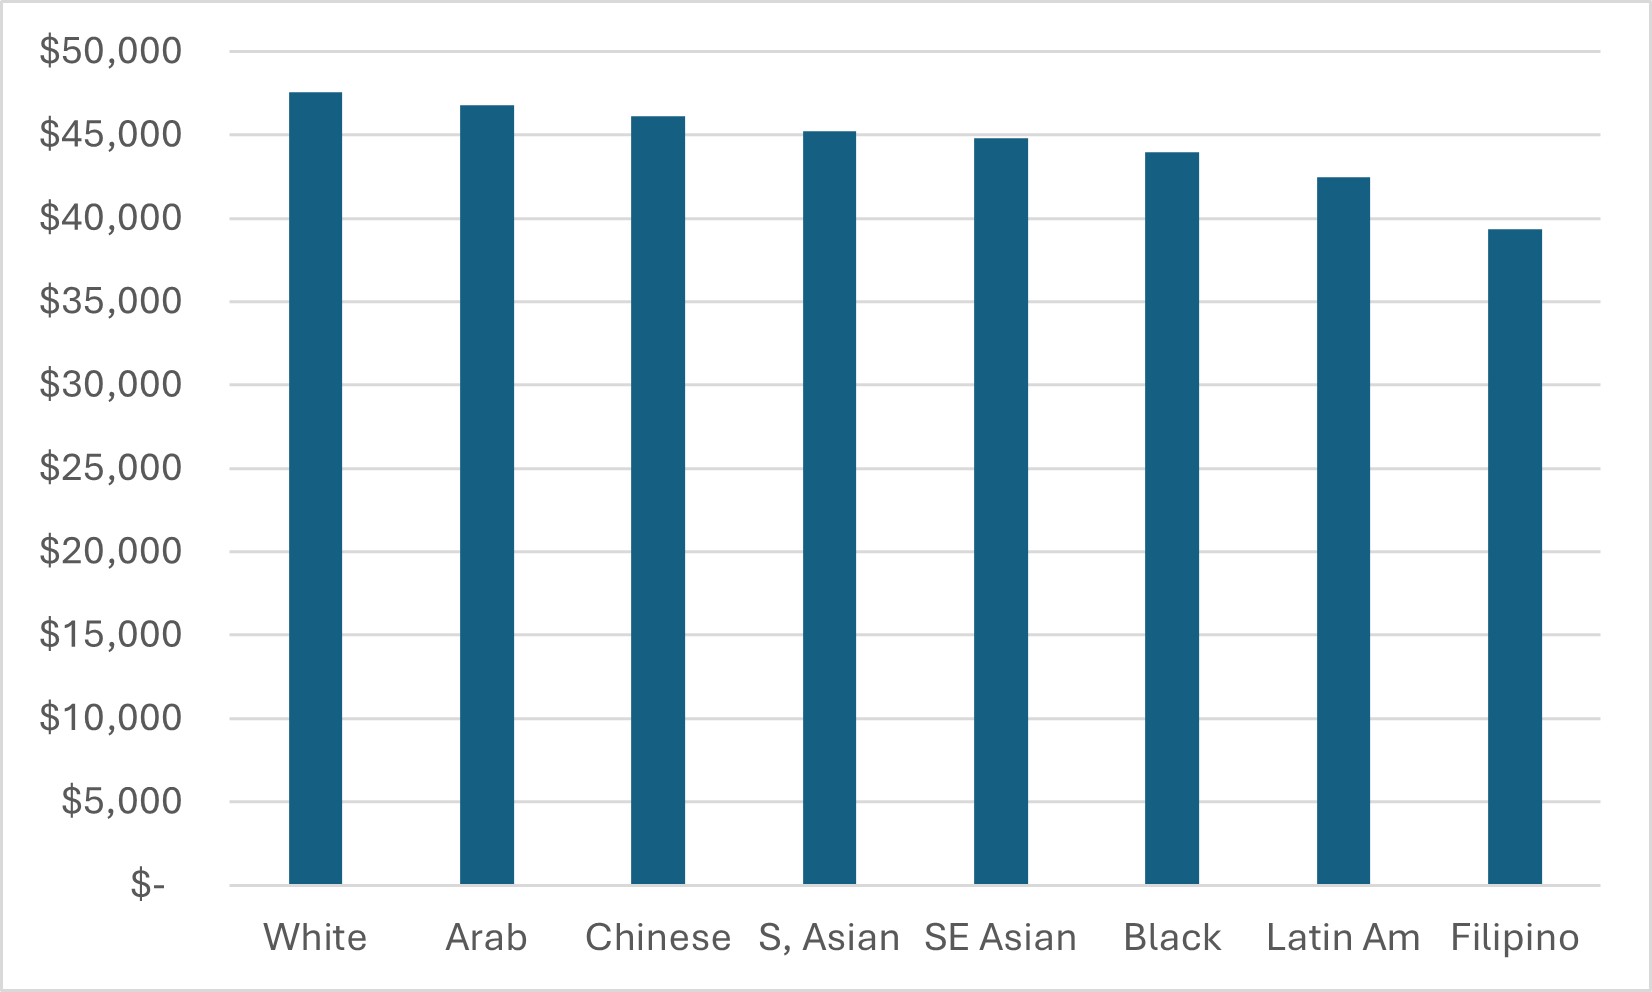
Are there differences in income here? Yes, but they aren’t huge. Most ethnic groups have median post-graduate incomes between $44 and $46,000. The two lowest-earning groups (Latin Americans and Filipinos) re both disproportionately enrolled in community colleges, which is part of what is going on in this data (if you want disaggregated data, see above).
Now, the data from the previous graphs can be combined to look at debt-to-income ratios, both for students with debt, and all students (that is, including those that do not borrow). This is shown below in Figure 4.
Figure 4: Estimated Median 2023 Debt-to-Income Ratios, College and University Graduates Combined, Class of 2020
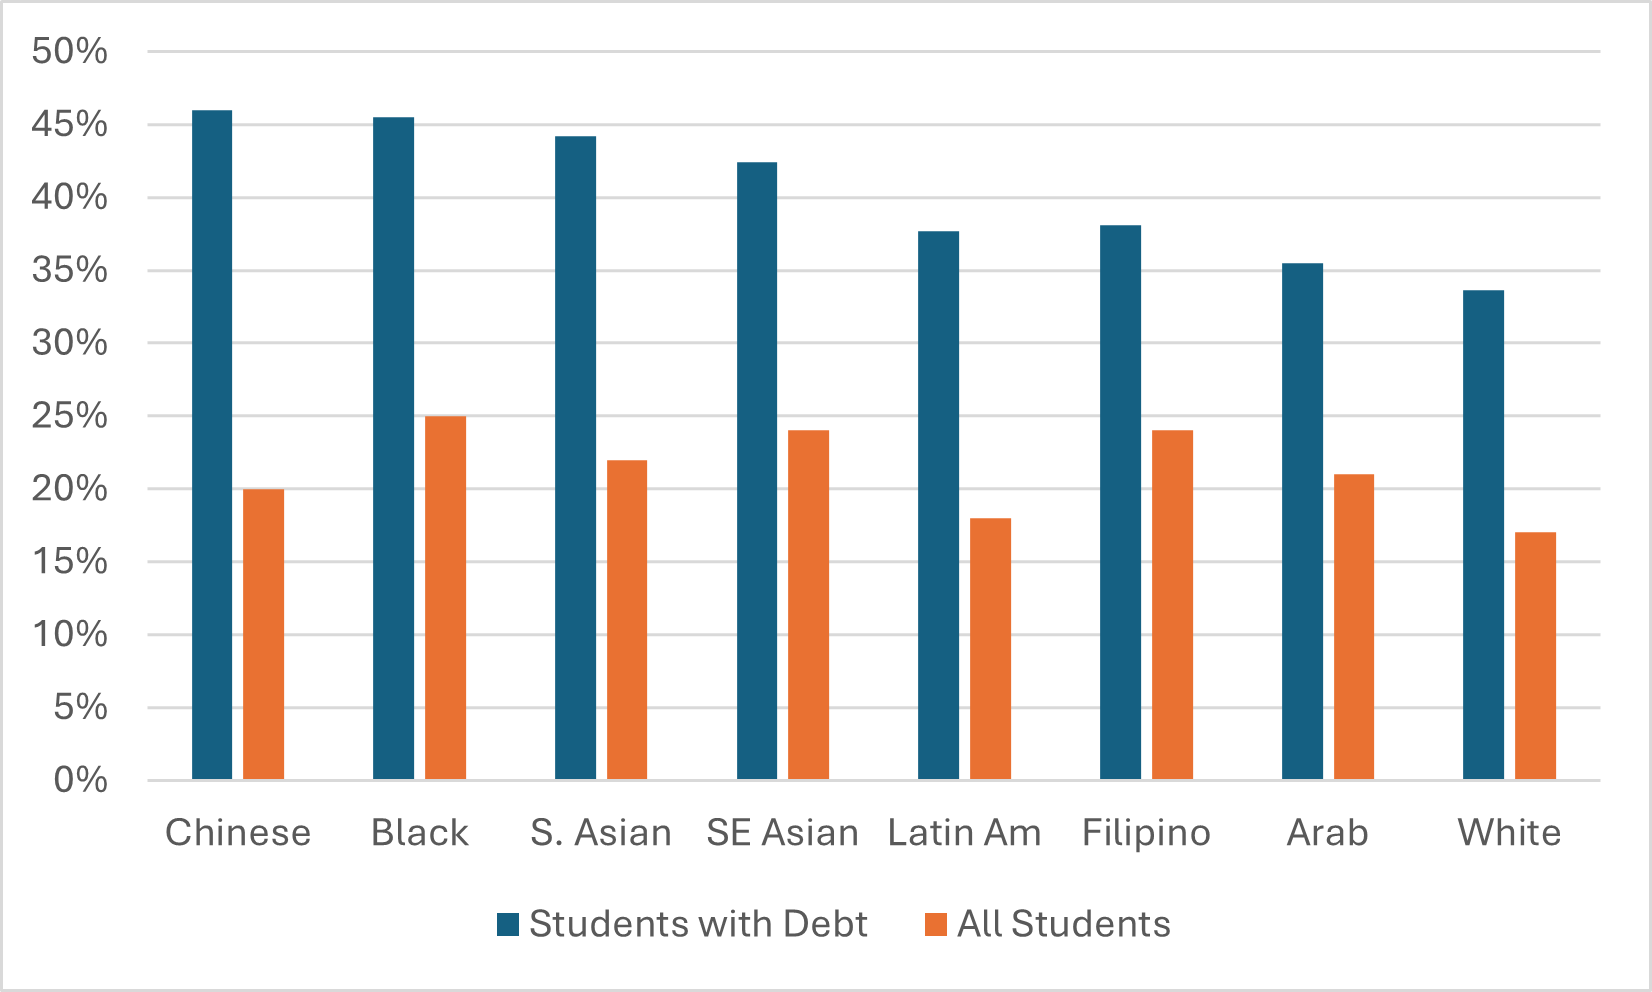
If you’re just dividing indebtedness by income (the blue bars), you get a picture that looks a lot like Figure 2 in debt, because differences in income are pretty small. But if you are looking at debt-to-income ratios across all students (including those that do not borrow) you get a very different picture because as we saw in Figure 1, there are some pretty significant differences in overall borrowing rates. So, for instance, Chinese students go from having the worst debt-to-income ratio on one measure to being middle of the pack on another because they have relatively low incidence of borrowing; similarly, students of Latin American origin go from being middle-of-the-pack to nearly the lowest debt-to-income ratios because they are a lot less likely to borrow than others. Black students end up having among the highest debt-to-income ratios not because they earn significantly less than other graduates, but because both the incidence and amount of their borrowing is relatively high.
But I think the story to go with here is that while there are differences between ethnic groups in terms of borrowing, debt, and repayment ratios, and that it’s worth trying to do something to narrow them, the difference in these rates is not enormous. Overall, it appears that as a country we are achieving reasonably good things here, with the caveat that if this data were disaggregated by university/ college, the story might not be quite as promising.
And so ends the first-ever analysis of student debt and repayment by ethnic background. Hope you found it moderately enlightening.