
Under NATO, 32 countries have pledged to defend each other. Is the United States the glue that holds it all together?
Source link
Category: United States
-

Decoder Replay: Isn’t all for one and one for all a good thing?
-

The United States as guardian or bully
The recent United States military incursion into Venezuela and abduction and subsequent arrest of its President Nicolás Maduro and his wife in New York is a major geopolitical event. Like all major geopolitical events, it has several components — historical, legal, political and moral.
And like all major geopolitical events, it has very different points of view. There is no grandiose “Truth” about what happened. There are many truths and points of view.
What can be said is that on 3 January 2026, the United States military carried out strikes on Venezuela and captured its president, Nicolás Maduro, and his wife Cilia Flores. The two were then flown to the United States where they were arrested and charged with issues related to narcoterrorism.
The United States’ intervention in a Latin American country has historical precedents as well as current foreign policy implications.
Under President James Monroe, the United States declared in 1823 that it was opposed to any outside colonialism in the Western Hemisphere. Now known as the Monroe Doctrine, it established what political scientists refer to as a “sphere of influence”; No foreign country could establish control of a country in the United States-dominated Western Hemisphere.
(This was indeed one of the central issues in the 13-day October 1962 Cuban Missile Crisis when the United States established a blockade outside Cuba to stop the installation of Soviet missiles on the island.)
The Trump Corollary
In the latest U.S. official security strategy document — National Security Strategy 2025 — the Monroe Doctrine was presented in what has been labelled “The Trump Corollary.” In it, the government said that defending territory and the Western Hemisphere were central tasks of U.S. foreign policy and national interest. The document clearly stated that activities by extra-hemispheric powers would be considered serious threats to U.S. security.
As such, the “Trump Corollary” of the Monroe Doctrine is the justification of the military action in Venezuela based on stopping Russian and Chinese influence in Venezuela. In addition, it can be seen as the justification for the U.S. to acquire Greenland, resume control of the Panama Canal and stop narcotics and illegal migrants coming into the United States from anywhere in the Western Hemisphere.
But the Corollary and Doctrine are mere national strategic statements. Are they legally justified? The U.S. military operation in Venezuela has been highly criticized by international lawyers as well as United Nations officials. The United Nations Charter, of which the United States is a signatory, clearly forbids the use of force by one country against another country except in the case of self-defense and imminent threat.
In an interview with New Yorker magazine reporter Isaac Chotiner on 3 January, Yale Law School Professor Oona Hathaway noted that when the UN Charter was written 80 years ago, it included a critical prohibition on the use of force by states. “States are not allowed to decide on their own that they want to use force against other states,” she told Chotiner. “It was meant to reinforce this relatively new idea at the time that states couldn’t just go to war whenever they wanted to.”
Hathaway said that in the pre-UN Charter world, you could use force if you felt like drug trafficking was hurting you and come up with legal justification that that was the case. “But the whole point of the UN Charter was basically to say, ‘We’re not going to go to war for those reasons anymore’,” she said.
The legality of an ouster
Besides the international legal issue, there is also a domestic legal question about the Venezuelan military action. The 1973 War Powers Act was enacted to limit the power of the U.S. president to use military forces with the approval of the Congress.
It was enacted following the Vietnam War during which the president engaged troops without Congressional approval or a formal declaration of war. The Act clearly requires the president to notify Congress before committing armed forces to military action.
Trump did not consult with members of Congress before and during the military action in Venezuela. The political implications of the Venezuelan strikes and abduction also have international as well as domestic implications. Internationally, there is a dangerous precedent being set.
If the United States asserts its sphere of influence in the Western Hemisphere, what is to stop the Russian Federation from claiming a similar sphere of influence in the Baltic countries of Latvia, Lithuania and Estonia as well as Ukraine?
Similarly, what about Chinese influence in the Indo-Pacific region and especially Taiwan? If the United States claims domination in one geographic region, why can’t other powers like Russia and China do the same?
The Westphalian system
Within the United States, there have also been serious reservations about President Trump’s actions. That was to be expected from the opposing Democratic Party. But, several members of Trump’s Republican Party as well as loyal members of his Make America Great Again (MAGA) movement argue that Trump was elected on the slogan “Make America Great Again.” One of the pillars of that movement is a focus on internal problems instead of foreign interventions.
Republican U.S. Representative Marjorie Taylor Greene used to be one of Trump’s staunchest supporters. On 3 January she told interviewer Kristen Walker on the NBC show “Meet the Press” that America First should mean what Trump promised on the campaign trail in 2024.
“So my understanding of America First is strictly for the American people, not for the big donors that donate to big politicians, not for the special interests that constantly roam the halls in Washington and not foreign countries that demand their priorities put first over Americans,” Greene said.
Other criticisms have centered on President Trump’s focus on restoring business in Venezuela for the U.S. oil industry, which has the world’s largest oil reserves. Republican U.S. Representative Thomas Massie warned that “lives of U.S. soldiers are being risked to make those oil companies (not Americans) more profitable.”
Finally, there are moral arguments against the use of force in Venezuela as well as Trump’s threats of the use of force in Colombia, Cuba and elsewhere. There is no question that Venezuelans had suffered under the rule of Maduro; statistics show the rapid decline in the economy as well as a significant democratic deficit.
Fundamental to today’s notion of international order is what’s known as the Westphalian system of the integrity of state sovereignty. The world has seen an order since the end of World War II and the establishment of the United Nations. That order was based on respect for the rule of law. There are other means for states to act against other states, such as sanctions, below military intervention. One country invading another goes against the basis of the Westphalian system.
The Venezuelan strikes and abduction have set a dangerous precedent.
Questions to consider:
1. What is meant by the “Monroe Doctrine”?
2. When is one country considered part of a “sphere of influence” of another country?
3. How do you define “national security”?
-
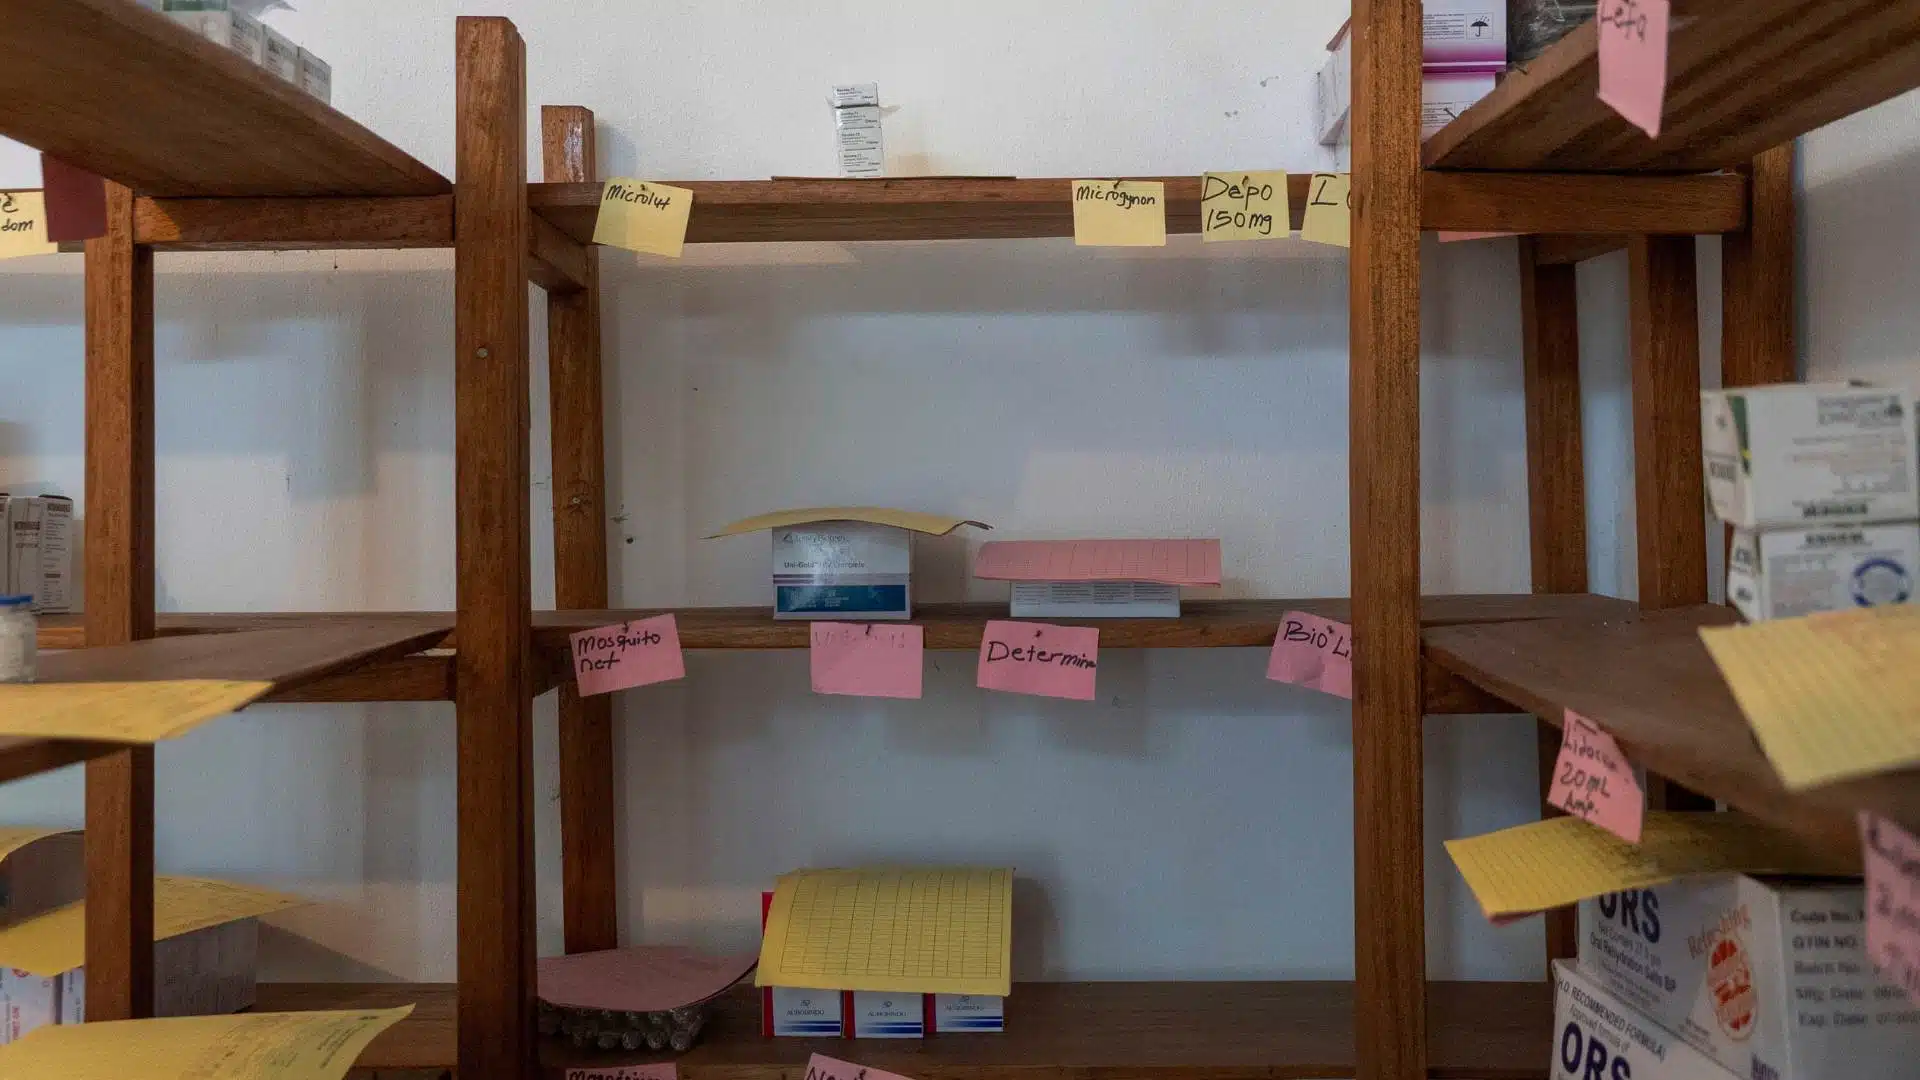
What happens when people lose access to birth control?
Abandonment of U.S. financial support for contraception around the world has disrupted the ecosystem that fostered birth control, family planning and sexual and reproductive health for decades.
Back in February, the United Nations Population Fund announced that the United States had canceled some $377 million in funding for maternal health programs around the world, which includes contraception programs.
Contraception reduces mortality and can improve the lives of women and families. The United Nations estimates that the number of women using a modern contraception method doubled from 1990 to 2021, which coincided with a 34% reduction in maternal mortality over the same period.
Now, tens of millions of people could lose access to modern contraceptives in the next year, according to the Guttmacher Institute, a family planning research and lobby group. This, it reported, could result in more than 17 million unintended pregnancies and 34,000 preventable pregnancy-related deaths.
Sexual and reproductive health and rights programs improve women’s choices and protection including violence and rape prevention and treatment.
Who will fill the gap?
European donor governments have pledged to increase contributions to UNFPA and other global health funds to partially fill the gap. The Netherlands, Sweden and Denmark, for example, have pledged emergency funds to UNFPA Supplies, the world’s largest provider of contraceptives to low-income countries.
The EU has also redirected part of its humanitarian budget to cover contraceptive procurement in sub-Saharan Africa. Canada announced an additional CAD $100 million over three years for sexual and reproductive health programs, explicitly citing the U.S. withdrawal.
Despite its own aid budget pressures, the UK has committed to maintaining its £200 million annual contribution to family planning programs, with a focus on East Africa.
The Bill and Melinda Gates Foundation expanded its Family Planning 2030 commitments, pledging tens of millions in stopgap funding to keep supply chains moving. The World Bank Global Financing Facility offers bridge loans and grants to governments facing sudden gaps in reproductive health budgets and calls for governments to co-finance. However these initiatives will not immediately replace the scale of previous U.S. government investments.
The loss of U.S. support has left many women with no access to family planning, especially in rural and conflict-affected areas. Clinics are reporting a surge in unintended pregnancies and unsafe abortions.
Health clinics closing
In Zambia, Cooper Rose Zambia, a local NGO reported laying off 60% of its staff after receiving a stop-work order from USAID. Clinics have been rationing contraceptives with some methods already out of stock.
In Kenya, clinics in Nairobi and rural counties are turning women away, with some supplies stuck in warehouses and at risk of expiring. In Tanzania, medical stores confirmed they were completely out of stock of certain contraceptive implants by July 2025.
Mali will be denied 1.2 million oral contraceptives and 95,800 implants, nearly a quarter of its annual need. In Burkina Faso, another country under terrorist insurgency internally, many displaced women have no access to modern contraceptives.
The consequences of the stock depletions will be particularly catastrophic in fragile and conflict settings such as refugee camps.
Struggling to adapt to the reality has led organizations to cut programs and redirect their remaining resources. Many are trying desperately to raise new funds. But there are some voices that cheer the cuts, describing them as a wake up call.
A wake up call for Africa?
Rama Yade, director of the Africa Center of the Atlantic Council, a non-partisan organization that studies and facilitates U.S. international relations, argues that the aid cuts could be a wake-up call for African nations to reduce dependency and pursue economic sovereignty.
For pan-African voices who have long criticized foreign aid as a tool of neocolonialism, the U.S. government cuts are a chance to build local capacity, strengthen intra-African trade and reduce reliance on Western donors. Trump’s dismantling of USAID offers a new beginning for Africa.
In an essay in the publication New Humanitarian, Themrit Khan, an independent researcher in the aid sectors wrote that recipient nations have been made to believe they are unable to function without external support.
Khan proposes several actions to mitigate the foreign funding cuts: relying more on local donors; developing trade and bilateral relations instead of depending on international cooperation programs through the United Nations and other international organizations; re-evaluating military spending and reducing debt.
Colette Hilaire Ouedraogo, a senior midwife and sexual and reproductive health practitioner, told me that up to 60% of activities were from external funding partners. She recalled the alerts sent by the health department to increase funding from national sources as early as 2022.
She predicts that the cuts affecting the availability and access to contraceptives and the overall quality of services will slow down progress towards universal health coverage targets and the UN Sustainable Development Goals. There is a risk of reduced attendance at reproductive health and family planning centers. Consequently, unwanted pregnancies and unsafe abortions could increase leading an higher maternal mortality.
Questions to consider:
1. How can contraceptives result in lower deaths for women?
2. Why do some people argue that the cut off of funds from the United States might ultimately benefit nations in Africa?
3. Why are contraceptives controversial?
-

A track meet that pushes girls to greatness
The crowd is electric. The starting gun goes off to begin a race, and you can hear and feel the passion of the crowd as they cheer. The announcer feeds the excitement, commentating every stride over the sound system, urging athletes to “pump those arms” and “keep moving.” It’s difficult not to get swept.
These are the Colgate Women’s Games, the largest amateur track and field series in the United States, which kick off its 50th iteration this year with preliminary meets 28 December.
Watching the youngest athletes compete is witnessing sports in its purest form. There’s no pretense, calculated strategies or alternative agendas. It’s just grit, unbridled joy and the thrill of pushing their bodies to the limit.
Some triumph and some falter, but they all cross the finish line giving it their all, and that authenticity is what makes the Games special.
The venue is packed wall-to-wall. Not an empty seat in sight. The athletes fill in every inch of space — so many that you can hardly see the floor beneath them. The girls wrap around what’s known at Colgate as “The Wall,” lining every side of the facility.
More than just a track meet
The line of competitors is so long, it will snake around the entire facility in a sea of athletes waiting for their moment to shine.
The fierce competitive spirit of the competitors and the crowd’s near proximity to the action combine to generate an almost tangible atmosphere. The energy doesn’t just fuel the competition, it elevates it, pushing performances to another level.
The Colgate Women’s Games are more than just track meets. They are a gateway to opportunity that transforms lives, with more than 5,000 scholarships awarded, lifelong friendships cultivated and the start of Olympic and professional dreams, athletic and non-athletic.
“It was some of the best memories I had at that time,” said Dalilah Muhammad, Olympic gold medalist and former 400-meter hurdles world record holder. “Just being a kid, nervous and excited at the same time, while being able to do it with your friends. For me, that was the most important aspect of it. It made me feel like I had a place that I belonged to with friends, that all wanted to be there and do the same thing.”
The goal is to foster a robust sense of personal accomplishment and self-worth while supporting the coaches who serve as role models and mentors for the girls.
Ideas sketched out on a napkin
Alumni include 29 Olympians, countless national champions and current and former world and national record holders at the senior, junior and youth levels. Former competitors now work as teachers, judges, lawyers, executives and ESPN anchors. One of the most recognizable is ESPN SportsCenter anchor Amina Smith.
The Colgate Women’s Games were the brainchild of Fred Thompson, a New York attorney and founder of a Brooklyn girls’ track club who was frustrated with the state of women’s athletics in the mid-1970s.
Thompson was an ABC network sportscaster, and was invited to an event hosted by the Colgate-Palmolive Company — a corporate giant known for soap and toothpaste — for the unveiling of a video presentation titled “Colgate’s Women in Sports,” to air on ABC’s telecast of the newly-launched Dinah Shore golf tournament.
The video included a segment on Thompson’s Atoms Track Club, where girl athletes trained. In the video they talked about training as well as school, why they enjoyed running and their aspirations on and off the track. It caught the eye of Colgate President David Foster. He saw that Thompson had found a way to instill in women a drive for excellence that would carry over to college and careers.
Foster wanted his company to replicate in communities around the country what Thompson had done in his community.
“[They were talking] for a long time, scribbling some stuff on a napkin and I’m sitting there wondering what is going on?” said Cheryl Toussaint, an alum of the Atoms Track Club. Toussaint had won a silver medal in the women’s 4 × 400 meters relay at the 1972 Olympics. She is now the Meet Director of the Colgate Women’s Games, having taken over the position from Thompson.
Getting girls to plan for their future
But back then, the Games were just rough ideas. Thompson and the Colgate execs wanted to bolster the sport for women, give them more opportunities and provide scholarships that could be applied to any level of education.
A pilot program at a local college gym drew a massive turnout. Colgate-Palmolive saw that with awards and scholarship opportunities, it could be something that would resonate.
Now, the Games consist of eight events — six track distances plus shot put and high jump — in six divisions for the women to compete in.
Competitors collect points for results in preliminary rounds, and those with the highest numbers move on to the semi-finals and the grand finale on 7 February 2026, which will be available livestream on ArmoryTrack.org.
The top six finishers in each event will receive a trophy and the top three finishers will be rewarded an additional educational scholarship in denominations of $2,000, $1,000 and $500. Special awards are also given for most outstanding and improved performances as well as most promising performance from a newcomer.
From local to national
All girls and women from elementary school grades 1 and up are eligible to participate in the Colgate Women’s Games. No prior experience in track and field is necessary, but all girls of school-age must be enrolled and attending school in order to participate.
As the years continued, the Games began to grow from a local meet, to a regional meet and even a national meet where girls from states such as Georgia, Arizona and Texas would travel to New York to compete.
But it’s the finals that set the Games apart. The finals aren’t just the last series of races; it’s a celebration, a ceremony marking the culmination of the preliminary and semifinal rounds.
Muhammad and many other Olympians such as Nia Ali, Ajee Wilson, Natasha Hastings, Kim Thomas Barnes (Carter), Diane Dixon and Athing Mu got their start here. The Olympians produced by the Games would represent multiple nations, demonstrating their international reach.
The Games’ impact extends beyond the track; the skills and confidence built from competing has led to careers in education, medicine, business, law, media and beyond. Some Games alumni, like basketball star Lorin Dixon, went on to excel in other sports.
Scholarships get girls thinking about college.
Colgate Women’s Games gives the competitors the chance to earn scholarships to college as early as Grade 1, around the age of 6 or 7, which gets parents and guardians planning that early for a college path for their daughters. If they continue competing, the scholarships accumulate.
If the scholarship earners opt out of college, they can apply that scholarship to career training.
For the women who would go on to run track at the high school and collegiate level, the Games introduced them to the scoring system. The girls learn at an early age how their performance affects their score and overall placement in the meet, along with race strategies to earn the maximum number of points possible.
This knowledge helps when competing at the next level where point scoring is a crucial aspect to high school and collegiate track.
Empowering women through sports
Numerous alumni have embraced the Colgate Women’s Games’ mission of empowering young girls and women.
Consider Olicia Williams, Games’ alum and three-time All-American at Baylor University, who after years of mentoring youth and serving the community through The Armory Foundation, along with coaching her high school and college alma mater, created Lili’s Lionesses Track Club, a program focused on enabling young women to thrive in academics, sports and personal development.
Impact alone doesn’t ensure survival. The Games continue to thrive after 50 years because their model is built on values that extend beyond any single season or generation.
Foremost, it’s a developmental series. Because it’s not a one-off competition, girls with no experience can come to each competition and learn as they compete. They learn they don’t need expensive equipment to participate in the sport.
Toussaint pointed out that the series not only develops competitors from a physical standpoint; it develops them mentally.
“When younger girls fall down, come in last or get bumped out of competition and feel dejected, we help them understand that it’s just one day,” Toussaint said. “We tell them and their parents, this is a place to learn what you’re made of, develop your skills and improve on what you did before.”
Eliminating barriers
The Games are free for the competitors. This makes it different from the many track meets and running events that are surprisingly expensive.
Muhammad said that everyone is there for the right reasons. “No one’s there doing it for any type of money and that’s what makes Colgate so great,” she said. “You have great people doing it for a cause that’s bigger than themselves and it’s inspiring.”
Thompson died in 2019 from complications of Alzheimer’s disease. But his legacy lives on through all the lives he’s helped, and he would be thrilled to see the Games’ 50th anniversary, says Toussaint. “He would cry tears of joy,” she said.
Women’s sports have finally surged into the mainstream. There’s WNBA stars A’ja Wilson and Sabrina Ionescu launching signature shoes that are high performing in sales, and women headlining Ultimate Fighting Championship events and selling out arenas. There’s Serena Williams transcending sport to become a global icon. But it’s important to remember that this success didn’t emerge spontaneously. It was built by pioneers who invested in women athletes long before it was profitable or popular.
The Colgate Women’s Games belong in that conversation as a cornerstone of women’s sports.
Questions to consider:
1. What is one thing about the Colgate Women’s Games that makes it different from other track and field competitions for women?
2. How can sports help girls off the field?
3. In what ways can competition be both good and bad?
-

Students face dropout risk in Trump cuts – Campus Review
President Donald Trump has proposed $980 million in cuts to work-study programs. Picture: Alex Brandon.
-

Clean energy research funds under threat – Campus Review
President Donald Trump agreed to a critical minerals deal with Australian Prime Minister Anthony Albanese. Picture: Imago.
There has been much excitement since Australia signed a landmark agreement with the United States last month to expand cooperation on critical minerals and rare earth elements.
Please login below to view content or subscribe now.
Membership Login
-
The Widening Gap: Income, College, and Opportunity with Zachary Bleemer
One of the great promises of higher education is that it acts as a social ladder—one that allows students from low-income backgrounds to climb up and reach a higher social and economic status. No one, I think, ever believed it was a guaranteed social leveler, or that children from wealthier families didn’t have an easier time succeeding after college because of their own, and their family’s, social and cultural capital. But most people, in America at least, believed that on the whole it played a positive role in increasing social mobility.
Over the past couple of decades, though, particularly as student debt has increased, people have begun to wonder if this story about social mobility through college is actually true. That’s a hard question to answer definitively. Data sets that track both student origins and outcomes are few and far between, and it’s also difficult to work out what social mobility used to look like in a quantifiable sense.
However, this summer economist Sarah Quincy of Vanderbilt University and Zach Bleemer of Princeton University released a paper called Changes in the College Mobility Pipeline Since 1900. This paper overcame some of those data limitations and took a long, more than century-long, look at the relationship between social mobility and college attendance.
What they found was sobering. Not only is higher education no longer helping poor students catch up with wealthier ones, but in fact the sector’s role as a social elevator actually stopped working almost 80 years ago. This seemed like a perfect story for the podcast, and so we invited Zach Bleemer—who you may remember from an episode on race-conscious admissions about two years ago—to join us to discuss it.
This discussion ranges from the methodological to the expositional. Where does the data come from? What does the data really mean? And are there alternative explanations for the paper’s surprising findings? But enough from me—let’s hear from Zach.
The World of Higher Education Podcast
Episode 4.4 | The Widening Gap: Income, College, and Opportunity with Zachary BleemerTranscript
Alex Usher (AU): Zach, you wrote, with Sarah Quincy, a paper called Changes in the College Mobility Pipeline Since 1900, which looks a long way back. And you argue that the relative premium received by lower-income Americans from higher education has fallen by half since 1960. Take us through what you found—give us the 90-second elevator pitch.
Zachary Bleemer (ZB): Consider kids who were born in 1900 and were choosing whether or not to go to college in the late 1910s and early 1920s. What we were interested in was that choice, and in particular, following people for the next 20 years after they made it. Some people graduated high school but didn’t go to college, while others graduated high school and chose to go.
We wanted to compare the differences in early 1930s wages between those two groups—both for kids from lower-income backgrounds and kids from upper-income backgrounds. Now, you might be surprised to learn that there were lower-income kids going to college in the U.S. in the early 1920s, but there were. About 5 to 10% of people from the bottom parental income tercile even then were attending college.
What we found, when we linked together historical U.S. census records and followed kids forward, is that whether you were low-income or high-income, if you went to college your wages went up a lot. And the degree to which your wages went up was independent of whether you were low-income or high-income—everyone benefited similarly from going to college.
If you compare that to kids born in the 1980s, who were choosing to go to college in the late 1990s and early 2000s, you see a very different story. Everyone still gains from going to college, but kids from rich backgrounds gain a lot more—more than twice as much as kids from poor backgrounds. And that’s despite the fact they’re making the same choice. They’re going to different universities and studying different things, but when it comes down to the 18-year-old making a decision, those from poor families are just getting less from American higher education now than they did in the past—or compared to kids from rich backgrounds.
AU: I want to make sure I understand this, because it’s a crucial part of your argument. When you talk about relative premiums—premium compared to what, and relative compared to what?
ZB: What we always have in mind is the value of college for rich kids, and then asking: how much of that value do poor kids get too? In the early 20th century, and as late as the 1960s, those values were very similar. Lower-income kids were getting somewhere between 80 and 100% of the value of going to college as higher-income kids.
AU: And by “value,” you mean…
ZB: That just means how much your wages go up. So, the wage bump for lower-income kids was very similar to that of higher-income kids. Today, though, it’s more like half—or even a little less than half—of the economic value of college-going that lower-income kids receive compared to higher-income kids.
AU: So in effect, higher education is acting as an engine of greater inequality. That’s what you’re saying?
ZB: I guess it’s worth saying that lower-income kids who go to college are still getting ahead. But it’s not as much of a pipeline as it used to be. Higher education used to accelerate lower-income kids—not to the same level of income as their higher-income peers; they were never going to catch up—but at least they got the same bump, just from a lower starting point.
AU: So the gap widens now. But how do you make a claim like that over 120 years? I mean, I sometimes have a hard time getting data for just one year. How do you track college premiums across a period of 120 years? How sound is the empirical basis for this? You mentioned something about linking data to census records, which obviously go back quite a way. So tell us how you constructed the data for this.
ZB: The first-order answer is that I called up and worked with an economic historian who had much more experience with historical data than I did. Like you said, it’s hard in any period to get high-quality data that links students in high school—especially with information on their parental income—to wage outcomes 10 or 15 years later.
What we did was scan around for any academic or government group over the last 120 years that had conducted a retrospective or longitudinal survey—where you either follow kids for a while, or you find a bunch of 30-year-olds and ask them questions about their childhood. We combined all of these surveys into a comprehensive database.
In the early 20th century, that meant linking kids in the 1920 census, when they were still living with their parents, to the same kids in the 1940 census, when they were in their early thirties and working in the labor market. That link has been well established by economic historians and used in a large series of papers.
By the middle of the 20th century, sociologists were conducting very large-scale longitudinal surveys. The biggest of these was called Project Talent, put together by the American Institutes for Research in 1961. They randomly sampled over 400,000 American high school students, collected a ton of information, and then re-surveyed them between 1971 and 1974 to ask what had happened in their lives.
In more recent years, there’s been a large set of governmental surveys, primarily conducted by the Departments of Labor and Education. Some of these will be familiar to education researchers—like the National Longitudinal Survey of Youth (NLSY). Others are less well known, but there are lots of them. All we did was combine them all together.
AU: I noticed in one of the appendices you’ve got about nine or ten big surveys from across this period. I guess one methodological limitation is that they don’t all follow respondents for the same amount of time, and you’d also be limited to questions where the surveys provided relatively similar answers. You never get your dream data, but those would be the big limitations—you’ve got to look for the similarities, and that restricts you.
ZB: I’d add another restriction. You’re right that, as we filtered down which datasets we could use, the key variables we needed were: parental income when the student was in high school, level of education by age 30, and how much money they made at some point between ages 30 and 35. All of our surveys had those variables.
We also looked for information about what college they attended and what their college major was. Ideally, the surveys also included some kind of high school test—like the SAT or an IQ test—so we could see what kinds of students from what academic backgrounds were going to college.
But there was another key limitation. In most of the data before 1950, it was really difficult to get a direct measure of parental income. Instead, we usually had proxies like parental occupation, industry, or level of education—variables that are highly predictive of income, but not income itself.
So, a lot of the work of the paper was lining up these measures of varying quality from different surveys to make sure the results we report aren’t just noise from mismeasurement, but instead reflect real changes on the ground in American higher education.
AU: So you ran the data and noticed there was a sharp inflection point—or maybe not sharp, but certainly things started to get worse after 1960. When you first saw that, what were your hypotheses? At that point, you’ve got to start looking at whatever variables you can to explain it. What did you think the answer was, and what did you think the confounding variables might be?
ZB: My expectation was that two things would primarily explain the change. My background is in studying undergraduate admissions, so I thought the first explanation would be rising meritocracy in admissions. That might have made it harder for lower-income and lower-testing kids to get access to high-quality education. I also thought changes in affirmative action and in access to selective schools for kids from different backgrounds, along with rising tuition that made it harder for lower-income kids to afford those schools, could have played a big role. That was one possible story.
The second possible story is that it had nothing to do with the causal effect of college at all. Instead, maybe the poor kids who go to college today aren’t as academically strong as they were in the past. Perhaps in the past only the brilliant poor kids went to college, while all the rich kids went regardless of ability. So it could have looked like poor kids were getting a big benefit from college, when in fact those few who made it would have done well anyway.
It turns out neither of these explanations is the primary driver of rising regressivity. On the test score story, it’s always been the case that rich kids who go to college have relatively higher test scores than rich kids who just graduate high school—and that poor kids who go to college have relatively lower scores compared to their peers. That hasn’t changed since 1960.
And on the access story, it’s always been the case that rich kids dominate the schools we now think of as “good”—the fancy private universities and the flagship public universities. But over the last 50 years, poor kids have actually slightly increased their representation at those schools, not the other way around. Rising meritocracy hasn’t pushed poor kids out. If anything, the variety of admissions programs universities have implemented to boost enrollment among racial minority and lower-income students has relatively increased their numbers compared to 1950 or 1960.
AU: You were just making the case that this isn’t about compositional change in where poor students went. I heard you say there are more lower-income students at Harvard, Yale, and MIT than there were 50 or 60 years ago—and I have no doubt that’s true. But as a percentage of all poor students, surely that’s not true. The vast wave of lower-income students, often from minority backgrounds, are ending up in community colleges or non-flagship publics. Surely that has to be part of the story.
ZB: Yes. It turns out there are three primary trends that explain this rising collegiate regressivity, and you just hit on two of them.
The first is exactly your point: lower-income students primarily go to satellite public universities, basically all the non–R1 publics. Higher-income students, if they attend a public university, tend to go to the flagship, research-oriented universities.
I’ll skip talking about Harvard, Yale, and Princeton—almost no one goes to those schools, and they’re irrelevant to the overall landscape.
AU: Because they’re such a small piece of the pie, right?
ZB: Exactly. Fewer than 1% of students attend an Ivy Plus school. They don’t matter when we’re talking about American higher education as a whole. The flagships, though, matter a lot. About a third of all four-year college students go to a research-oriented flagship public university.
What’s happened since 1960 isn’t that poor kids lost access to those schools—it’s that they never really had access in the first place. Meanwhile, those schools have gotten much better over time. If you look at simple measures of university quality—student-to-faculty ratios, instructional expenditures per student, graduation rates—or even our own wage “value-added” measures (the degree to which each university boosts students’ wages), the gap between flagship and non-flagship publics has widened dramatically since the 1960s.
The flagships have pulled away. They’ve gotten more money—both from higher tuition and from huge federal subsidies, in part for research—and they’ve used that money to provide much more value to the students who attend. And those students tend to be higher income.
The second trend is what you mentioned: increasing diversion to community colleges. Interestingly, before 1980, community colleges were already well established in the U.S. and enrolled only slightly more lower-income than higher-income students. They actually enrolled a lot of high-income students, and the gap was small. Since the 1980s, though, that gap has grown substantially. There’s been a huge diversion of lower-income students toward community colleges—and those schools just provide lower-value education to the students who enroll.
AU: At some level this is a sorting story, right? You see that in discussions about American economic geography—that people sort themselves into certain areas. Is that what you’re saying is happening here too?
ZB: It’s not about sorting inside the four-year sector. It’s about sorting between the two- and four-year sectors. And on top of that, we think there’s fundamentally a story about American state governments choosing to invest much more heavily in their flagship publics—turning them into gem schools, amazing schools—while leaving the other universities in their states behind. Those flagships enroll far more higher-income than lower-income students.
AU: When I was reading this paper, one thing that struck me was how hard it is to read about American higher education without also reading something about race. The last time you were on, we were talking about SCOTUS and the Fair Harvard decision. But as far as I can tell, this paper doesn’t talk about race. I assume that goes back to our earlier discussion about data limitations—that race just wasn’t captured at some point. What’s the story there?
ZB: No—we observe race throughout this entire period. In fact, you could basically rewrite our study and ask: how has the relative value of college for white kids compared to Black kids changed over the last hundred years? I suspect you’d see very similar patterns.
The datasets we’re working with observe both parental income and race, but they aren’t large enough to separately analyze, for example, just white students and then compare lower- and higher-income groups over time. There’s a sense in which you could tell our story in terms of race, or you could tell it in terms of class—and both would be right. At a first-order level, both are happening. And within racial groups, the evidence we’ve been able to collect suggests that class gaps have substantially widened over time.
Similarly, we show some evidence that even within the lower-income group there are substantial gaps between white and Black students. So in part, I saw this as an interesting complement to the work I’d already done on race. It points out that while race is part of the story, you can also reframe the entire conversation in terms of America’s higher education system leaving lower-income students behind—irrespective of race.
AU: Right, because it strikes me that 1960 is only six years after Brown v. Board of Education. By the early to mid-1960s, you’d start to see a bigger push of Black students entering higher education, becoming a larger share of the lower-income sector. And a few years later, the same thing with Latino students.
Suddenly lower-income students are not only starting from further behind, but also increasingly made up of groups who, irrespective of education, face discrimination in the labor market. Wouldn’t that pull things down? Wouldn’t that be part of the explanation?
ZB: Keep in mind that when we measure wage premiums, we’re always comparing people who went to college with people who only finished high school. So there are Black students on both sides of that comparison, across both lower- and higher-income groups.
That said, I think your point is well taken. We don’t do any work in the paper specifically looking at changes in the racial composition of students by parental income over this period. One thing we do show is that the test scores of lower-income students who go to college aren’t falling over time. But you’re probably right: while racial discrimination affects both college-goers and non-college-goers, it’s entirely plausible that part of what we’re picking up here is the changing racial dynamics in college-going.
AU: What’s the range of policy solutions we can imagine here, other than, you know, taking money away from rich publics and giving it to community colleges? That’s the obvious one to me, but maybe there are others.
ZB: And not just community colleges—satellite publics as well. I’ve spent the last five years of my life thinking about how to get more disadvantaged students into highly selective universities, and what happens when they get there. The main takeaway from that research is that it’s really hard to get lower-income students into highly selective universities. It’s also expensive, because of the financial aid required.
But once they get into those schools, they tend not only to benefit in terms of long-run wage outcomes, they actually derive disproportionate value. Highly selective schools are more valuable for lower-income kids than for the higher-income kids who typically enroll there.
What I’ve learned from this project, though, is that the closing of higher education’s mobility pipeline isn’t fundamentally about access. It’s about investments—by state governments, by students, by donors, by all the people and organizations that fund higher education. Over time, that funding has become increasingly centralized in schools that enroll a lot of wealthy students.
So, the point you brought up—redirecting funds—is important. In California they call it “rebenching”: siphoning money away from high-funded schools and pushing it toward low-funded schools. There’s very little academic research on what happens when you do that, but our study suggests that this century-long trend of unequal investment has disadvantaged low-income students. Potentially moving in the other direction could make a real difference for them.
AU: Zach, thanks so much for being with us today.
ZB: My pleasure.
AU: It just remains for me to thank our excellent producers, Tiffany MacLennan and Sam Pufek, and you, our listeners and readers, for joining us. If you have any questions or comments about today’s podcast, or suggestions for future editions, don’t hesitate to get in touch at [email protected].
Join us next week when our guest will be Dmitry Dubrovsky, a research scholar and lecturer at Charles University in Prague. He’ll be talking to us about the slow-motion collapse of Russian higher education under Vladimir Putin. Bye for now.
*This podcast transcript was generated using an AI transcription service with limited editing. Please forgive any errors made through this service. Please note, the views and opinions expressed in each episode are those of the individual contributors, and do not necessarily reflect those of the podcast host and team, or our sponsors.
-

Where are our young leaders?
Why is it that young leaders are in such short supply?
Former Irish President Mary Robinson recently gave one of the most forceful condemnations of Israel’s war on Gaza. Now the UN High Commissioner for Human Rights, Robinson visited Egypt and the Rafah border and called on states to implement “decisive measures” to halt the genocide and famine in Gaza.
“Governments that are not using all the tools at their disposal to halt the unfolding genocide in Gaza are increasingly complicit,” she said.
Robinson is a member of an organization that calls itself “The Elders.” Founded in 2007 by Nelson Mandela, the South African political prisoner turned president, the group advocates peace, human rights and environmental sustainability.
In her comments, Robinson chided today’s leaders for not fulfilling their legal obligations. “Political leaders have the power and the legal obligation to apply measures to pressure this Israeli government to end its atrocity crimes,” she said.
Robinson is 81 years old. Where are the young leaders making such statements? Where are they organizing groups like The Elders?
Youth power
The media’s attention to Robinson was impressive. Her August press conference was followed by several lengthy interviews on major networks. An independent group like The Elders — whose members include former presidents, UN officials and civil society activists — deserves recognition. It also invites reflection on the role of age in today’s accelerated time.
Being elderly and having once held an important position was not always politically positive. “Don’t trust anyone over 30,” was a popular expression in the 1960s. Dr. Martin Luther King Jr. was just 26 when he led the 1955 Montgomery bus boycott and 34 when he delivered his “I Have a Dream” speech during the 1963 Washington rally in front of the Lincoln Memorial. John F. Kennedy was 30 when he was elected to the U.S. Congress and 43 when he was elected president. Student leaders made their marks on U.S. politics in the 1960s.
Mario Savio was 21 when he led the Berkeley Free Speech Movement in California, which demonstrated the political power of student protests.
Mark Rudd was a 20-year-old junior when he led strikes and student sit-ins at Columbia University to push for student involvement in university decision making.
Tom Hayden was 20 when he cofounded Students for a Democratic Society (SDS), a national student movement that opposed the Vietnam War and pushed for a complete reform of the political system. At age 22, he wrote the Port Huron Statement, a political manifesto that called for non-violent student activism and widespread civil disobedience achieve the international peace and economic equality that government leaders had failed to achieve.
Savio, Rudd and Hayden were more than just campus activists; they were front page national news.
Age politics
Where are the student leaders opposing Trump’s attack on universities and freedom of expression now? College presidents, professors and boards of trustees are shouldering the burden. There is a generational vacuum.
Youth and youthful dynamism are no longer viewed as political positives. Today, no one could imagine the 79-year-old Donald Trump playing touch football on a beach in Florida as John F. Kennedy and family did at Hyannis Port on Cape Cod when he was president.
In reality, Kennedy suffered from many serious medical conditions but they were largely hidden from the public; it was crucial that he maintain his youthful image. Trump swinging a golf club and riding in a golf cart is not a youthful image; even his awkward swing shows his age.
Nor are the pictures of the members of his Mar-a-Lago crowd youthful; they look like a meeting of grandparents. As slogans reflecting their times, Make America Great Again is far from the New Frontier which called for an end to poverty and investing in technology and science to send humans to the moon.
Robinson visited the Rafah crossing with another member of The Elders, Helen Clark. Clark is 75 years old, the former Prime Minister of New Zealand and United Nations Development Program administrator.
Generational change
Of her visit Clark said that she was horrified to learn from United Nations Sexual and Reproductive Health Agency that the birth rate in Gaza had dropped by over 40% in the first half of 2025, compared to the same period three years ago. “Many new mothers are unable to feed themselves or their newborn babies adequately, and the health system is collapsing,” Clark said. “All of this threatens the very survival of an entire generation.”
Based on her years of experience, Clark wisely talked of generational change.
Age benefits people who, like Robinson and Clark, have held important positions. Because of that experience, members of The Elders take no political risks by speaking out.
The 83-year-old U.S. Senator Bernie Sanders is a notable exception of an elder speaking out in the United States while still in office. For whatever reasons, the elderly members of the Senate — there are currently seven senators who are in their 80s and 17 are in their 70s — have been particularly silent on issues like Gaza.
In fact, they have been particularly silent on most issues.
Where are the Savio/Rudd/Haydens today? A comparable young leader is Greta Thunberg. Greta was only 15 when she initiated the climate strike movement Fridays for Future. But while Greta initiated the movement, she did not organize it as Tom Hayden did with the formation of the SDS. Thunberg is an important symbol and example of courage — the drone attack on her Gaza-bound “Freedom Flotilla” is beyond reprehensible and consistent with Israel’s total war — but she is not a movement organizer on a national or global level.
What makes statements by people like Robinson and Clark so impressive is that they stand out in a realm of stunning silence.
The New Frontier
The Democratic Party in the United States, for example, has no serious leadership. (The same might be said for Socialists in Europe and the Labour Party in Great Britain.) The Democrats inability to rally around 33-year-old Zohran Mamdani who is running for mayor of New York City is an example of the Party’s cowardice and/or lack of vision.
While the older, established Democrats are quick to criticize Trump, they offer no new strategies or actions.
We are desperately waiting for something new. JFK’s motto The New Frontier touched a foundational American embrace of the frontier, the space between the known and new. Back in 1893, historian Frederick Jackson Turner came up with a theory that the continual expansion of the American frontier westward allowed for continual reinvention and rebirth, and that shaped the character of the American people. This frontier theory is essential to an America’s identity built on always moving forward. In contrast, Trump’s return to the past is anti-frontier. MAGA is nostalgia and passé.
Where are today’s young progressives presenting new political possibilities as Hayden and his cohorts did with Port Huron and SDS? Or does asking that question show that I am being too nostalgic about the past as well?
A version of this article was published previously in the magazine Counterpunch.
Questions to consider:
1. Who are “The Elders” and what are they trying to achieve?
2. What was “The New Frontier” and what did it say about the American character?
3. Do you think you would be more likely to vote for some very old over someone very young for political office? Why?
-
There’s all kinds of ways to bleep out speech
This morning we woke to the news that the ABC television network in the United States had suspended late night talk show host Jimmy Kimmel indefinitely over a statement he made about the accused assassin of right-wing political activist Charlie Kirk. In July, the CBS network announced that it would end The Late Show with Stephen Colbert in May. Colbert has for years mocked and criticized Donald Trump. These two announcements got us thinking about all the different ways governments and those in power try to silence speech.
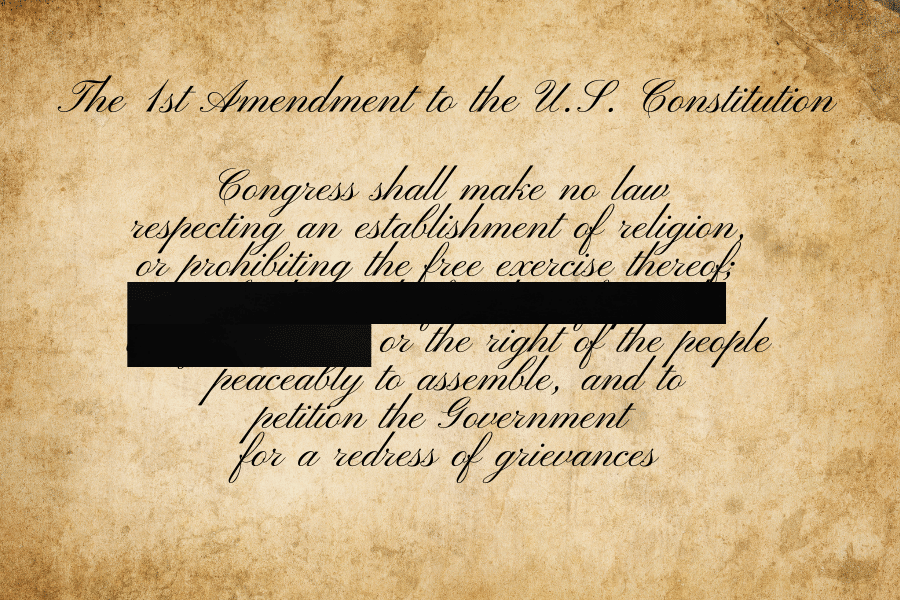
The very first amendment to the U.S. Constitution begins with this phrase:
Congress shall make no law respecting an establishment of religion, or prohibiting the free exercise thereof; or abridging the freedom of speech, or of the press …
Because of that amendment, the world has long considered the United States the model for free speech — few countries live up to the standard that the United States has historically set. But across the world now, free speech seems to be endangered. So to put into perspective the many ways censorship can occur and in the many places we see this happening, we decided to offer up an assortment of News Decoder stories on this topic by both our professional correspondents and student authors.
-

International Student Mobility Data Sources: A Primer
Part 1: Understanding the Types of Sources and Their Differences
There has perhaps never been more of a need for data on globally mobile students than now. In 2024, there were about 6.9 million international students studying outside their home countries, a record high, and the number is projected to grow to more than 10 million by 2030. Nations all around the world count on global student mobility for a number of reasons: Sending nations benefit by sending some of their young people abroad for education, particularly when there is less capacity at home to absorb all demand. Many of those young people return to the benefit of the local job market with new skills and knowledge and with global experience, while others remain abroad and are able to contribute in other ways, including sending remittances. Host nations benefit in numerous ways, from the economic contributions of international students (in everything from tuition payments to spending in the local economy) to social and political benefits, including building soft power.
At the same time, economic, political, and social trends worldwide challenge the current ecosystem of global educational mobility. Many top destinations of international students, including Canada and the United States, have developed heavily restrictive policies toward such students and toward migrants overall. The COVID-19 pandemic demonstrated that one global challenge can upend international education, even if temporarily.
Data plays a key role in helping those who work in or touch upon international education. All players in the space—from institutional officials and service providers to policymakers and researchers—can use global and national data sources to see trends in student flows, as well as potential changes and disruptions.
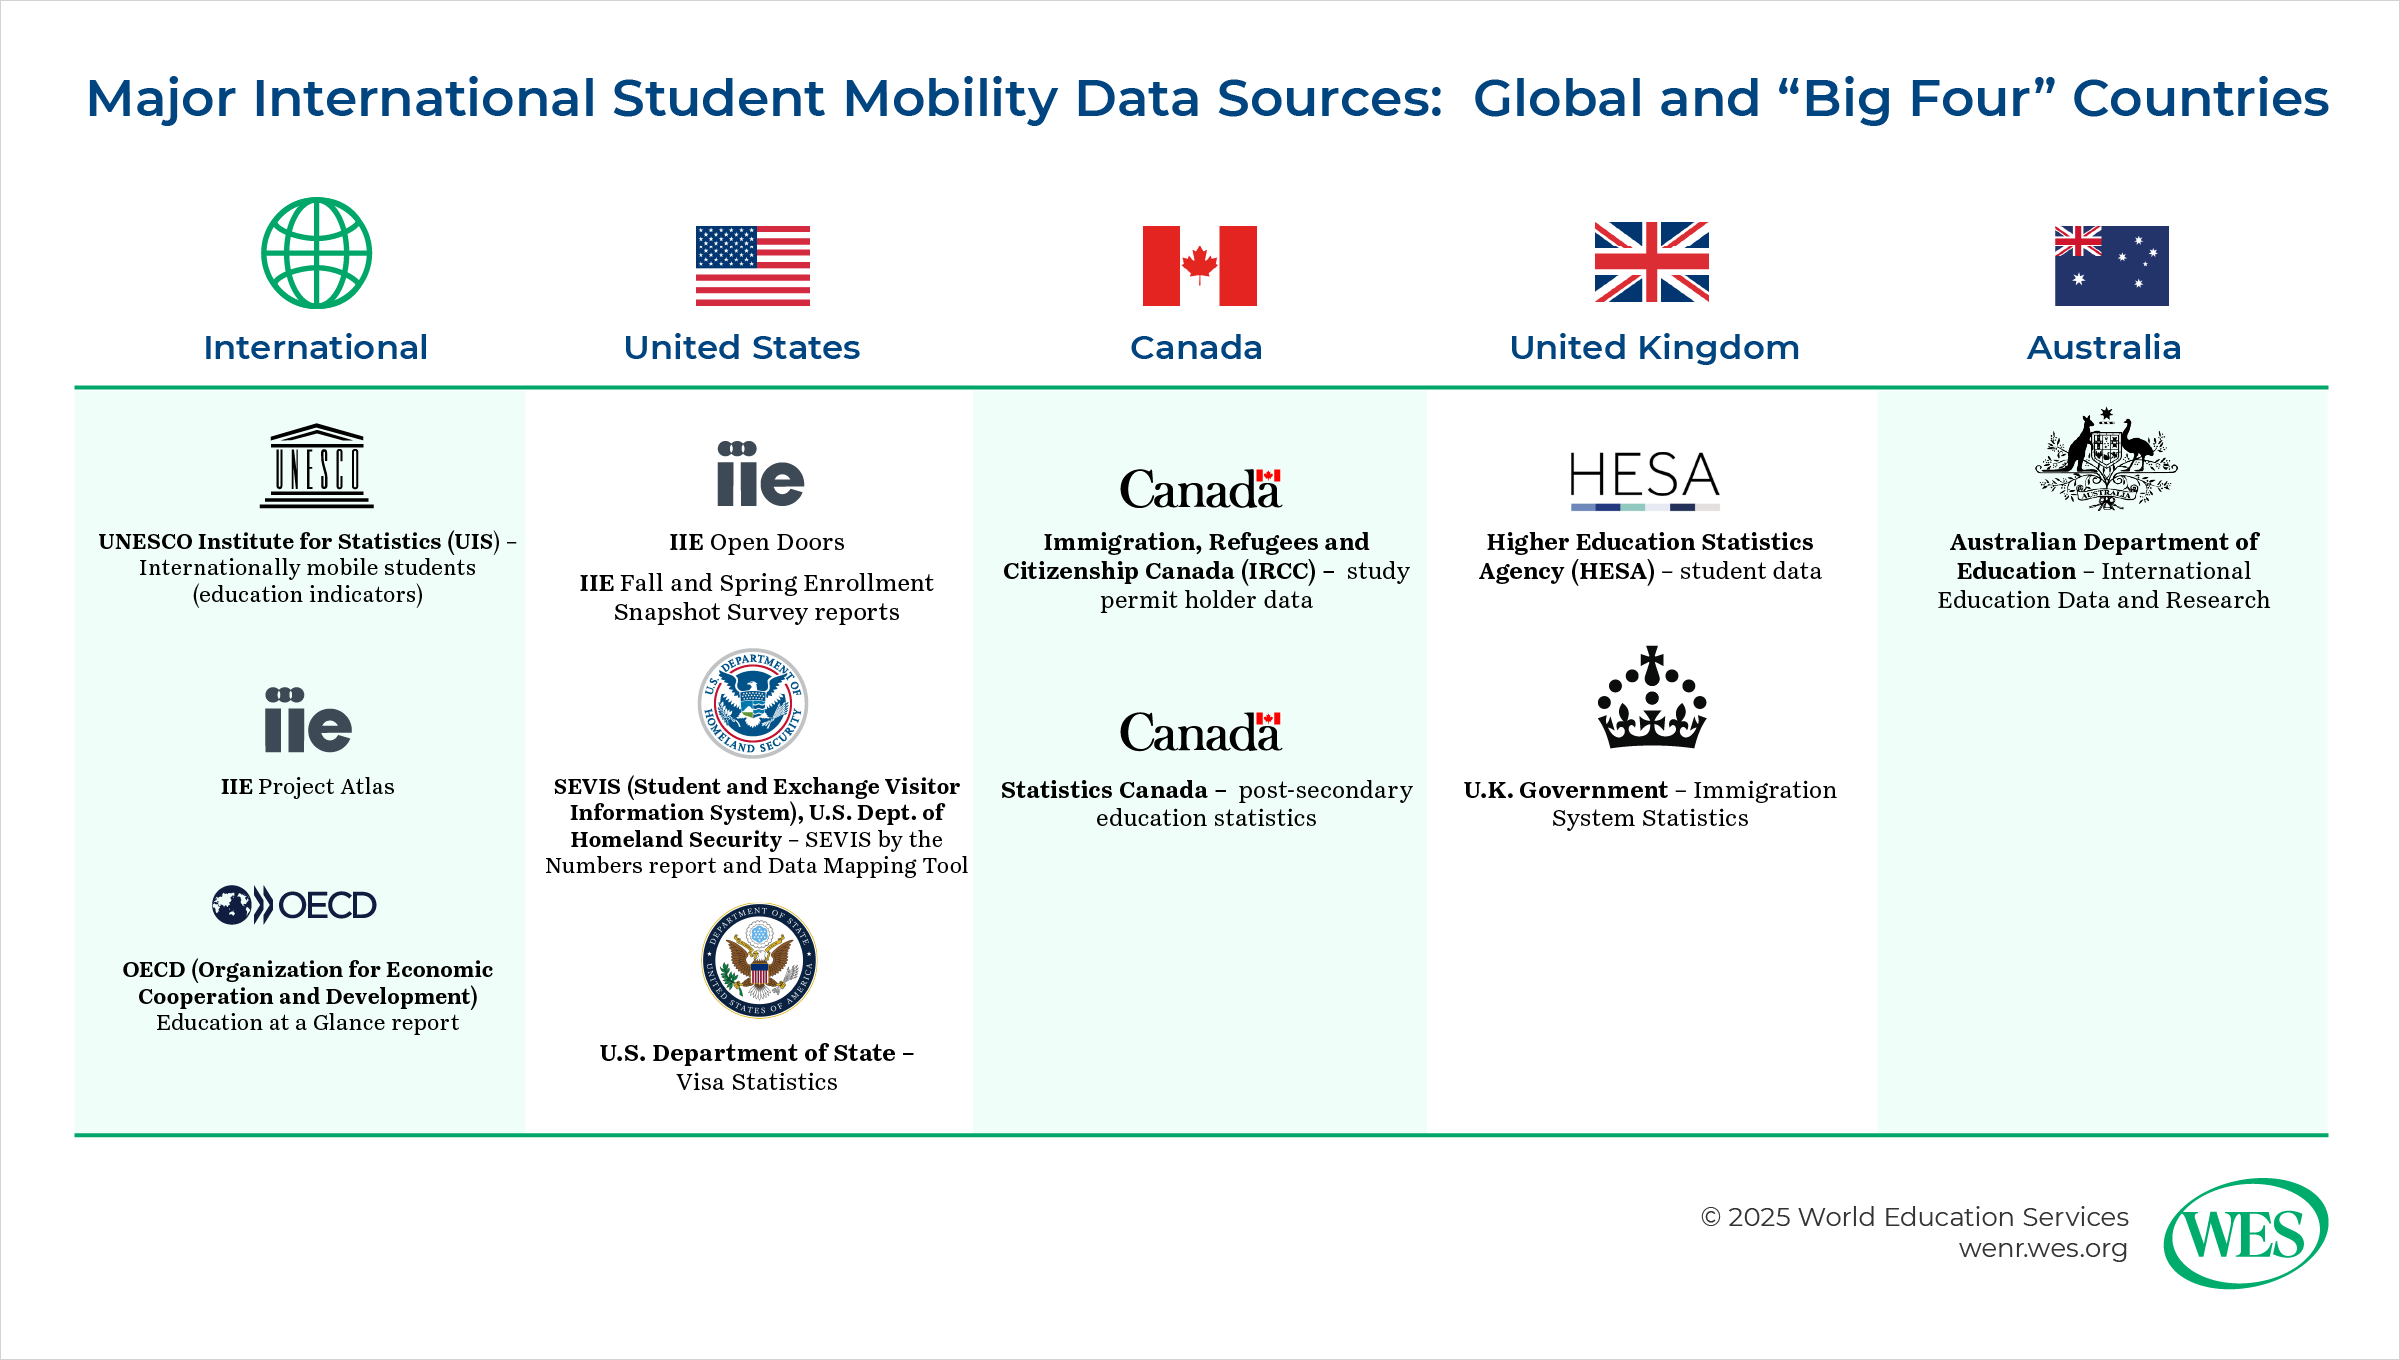
This article is the first in a two-part series exploring global student mobility data. In this first article, I will delve into considerations that apply in examining any international student data source. In the second, forthcoming article, we will examine some of the major data sources in global student mobility, both global and national, with the latter focused on the “Big Four” host countries: the United States, Canada, the United Kingdom, and Australia.
In utilizing any global student mobility data source, it is crucial to understand some basics about each source. Here are some key questions to ask about any source and how to understand what each provides.
Who collects the data?
There are three main types of entities that collect student mobility data at a national level:
- Government ministries or agencies: These entities are generally mandated by law or statute to collect international student data for specific purposes. Depending on the entity’s purview, such data could include student visa or permit applications and issuances, students arriving at ports of entry (such as an airport or border crossing), enrollment in an educational institution, or students registered as working during or after completing coursework.
- Non-governmental organizations (NGOs): Non-profit entities focused on international education or related fields such as higher education or immigration may collect international student data, sometimes with funding or support from relevant government ministries. One good example is the Institute of International Education (IIE) in the U.S., which has collected data on international students and scholars since 1948, much of that time with funding and support from the U.S. Department of State.
- Individual institutions: Of course, individual universities and colleges usually collect data on all their students, usually with specific information on international students, sometimes by government mandate. In countries such as the U.S. and Canada, these institutions must report such data to governmental ministries. They may also choose to report to non-governmental agencies, such as IIE. Such data may or may not otherwise be publicly available.
At the international level, the main data sources are generally an aggregation of data from national sources. There are three main efforts:
How are the data collected?
The method in which mobility data are collected affects the level of accuracy of such data. The sources that collect data internationally or on multiple countries, such as UNESCO Institute for Statistics (UIS) and IIE’s Project Atlas, are primarily aggregators. They collect the data from national sources, either government ministries or international education organizations, such as the British Council or the Canadian Bureau for International Education (CBIE).
For primary data collection, there are three main methods:
- Mandatory reporting: Certain government entities collect data by law or regulation. Data are naturally collected as part of processing and granting student visas or permits, as the S. State Department and Immigration, Refugees and Citizenship Canada (IRCC) do. In other cases, postsecondary institutions are required to track and report on their international students—from application to graduation and sometimes on to post-graduation work programs. This is the case in the U.S. through SEVIS (the Student and Exchange Visitor Information System), overseen by the U.S. Department of Homeland Security (DHS), through which deputized institutional officials track all international students. The data from this system are reported regularly by DHS. In other cases, data are collected annually, often through a survey form, as Statistics Canada does through its Postsecondary Student Information System (PSIS).
- Census: Some non-profit organizations attempt to have all postsecondary institutions report their data, often through an online questionnaire. This is the method by which IIE obtains data for its annual Open Doors Report, which tracks both international students in the U.S. and students enrolled in U.S. institutions studying abroad short-term in other countries.
- Survey: A survey gathers data from a sample, preferably representative, of the overall population—in this case, higher education institutions—to form inferences about the international student population. (This should not be confused with the “surveys” issued by government agencies, usually referring to a questionnaire form, typically online nowadays, through which institutions are required to report data.) This method is used in IIE’s snapshot surveys in the fall and spring of each year, intended to provide an up-to-date picture of international student enrollment as a complement to Open Doors, which reflects information on international students from the previous academic year.
When are the data collected and reported?
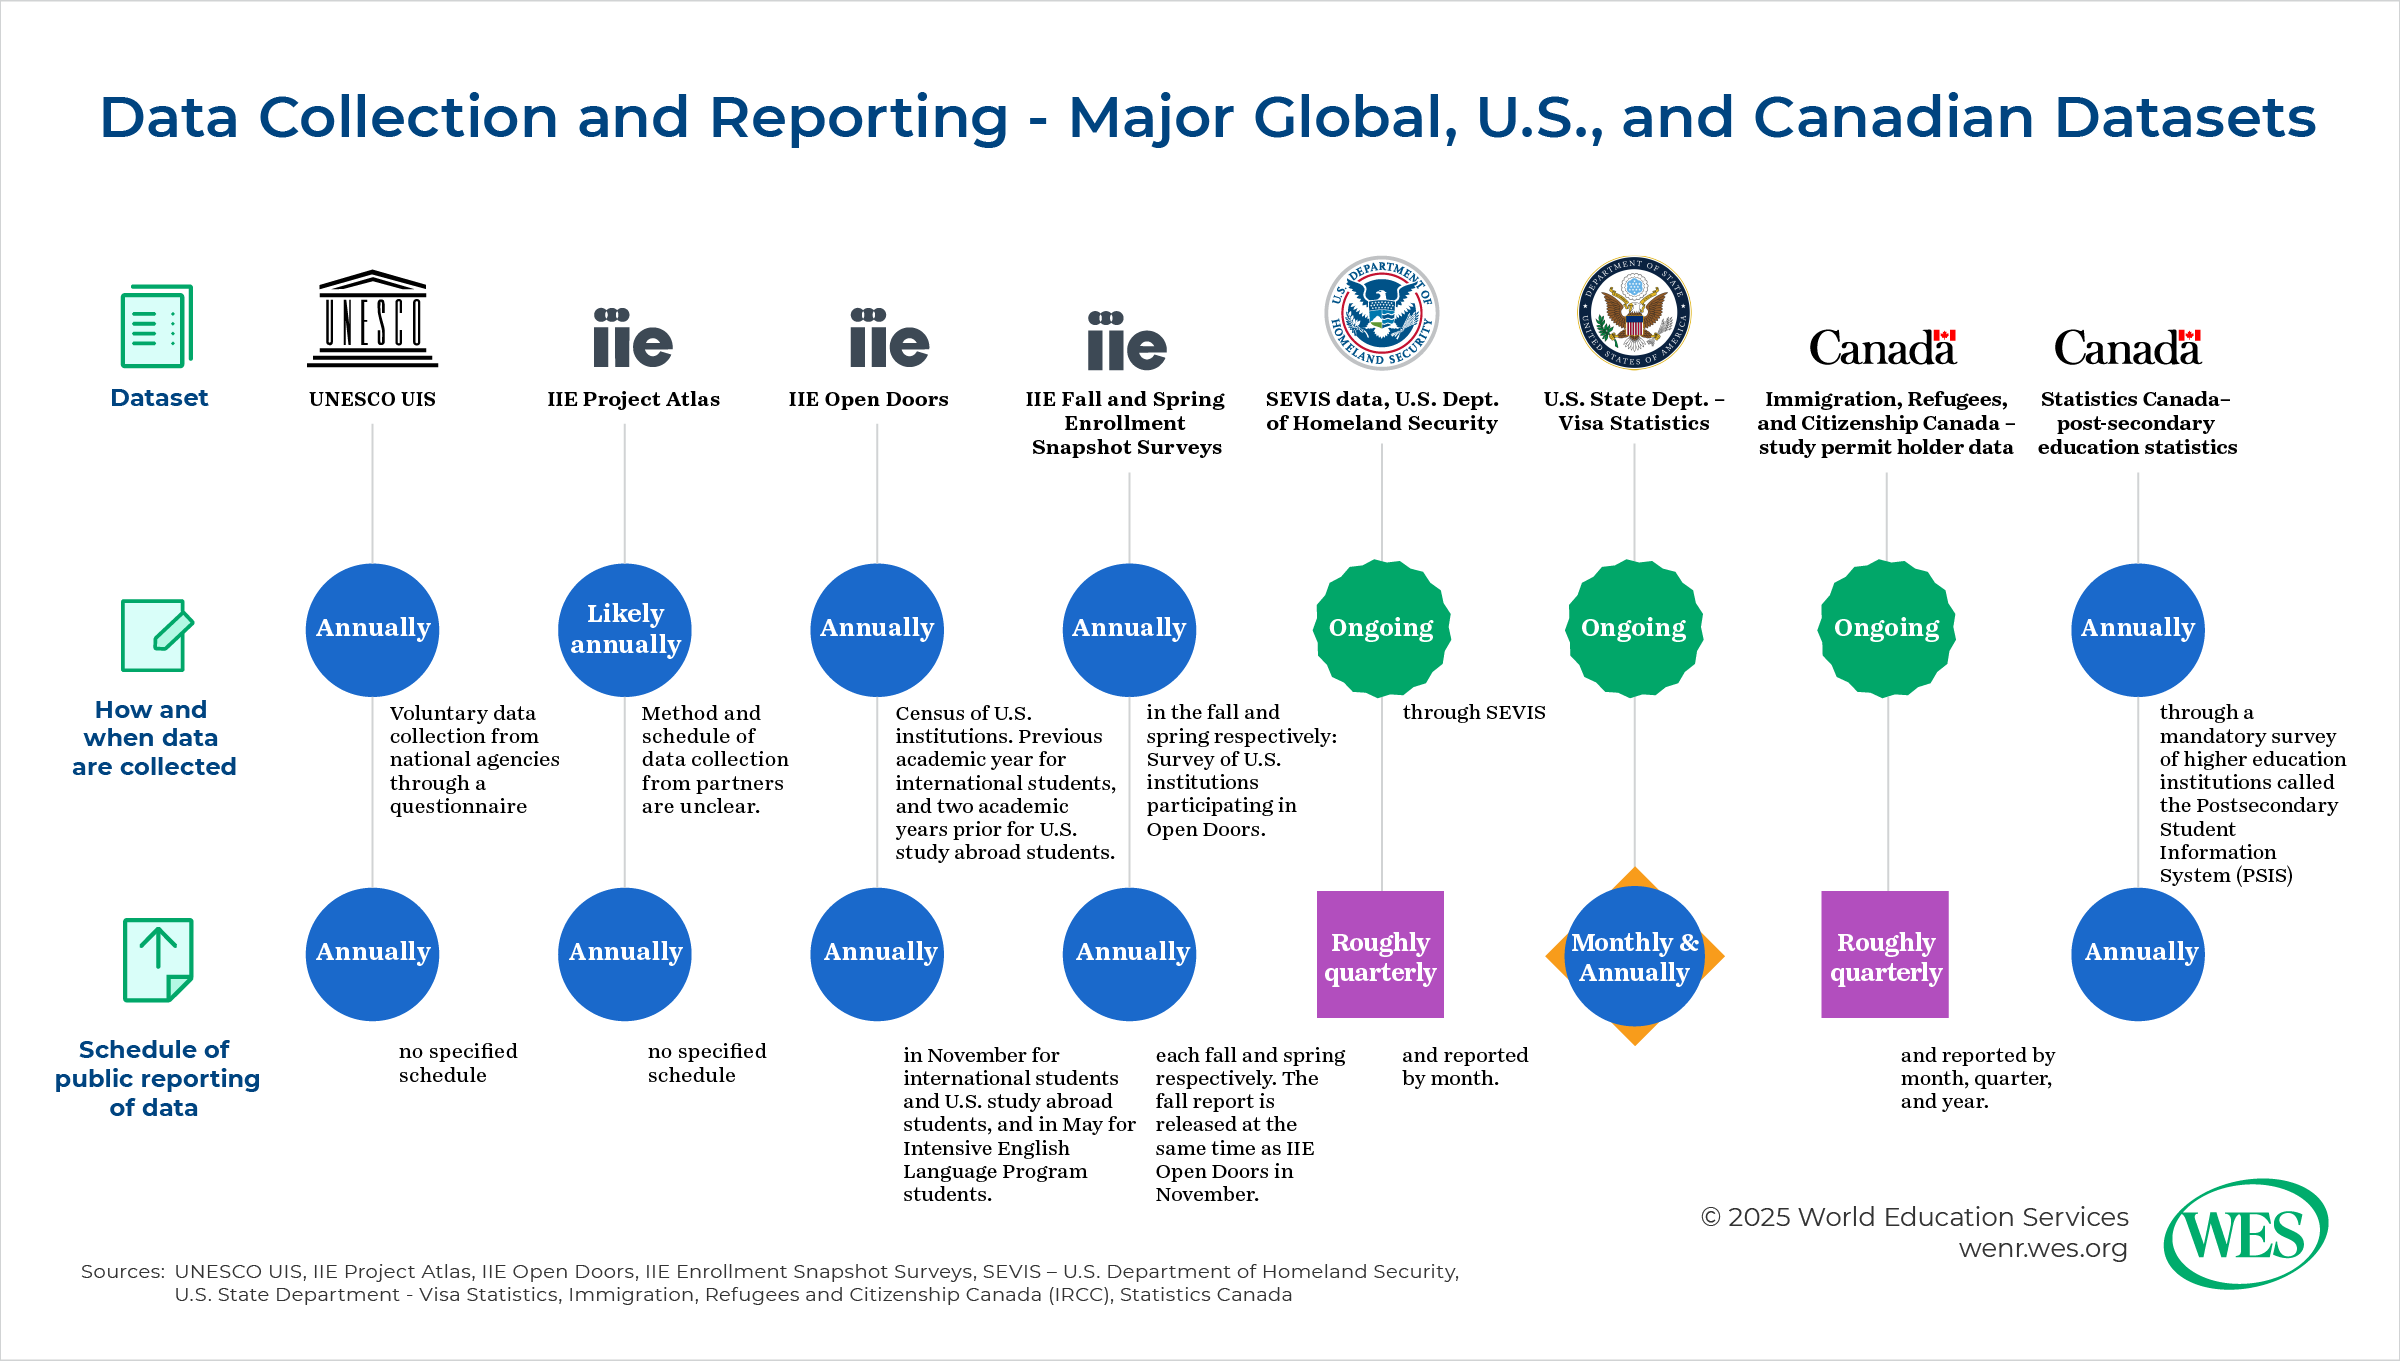
In considering data sources, it is important to know when the data were collected and what time periods they reflect. Government data sources are typically the most up-to-date due to their mandatory nature. Data are often collected continuously in real time, such as when a student visa is approved or when an international student officially starts a course of study. However, each ministry releases data at differing intervals. Australia’s Department of Education, for example, is well known for releasing new data almost every month. USCIS and IRCC tend to release data roughly quarterly, though both provide monthly breakdowns of their data in some cases.
Non-governmental entities generally do not collect data continuously. Instead, they may collect data annually, semiannually, or even less frequently. IIE’s Open Doors collects data annually for the previous academic year on international students and two years prior on U.S. study abroad students. The results for both are released every November.
The international aggregated sources receive data from national sources at widely varying times. As a result, there can be gaps in data, making comparison between or among countries challenging. Some countries don’t send data at all, often due to lack of resources for doing so. Even major host countries, notably China, send little if any data to UNESCO.
What type of student mobility data are included in the source?
Sources collect different types of student mobility data. One such breakdown is between inbound and outbound students—that is, those whom a country hosts versus those who leave the country to go study in other countries. Most government sources, such as IRCC, focus solely on inbound students—the international students hosted within the country— due to the organizations’ mandate and ability to collect data. Non-governmental organizations, such as IIE, often attempt to capture information on outbound (or “study abroad”) students. Many international sources, such as UNESCO UIS, capture both.
Another important breakdown addresses whether the data included degree-seekers, students studying abroad for credit back home, or those going abroad not explicitly for study but for a related purpose, such as research or internships:
- Degree mobility: captures data on students coming into a country or going abroad for pursuit of a full degree.
- Credit mobility: captures information on those abroad studying short-term for academic credit with their home institution, an arrangement often called “study abroad” (particularly in the U.S. and Canada) or “educational exchange.” The length of the study abroad opportunity typically can last anywhere from one year to as little as one week. Short-duration programs, such as faculty-led study tours, have become an increasingly popular option among students looking for an international experience. In most cases, the home institution is in the student’s country of origin, but that is not always the case. For example, a Vietnamese international student might be studying for a full degree in the U.S. but as part of the coursework studies in Costa Rica for one semester.
- Non-credit mobility: captures information on those who go abroad not for credit-earning coursework but for something highly related to a degree program, such as research, fieldwork, non-credit language study, an internship, or a volunteer opportunity. This may or may not be organized through the student’s education institution, and the parameters around this type of mobility can be blurry.
It’s important to know what each data source includes. Most governmental data sources will include both degree and credit mobility—students coming to study for a full degree or only as part of a short-term educational exchange. The dataset may or may not distinguish between these students, which is important to know if the distinction between such students is important for the data user’s purposes.
For outbound (“study abroad”) mobility, it’s easier for organizations to track credit mobility rather than degree mobility. IIE’s Open Doors, for example, examines only credit mobility for outbound students because it collects data through U.S. institutions, which track their outbound study abroad students and help them receive appropriate credits for their work abroad once they return. There is not a similar mechanism for U.S. degree-seekers going to other countries. That said, organizations such as IIE have attempted such research in the past, even if it is not an ongoing effort. Typically, the best way to find numbers on students from a particular country seeking full degrees abroad is to use UNESCO and sort the full global data by country of origin. UNESCO can also be used to find the numbers in a specific host country, or, in some cases, it may be better to go directly to the country’s national data source if available.
Non-credit mobility has been the least studied form of student mobility, largely because it is difficult to capture due to its amorphous nature. Nevertheless, some organizations, like IIE, have made one-off or periodic attempts to capture it.
Who is captured in the data source? How is “international student” defined?
Each data source may define the type of globally mobile student within the dataset differently. Chiefly, it’s important to recognize whether the source captures only data on international students in the strictest sense (based on that specific legal status) or on others who are not citizens of the host country. The latter could include permanent immigrants (such as permanent residents), temporary workers, and refugees or asylum seekers. The terms used can vary, from “foreign student” to a “nonresident” (sometimes “nonresident alien”), as some U.S. government sources use. It’s important to check the specific definition of the students for whom information is captured.
Most of the major student mobility data sources capture only data on international students as strictly defined by the host country. Here are the definitions of “international student” for the Big Four:
- United States: A non-immigrant resident holding an F-1, M-1, or certain types of J-1 (The J-1 visa is an exchange visa that includes but is not limited to students and can include individuals working in youth summer programs or working as au pairs, for example.)
- Canada: A temporary resident holding a study permit from a designated learning institution (DLI)
- United Kingdom: An individual on a Student visa
- Australia: An individual who is not an Australian citizen or permanent resident or who is not a citizen of New Zealand, studying in Australia on a temporary visa
Some countries make a distinction between international students enrolled in academic programs, such as at a university, versus those studying a trade or in a vocational school; there might also be distinct categorization for those attending language training. For example, in the U.S., M-1 visas are for international students studying in vocational education programs and may not be captured in some data sources, notably Open Doors.
Understanding the terminology used for international students helps in obtaining the right type of data. For example, one of the primary methods of obtaining data on international students in Canada is through IRCC data held on the Government of Canada’s Open Government Portal. But you won’t find any such dataset on “international students.” Instead, you need to search for “study permit holders.”
Does the data source include students studying online or at a branch campus abroad, or who are otherwise physically residing outside the host country?
Some universities and colleges have robust online programs that include significant numbers of students studying physically in other countries. (This was also true for many institutions during the pandemic. As a result, in the U.S., IIE temporarily included non-U.S. students studying at a U.S. institution online from elsewhere.) Other institutions have branch campuses or other such transnational programs that blur the line between international and domestic students. So, it’s important to ask: Does the data source include those not physically present in the institution’s country? The terminology for each country can vary. For example, in Australia, where such practices are very prominent, the term usually used to refer to students studying in Australian institutions but not physically in Australia is “offshore students.”
What levels of study are included in the dataset?
The focus of this article is postsecondary education, but some data sources do include primary and secondary students (“K-12 students” in the U.S. and Canada). IRCC’s study permit holder data includes students at all levels, including K-12 students. The ministry does provide some data broken down by level of study and other variables, such as country of citizenship and province or territory.
What about data on international students who are working?
Many host countries collect data and report on international students who are employed or participating in paid or unpaid internships during or immediately after their coursework. The specifics vary from country to country depending on how such opportunities for international students are structured and which government agencies are charged with overseeing such efforts. For example, in the U.S., the main work opportunities for most international students both during study (under Curricular Practical Training, or CPT) and after study (usually under Optional Practical Training, or OPT) are overseen by the student’s institution and reported via SEVIS. IIE’s Open Doors tracks students specifically for OPT but not CPT. By contrast, the main opportunity for international students to work in Canada after graduating from a Canadian institution is through the post-graduation work permit (PGWP). Students transfer to a new legal status in Canada, in contrast with U.S.-based international students under OPT, who remain on their student visa until their work opportunity ends. As a result, IRCC reports separate data on graduate students working under the PGWP, though data are relatively scant.
At some point, students who are able to and make the choice to stay and work beyond such opportunities in their new country transition to new legal statuses, such as the H-1B visa (a specialty-occupation temporary work visa) in the U.S., or directly to permanent residency in many countries. The data required to examine these individuals varies.
What about data beyond demographics?
While most international student datasets focus on numbers and demographic breakdowns, some datasets and other related research focus on such topics as the contributions of international students to national and local economies. For example, NAFSA: Association of International Educators, the main professional association for international educators in the U.S., maintains the International Student Economic Value Tool, which quantifies the dollar amounts that international students contribute to the U.S. at large, individual states, and congressional districts. Part of the intention behind this is to provide a tool for policy advocacy in Washington, D.C., and in state and local governments.
How can I contextualize international student numbers within the broader higher education context of a country?
Many countries collect and publish higher education data and other research. Each country assigns this function to different ministries or agencies. For example, in Canada, most such data are collected and published by Statistics Canada (StatCan), which is charged with data collection and research broadly for the country. In the U.S., this function falls under the Department of Education’s National Center for Education Statistics (NCES), which runs a major higher education data bank known as IPEDS, the Integrated Postsecondary Education Data System. StatCan does provide some data on international students, while IPEDS in the U.S. reports numbers of “nonresident” students, defined as “a person who is not a citizen or national of the United States and who is in this country on a visa or temporary basis and does not have the right to remain indefinitely.” This term likely encompasses mostly those on international student visas.
I will discuss some of these higher education data sources in Part 2 of this series.
How do I learn what I need to know about each individual dataset?
Each major data source typically provides a glossary, methodology section, and/or appendix that helps users understand the dataset. In Part 2 of this series, we will examine some of the major international and national data sources, including where to locate further such information for each.
It’s critical for users of student mobility data sources to understand these nuances in order to accurately and appropriately utilize the data. In the second part of this series, we will examine several prominent data sources.