
Get stories like this delivered straight to your inbox. Sign up for The 74 Newsletter
Chronic absenteeism is a longstanding problem that has surged to troubling levels. Recent data show that in 20 states, more than 30% of students are chronically absent, about twice the rate seen before the pandemic. Absenteeism is a multifaceted problem, and the reasons students stop showing up aren’t always academic. Sometimes it’s because they don’t feel connected to their school, or they are not engaged in the curriculum. Other times, they face adversity outside the classroom. While the problem is complicated, it’s easy to overlook one of its simplest, most effective solutions: What if the key to keeping students is a performance stage, a music room or an art studio — a creative outlet to shine?
Despite decades of research, arts education is still treated as a “nice-to-have” when education budgets allow. From 2015 to 2019, the NAMM Foundation conducted a four-year study across 1,700 New York City public schools serving over 1.1 million students. They found that schools offering music and arts programming had lower rates of chronic absenteeism and higher overall school-day attendance than those that didn’t. Similarly, a comparison of cohort data over seven years found that dropout rates fell from 30% to just 6% among students participating in consistent arts programming.
Clearly, the arts are a powerful tool for academic engagement, resilience and, most importantly, graduation. For example, after tracking more than 22,000 students for 12 years, the National Dropout Prevention Center found that those with high levels of involvement in the arts were five times more likely to graduate from high school than those with low involvement.
But while over 90% of Americans feel the arts are important for education, only 66% of students participate, and access remains uneven. Charter schools, the fastest-growing segment of public education, have the lowest availability of arts courses: Just 37% of public charter high schools offer arts instruction. Students in charter schools, military families and homeschool programs are too often the ones with the fewest opportunities to engage with the arts, despite needing them most.
This is an issue that the Cathedral Arts Project in Jacksonville, Florida, is trying to solve.
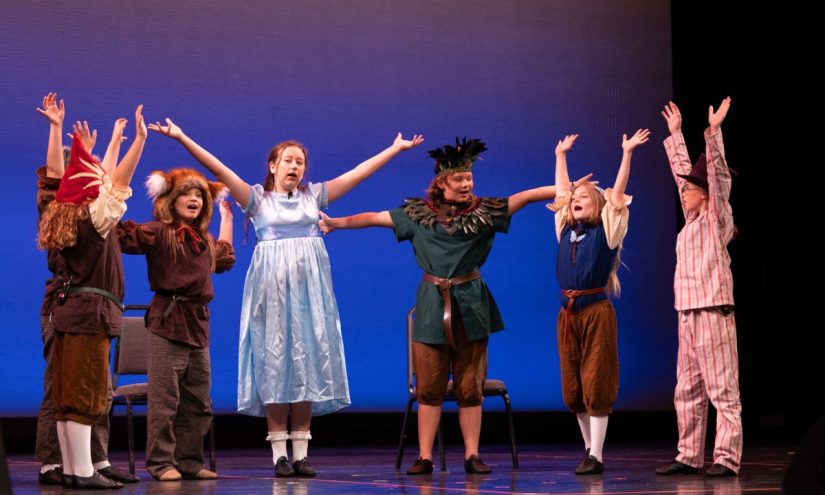
In partnership with and with funding from the Florida Department of Education, our program piloted a year-long arts education initiative during the 2024-25 school year, reaching more than 400 students in charter schools, homeschools, military families and crisis care. Our teaching artists visited classrooms weekly, providing instruction in dance, music, visual arts and theater. Throughout the year, students in kindergarten through high school found joy, confidence and connection through creative learning. Homeschool students brought history to life through art projects, children from military families found comfort and stability during times of deployment and young people in crisis discovered new ways to express themselves and heal. Each moment affirmed the power of the arts to help children imagine what’s possible.
To better understand the impact of this work, we partnered with the Florida Data Science for Social Good program at the University of North Florida to analyze reports and survey evaluations collected from 88% of program participants. Here’s what we found:
Students grew not only in artistic skill, but also in self-confidence, teamwork, problem-solving and engagement. After completing the program, over 86% of students said they “like to finish what they start” and “can do things even when they are hard” — a key indicator of persistence, which is a strong predictor of long-term academic success. Students rated themselves highly in statements like, “I am good at performance.”
Families noticed, too. In the age of screens, nearly three-quarters reported that their child had increased in-person social interaction since beginning arts programming and had improved emotional control at home. Nearly one-third saw noticeable gains in creative problem-solving and persistence through challenges.
According to the State of Educational Opportunity in America survey conducted by 50CAN, parents view the arts as a meaningful contributor to their child’s learning, and they want more of it. In Florida, where families have been given the power of school choice, they’re increasingly seeking out programs that inspire creative thinking and meaningful engagement while promoting academic success. But finding them isn’t always easy. When funding allows, traditional public schools may offer band or visual arts, but these options are often unavailable to families choosing alternative education options for their children.
Now in its second year, our program fills this critical gap by working directly with school choice families across northeast Florida, bringing structured arts instruction to students who otherwise wouldn’t have access.
What makes the arts such an effective intervention? It’s structure, expression and connection. When students learn through the creative process, they navigate frustration, build resilience and find joy in persistence. These are not soft skills — they’re essential for survival, and increasingly important in today’s workplaces.
Arts education is a necessary investment in student achievement. It’s time for other states to treat it that way and follow Florida’s lead.
Did you use this article in your work?
We’d love to hear how The 74’s reporting is helping educators, researchers, and policymakers. Tell us how


