In the northern part of the country of a thousand hills, amidst volcanoes and the freezing air, there resides a Catholic high school. My name is Anderson and this is my story. I went to study there right after finishing my primary school.
The school was competitive; the smartest, most intelligent and most talented students were found there. It was a school of sciences and it used to be in the top five best high schools in the country. It had an amazing environment. Though strict academically, the teachers were among the best.
When I arrived, it wasn’t that hard to fit in because my elder sister had studied there before me. Some senior students recognized the resemblance and helped me get used to the school. This also gave me the privilege of not being bullied.
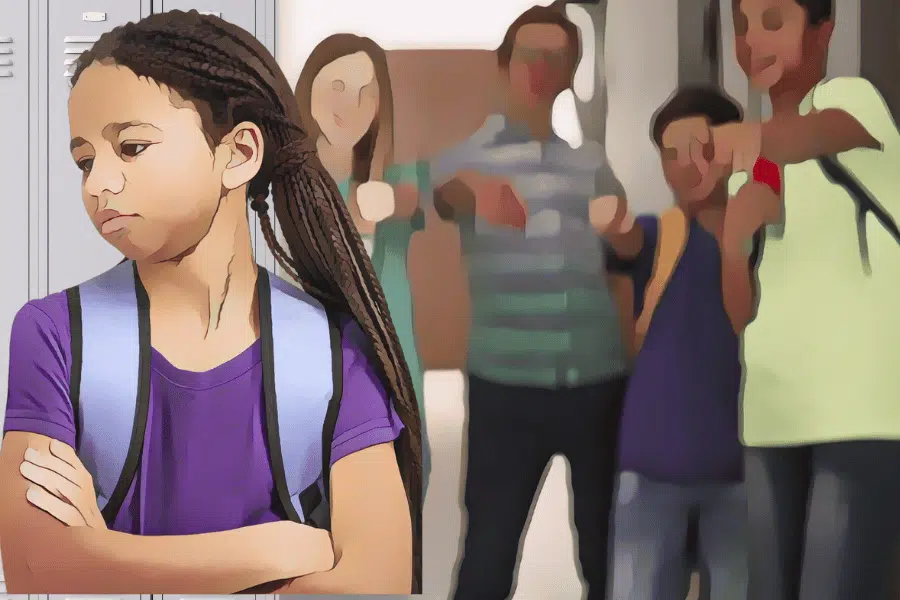
Normally, new students in S1 were bullied by seniors and couldn’t report it because they were scared of what might happen. The bullying was actually different based on gender. Boys were beaten severely, while girls were pressured into “dating” seniors. You might think dating sounds harmless, but it often involved bullying too.
There was a male friend of mine who was told to sit on his fork (the one used when we are eating) and say his weight — if he didn’t, the other students would beat him badly. This was also ridiculous because a fork cannot be used to measure someone’s weight. Another was given a leaf from a tree and told to use it to call his parents — again, he was beaten. This was a type of bullying because obviously you can’t talk on the leaf; they wanted him to pretend that the leaf is the phone.
On the other hand, my girlfriend was called out by senior boys, made to greet each one in a way they preferred and surrounded by a big circle of them. In summary, the first year was really hard for some students.
The bullied become bullies
By the second year, we were seniors to new students and some of us began to bully them. At this point, I understood the perspective of bullies — though it didn’t justify their actions. Seeing new students, you feel the tendency to assert your seniority and demand respect.
Some classmates acted out of revenge, targeting new students for what they had endured. On my side, I welcomed them with kindness and tried to help them adapt, knowing how hard it had been.
We used to have shows, which were my favorite part. I loved fashion and wanted to model in the shows, but I was always scared. During the shows, boys would often stand at the entrance, waiting to touch the girls’ bodies; breasts, buttocks, even private parts. Girls could complain, but some students and authorities argued that some girls “wanted to be touched.”
Others said that if girls didn’t want it, they could avoid participating or avoid wearing revealing clothes. Though some authorities promised to investigate, they often ignored the problem. Shows were considered entertainment, so the school left the organization to students. At some point, students feared reporting, worried the school might ban shows entirely.
It wasn’t only during shows. In class, we had a group of bullies we studied with. When the lights went out, girls would run outside immediately, because boys would touch them by force in the darkness.
When harassment is condoned
Once, I was sitting in class, my head on the desk, taking a nap. The lights went out and I didn’t notice. I woke up surrounded by boys. When I tried to leave, they blocked my way. One of them, called Chris, touched my breasts and others grabbed me as well. I felt scared, ashamed and angry. They were about to do more, but fortunately, other students started entering the class, and they left.
I laid my head back on the desk and cried. When people asked what was wrong, I couldn’t say. I had few friends; just my twin sister and another girl. When I reached the dormitory, I cried the whole night. My friend checked on me and though I hesitated at first, she comforted me.
I opened up and told her the story. To my surprise, she had also been harassed by the same boy, Chris. He was undisciplined and we didn’t know how to report him; there was no evidence and I wasn’t ready.
I spent months blaming myself. I was ashamed, hated myself and even had suicidal thoughts. My heart felt broken into pieces and no day passed without crying. But my twin sister was there for me. We cried together and I felt comforted. She suggested that we learn karate so no boy would dare harass me again.
We joined a karate club at school. It was amazing. The group was friendly, teaching discipline, teamwork and flexibility. Chris still mocked me, but I knew he was scared. In class, he never bullied me again. I continued learning karate even in other schools.
Fighting harassment
At other schools, I began my journey in leadership. I was voted Head Girl at two schools, started reading about feminism and realized I was a feminist. I began challenging unfair school policies that hindered one gender. On many campuses, girls were forced to do cleaning chores because culture expected them to be “decent” and “clean.”
Boys were allowed privileges girls could not have, without clear reason. It was a hard battle because authorities were biased. When I finished high school, I was voted Minister of Gender Promotion at my campus.
Reflecting on my high school experience, I realized many other girls knew stories of friends who were sexually assaulted and who couldn’t report it. Sometimes it was done to them by teachers or fellow students or authorities.
Schools often silence reports to protect their reputation. I understand that, but it shouldn’t come at the cost of student safety. There weren’t reporting platforms in place, but when girls tried to report, they were sometimes blamed, told they “wanted it.”
All of this motivated me to start a high school research project to assess the impact of school policies, sexual harassment and sextortion (this means when someone asks for sexual intercourse in exchange for a certain favor. In this context it may be to give you grades or other favors which you can get after having sex with that person offering it) on gender equality outcomes in high schools.
I am still working on my proposal, applying feedback and hoping for approval. As a survivor, I want to help my younger sisters get justice. I want to ensure no other girl cries alone at night, hiding the trauma she endured. I want to be their voice and advocate for solutions as youth.
This is my story — though it is still being written and it is far from over.
Questions to consider:
1. How can someone who is bullied become a bully?
2. Where do you think that some people get the idea that sexual harrassment is acceptable?
3. Have you ever been bullied or felt harrassed at school?


