
Published: November 13, 2025
by Kelly Famuliner
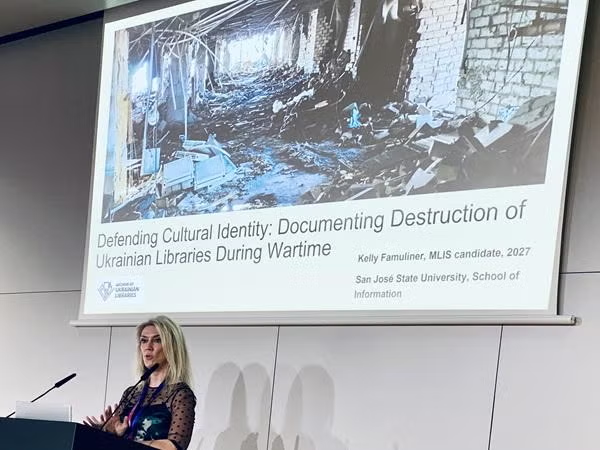
Attending and presenting at the International Archives Congress
in Barcelona, Spain––an event that feels like the Olympics for
archivists!––was a transformative experience. I am incredibly
honored to have had the opportunity to represent Team Ukraine and
the SJSU iSchool, bringing awareness about the impactful
partnership between the Ukrainian Library Association and library
and information science professionals and scholars from around
the U.S., united in solidarity towards the creation of a digital
archives documenting the destruction of Ukrainian libraries
during the ongoing war.
The archives, Ukrainian Libraries During Wartime, will
offer insight into how damage to libraries and the materials they
hold transcend their physical nature to contribute to the loss of
collective memory and cultural identity. Towards this end, in
addition to providing access to the hundreds of images and
descriptions of destruction we have received from the Ukrainian
Library Association, the archives will contribute to cementing
each library’s legacy within their communities; bearing witness
to what was lost and the resilience of Ukrainian librarians as
they continue to diligently serve their communities during
wartime. In this way, it is our hope that the archives can
contribute to the collective memory of the nation of Ukraine.

In addition to presenting, I was afforded the incredible
opportunity to attend numerous impactful sessions and workshops
and meet archivists from around the world. From learning about
archiving initiatives in Palestine, the application of
decolonization principles within archival processes (from
appraisal to exhibition), real world examples of archival
repatriation, and recent developments regarding rules for
describing photographic and audiovisual archives (as created by
the Photographic and Audiovisual Expert Group of the
International Council on Archives), I can honestly say that
I left the Congress with an expanded view of the archival
profession, as well as my future role as archivist.

I would like to express my gratitude to the Ukrainian Library
Association (ULA) for providing the U.S.-based team with the
opportunity to partner with your vital organization and
librarians across Ukraine on this impactful project; to Dr. Ulia
Gossart (SJSU) for encouraging me to attend the ICA Congress (and
for serving as my mentor!); to the ULA and Team Ukraine for
trusting me to represent this project at the Congress, including
Oksana Brui (Deputy Director General at Yaroslav Mudryi National
Library of Ukraine and ULA President); Dr. Rhonda Clark (PennWest
Clarion), Emily Brennen (Rocky Vista University), Claire Williams
(SJSU), Rebecca Short (SJSU), and Sarah Schwartz (SJSU); and to
the SJSU School of Information for their provision of a travel
grant that enabled me to present at and attend the ICA Congress.
For more information about the Ukrainian Libraries During
Wartime archives project, please visit our website:
https://ischoolblogs.sjsu.edu/community-engagement/ukrainian-libraries-in-wartime/
Editor’s Note: The SJSU iSchool highly encourages students to
attend professional conferences but also realizes that it can be
cost prohibitive. Travel grants are
available to eligible students to help lessen the financial
burden and increase conference participation. iSchool student
Kelly Famuliner received one of these travel
grants.


