An initial response to yesterday’s Curriculum and Assessment Review from HEPI Director, Nick Hillman, is available on the HEPI website here.
Today’s blog was kindly authored by Martin Webster, Director of the National Education Opportunities Network (NEON). It is the fifth blog in HEPI’s series responding to the Post-16 Education and Skills white paper. You can find the other blogs here, here, here, and here.
Since the Labour Party formed the Government in 2024, things have undoubtedly changed for higher education and specifically widening access. At the Labour Party Conference in 2024, there was a feeling of optimism with the Minister for Skills, the Rt Hon Baroness Smith, describing widening access as the Government’s number one priority for higher education. We now have a Government that not only believes in the importance of higher education but is putting a new emphasis on both expanding access and improving the outcomes of disadvantaged students.
This ambition for widening access has now been crystallised in the recently published Post 16 Education and Skills white paper, which lays out the key steps that will be taken, the main ones being:
increasing the maintenance loan in line with forecast inflation each academic year.
introducing the Lifelong Learning Entitlement to include modular funding, for both full and part-time study.
reintroducing targeted, means-tested maintenance grants by the end of this Parliament.
reforming the regulation of access and participation plans to allow an approach where the Office for Students (OfS) can be more risk-based with an expectation that providers will continue to strengthen evaluation.
bringing together a Task and Finish group of sector experts, charities, OfS, and UCAS to consider how the system can best widen access.
demonstrating a commitment to widening access to postgraduate level studies.
All of the above demonstrate the importance that the current Government are placing upon widening access and lays out their expectations for change, a change to a more equitable higher education system. Whilst there may be some who critique some of the steps outlined, and may feel they do not go far enough, if the higher education sector can make these changes, we will end up producing better outcomes for disadvantaged learners.
But…
Westminster, we have a problem
It is no secret that the higher education sector is under pressure with providers trying their hardest to ensure they can maximise efficiency from limited resources. Nowhere has this been felt more keenly than within widening access. Over the past couple of years, the National Education Opportunities Network (NEON) started to hear anecdotes from our members about ‘efficiency measures’ that were being taken. These ranged from recruitment freezes on their teams and reductions in dedicated budgets to staffing reorganisations where certain roles, and in some cases whole widening access teams, were being put at risk of redundancy. In the spring of 2025, we therefore surveyed NEON members in order to try to ascertain a more accurate picture of the extent of the problem.
Thirty six of our members responded, and whilst the results may not be statistically significant, they indicate a concerning trend. For the 2025/26 financial year 58% reported a reduced level of financial resources for widening access, and 58% reported a reduced level of staffing resources.
Even within NEON we have seen some of our members unable to renew their membership with us, not because they do not feel their membership is not giving them and their colleagues benefits, but because they have so little available budget that they cannot afford, or are not allowed to invest in, the relatively modest subscription amount.
These findings should concern both the Government and policymakers. Despite being the number one priority for higher education, widening access budgets are being diverted within institutions, sometimes due not to a lack of commitment, but due to necessity. Staffing is being cut and, in one case that we know of, this has included the removal of dedicated evaluation colleagues, an area that the Government are placing even greater emphasis upon. Higher education providers have made a range of commitments in their Access and Participation Plans, and those commitments are at serious risk of not being met.
As one anonymous NEON lead member stated in their response to our survey:
It is increasingly difficult to prioritise widening access activity over such things as recruitment activity when the University’s most pressing need is to balance the books. The resource for widening access will be reduced and we will simply be unable to maintain the level of current activity. This will of course have a disproportionately negative impact on under-represented and hard to reach groups.
Another NEON lead member commented:
The reduction in [institutional] funding means we’re only able to reach a fraction of the disadvantaged learners who would benefit from our outreach offer – we’re currently working with approximately 40% of the schools in our region due to capacity. Of the remaining 60%, over 50% of those have average or higher than average numbers of PP learners.
The Task and Finish group will undoubtedly come up with an excellent set of recommendations, but the reality is that, on the ground, there are even fewer colleagues to deliver the important work that is taking place across England to ensure it is effectively evaluated. Steps need to be taken now to ensure widening access is protected and that providers can support the Government’s ambitions.
So what should the Task and Finish group consider?
ensuring that funding for widening access is ring-fenced and subject to further accountability measures;
establishing an expectation that all providers work with learners across all age groups, from primary school level up to and including mature learners;
considering how the evaluation of access and success initiatives can be strengthened for all providers, including small specialist providers, through a regional approach delivered by collaborative partnerships;
considering how widening access can be established as a strategic driver within schools and colleges; and
developing greater, direct communication between the Department for Education and higher education providers to ensure the Government’s strategic priorities are being met and greater understanding can be developed.
Widening access is at a crossroads. We can stand by and watch progress continue to wane away, or we can put measures in place to continue to build upon the hard of work of colleagues across the higher education sector and improve equitable access and success.
It is the second blog in HEPI’s series responding to the post-16 education and skills white paper. You can find the first blog here.
Despite the post-16 education and skills white paper devoting an entire sub-section to ‘Improving Access and Participation’, the genuine challenges facing students receive minimal attention. The skills agenda within the Government is so strong that the paper frames students, and the student experience, in terms of their potential future contribution to the economy and regional growth. This results in little attempt to understand and address the student experience and the very real challenges that students are currently facing.
A shift to the skills agenda
The Lifelong Learning Entitlement (LLE) takes up several bullet points within this section of the paper. In fact, the decision to categorise the LLE under the heading of access provides an interesting insight into the Government’s broader approach to access and participation. Considering the LLE as a subsection of this initiative reframes the focus of access from entrance to higher education to employment outcomes and progression throughout a person’s life. This shift is an idea repeated throughout the white paper that dovetails with the Government’s skills agenda. It indicates that the Government views higher education as a means to add future value to the economy and a tool through which its Industrial Strategy can be furthered. This approach leaves little room for those subjects and disciplines that fall outside the strategy, let alone for learning for its own sake.
Both modular LLE courses and the newly announced maintenance grants (as announced within the white paper, and previously at the Labour Party Conference) are available only to those studying courses that link to the Government’s wider Industrial Strategy. As may be easily guessed, this results in a list of subjects that largely dovetail with the science and technology sectors – arts and humanities subjects don’t get a look in. Tying maintenance grants to the study of pre-approved science subjects risks disincentivising students from low-income backgrounds from pursuing arts and humanities subjects – potentially entrenching bias and elitism within this sector, as well as furthering the narrative of ‘Mickey Mouse degrees’. As the costs of studying at university continue to rise, some prospective students will struggle to justify studying the subject of their choice if it means losing out on access to maintenance grants. Many of these excluded subjects are already in crisis – as the HEPI / Duolingo report The Language Crisis: Arresting Decline demonstrates, undergraduate enrolments in ‘Language & Area Studies’ have decreased by 20% in five years. Disincentivising students from taking these courses will surely only deepen this crisis further.
These criticisms do not mean the LLE and the reintroduction of maintenance grants are bad policies. The latter is a particularly welcome development that has long been campaigned for by HEPI and the National Union of Students. However, the limited nature of their current form limits the positive impact they could otherwise have. While there is no current clarification on the precise threshold that will be placed on access to maintenance grants, the Government’s lack of movement on the parental income thresholds within the student finance system likely means only a very small number of students will be eligible.
When first announcing this policy at the Labour Party conference, Education Secretary Bridget Phillipson claimed that the reintroduction of maintenance grants would ensure students spent their time at university ‘learning or training, not working every hour God sends’. This perhaps suggests that maintenance grants will be available in addition to, not instead of, the maintenance loan for those eligible students, although we keenly await the detail which will be outlined by the Chancellor in the upcoming Budget. However, this doesn’t solve the deepening financial crisis facing a large number of students in higher education – many of whom simply will not be eligible for the new maintenance grants.
HEPI’s research into the Minimum Income Standard for Students highlights how the current maximum maintenance loan covers just half of the costs faced by freshers. Furthermore, the parental income threshold for eligibility for the maximum loan is currently so out of touch that a student from a household with a single parent earning just above the minimum wage will not be eligible for the maximum loan. The Government has sought to highlight that maintenance loans will increase in line with forecast inflation for every academic year, but this is merely a continuation of the current policy and will not address the financial crisis that many students face. Plus, forecast inflation tends to be lower than actual inflation. Similarly, the promise that care leavers will automatically become eligible to receive the maximum rate of loan is also a reiteration of a policy already in place. Care leavers (and estranged students) are classified as independent and therefore are eligible for the maximum loan. To reiterate, this maximum loan covers only half of the costs these students will face while at university.
Postgraduate access
The inclusion of postgraduate access in the white paper is a welcome addition – and an unsurprising one when considering how this white paper has framed access in terms of career progression and skills. However, once more, the inclusion of postgraduate students within access goals falls short due to a failure to address the root causes of the widening crises for home postgraduate students in England. Postgraduate taught tuition fees now exceed the maximum postgraduate loan – meaning that a student has used up their entire loan before even considering their cost of living.
Instead of engaging with this, the paper encourages providers to include postgraduate study in their Access and Participation Plans (APP). This is, in itself, a positive development; however, without addressing the financial barriers faced by many prospective postgraduate students, this inclusion will have very limited impact.
The access and participation section of the post-16 education and skills white paper provides an insight into how this Government conceives of these issues. However, the focus on students as future employees paints a worrying picture of a Government that is more concerned with next steps than with higher education itself.
Brazil exited the age of slavery 135 years ago. It remains a multi-racial society today. But for much of the twentieth century, Brazil suffered an enormous bout of amnesia. From being one of the last societies on earth to give up slavery, it immediately began touting itself as a place where colour did not matter, that it was a post-racial society.
But then about 30 years ago, things changed. Race — or more accurately race and inequality — became a much more prominent subject of debate, and various measures were brought in to lessen racial inequality. In higher education, however, Brazil did not however take the path of “affirmative action” as the United States did. Instead: it went the route India did with respect to caste: hard, fixed numerical quotas.
Today we’re going to look at how that this policy has worked out, and joining me to do so is Luiz Augusto Campos: He’s a professor of sociology and Political science at the State University of Rio de Janeiro, and he’s co-editor of a recent book on quotas in Brazilian higher education called O impacto das cotas: Duas decadasde acao affirmativano Ensino superior brasileiro. We had a great discussions about how Brazilian admissions quotas came to be and how they have change higher education. Of particular interest to me is that these quotas were imposed in some of the country’s most elite institutions — and how the arrival of quotas has managed to make policies of free tuition at elite institutions much less regressive.
The World of Higher Education Podcast Episode 4.7 | Access and Aftermath: What Racial Quotas Changed in Brazil’s Universities with Luiz Augusto Campos
Transcript
Alex Usher (AU): Luiz, before we start talking about quotas in higher education, let’s paint a picture of race in Brazil. Like the United States, Brazil was a colonial slave state—one where emancipation didn’t happen until 1888. But for a long time, there was a kind of myth that Brazil had become a post-racial society, one where people didn’t see race. So, what are the politics of race like in Brazil, and what’s changed over, say, the last 50 years?
Luiz Augusto Campos (LAC): That’s true, and I can say that almost everything has changed in recent years. At the beginning, Brazil was portrayed as a racial democracy—the idea that people in Brazil don’t see race and that there’s no racism. It’s complicated to understand how a country that was completely slave-based in the past could create this myth.
The myth was actually quite successful in the sense that most Brazilians used to believe it. It’s connected to how people viewed our history of slavery. In the past, people used to say that Brazilian slavery was a kind of soft slavery compared to other countries. Historians now show that’s not true, but that was how people saw it.
It was also tied to the myth of miscegenation—the idea that every Brazilian was of mixed race. And if everyone was mixed race, there was supposedly no place for racism, because you couldn’t practice racism against someone who was mixed, as everyone was.
But after 50 or 60 years, this national myth started to change—first because of the rise of the Black movement, which began to call out racism in Brazil, and later because of data on racial inequality. We’ve historically had very good data on race in Brazil—it’s a kind of legacy from the 18th century, through censuses and demographic records.
Those numbers began to show that, despite this idea of racial democracy, racial inequality remained deeply entrenched in Brazil, right up until the end of the 1990s. I think those two things—the activism of the Black movement and the hard data—really contributed to changing people’s belief in the myth of racial democracy.
AU: Just to be clear, when you talk about data on race, how is race classified? I don’t think it’s just white and Black, right? How does that work?
LAC: It’s changed over time, but we generally work with five racial categories. Even today, the Brazilian census is quite good. When a census worker comes to your house, they’ll ask you to identify your race using one of five options: Black, Brown, White, Yellow—which refers to Brazilians of Asian descent—and Indigenous.
That last category isn’t meant for people with distant Indigenous ancestry, but rather for those who actually live within Indigenous communities.
AU: Within higher education, how did race historically affect access? How big were the participation gaps between racial groups prior to the introduction of quotas?
LAC: The differences were huge. At the beginning of the 1990s, about 70 percent of students in public higher education were white. And it’s important to note that Brazil has both a public and a private higher education system.
AU: Right—and even though the private system is larger, the public system is the more selective and prestigious one. That’s where people want to go, correct?
LAC: Exactly. The private system is much bigger, but the public system is more selective, higher quality, and more prestigious.
At the start of the 1990s, around 70 percent of enrollments in the public system were white students. That was a real injustice, because the public system is completely tuition-free. So essentially, the government was collecting taxes from the majority of the population—who are largely Brown, Black, and poor—and using that money to fund the education of white students, who mostly came from middle- and upper-class backgrounds.
AU: Let me just ask—if about 70 percent of students in public higher education were white, how did that compare to the population as a whole?
LAC: In Brazil, the population has usually been about half white and half non-white. At the beginning of the 1990s, around 57 percent of people self-identified as white, but they made up about 70 percent of students in public universities.
It’s interesting, though, because racial classification in Brazil has also shifted over time—the proportions of people identifying as white, Black, or Brown have changed. But to answer your question directly, today less than 50 percent of students in public higher education are white. Black and Brown students now make up the majority in the public system.
AU: Let’s think about how we got there. In the 1980s and 1990s, as you said, racial politics started to change across Brazil. People realized this wasn’t really a racial democracy. How did quotas become the tool for achieving racial justice, rather than affirmative action as practiced in the United States at the time?
LAC: It’s a really complex process—and not one that was carefully planned.
First, we had the earliest proposals coming from the Black movement, mostly from an important Black leader in Brazil who was a congressman at the time. He introduced several bills for affirmative action, most of them based on quotas, though they included other ideas as well—such as direct financial support for Black Brazilians and other measures. But the core idea of quotas was already there in the early 1980s.
After that, we saw the rise of a movement creating preparatory courses for university entrance exams. In Brazil, admission to public universities is based on a standardized test, and these prep courses were designed by Black activists to help Black, Brown, and low-income students prepare for it.
The first actual quota policy began at my own university—the State University of Rio de Janeiro—at the beginning of the 2000s. Interestingly, the counselor who approved the quota system was from a right-wing party. He wasn’t necessarily a racial justice advocate; he was just a politician looking for proposals to champion, and this was one he decided to push through.
From that point onward, other universities began to adopt and replicate the model. Today, Brazil likely has the largest racial quota system in the world.
AU: So, how did we go from a situation in the 1980s and 1990s, where a few institutions were experimenting with quotas, to a point where the federal government actually mandated them for all federal universities in 2012? What led up to that decision, and how does the current quota system work?
LAC: It’s a complex story. In the beginning, there was fierce opposition to quotas in Brazil. Even intellectuals and public figures who had long supported anti-racist efforts criticized the quota system when it was first proposed.
At the same time, there were also important groups supporting these policies, but the federal government initially stayed on the sidelines. During Lula’s first two terms, he was personally supportive of such initiatives, but because the topic was so controversial, his government took a cautious approach. They said, “We need to wait—this is a divisive issue,” and chose not to sponsor a national quota bill for higher education at that stage.
However, during Lula’s broader reform of the higher education system, the government did introduce incentives for universities to adopt diversity policies. And for many institutions, quotas were simply the most practical approach—bureaucratically, they’re straightforward to implement. You just reserve a certain percentage of seats, and that’s it.
The Black movement also played a critical role. Activists developed strategies and frameworks to encourage universities to adopt quotas, and because Brazilian universities enjoy a high degree of autonomy, many were able to introduce these policies on their own.
AU: My understanding is that the quota system is actually a kind of two-level structure. The main rule is that 50 percent of students must come from public secondary schools, and then within that, there are race-based quotas that vary depending on the region—since, I assume, the racial makeup of Brazil isn’t homogenous across the country.
LAC: Exactly. First, it’s important to understand that Brazil’s quota system is primarily socioeconomic. The first criterion is that 50 percent of students admitted to public universities must come from public schools. On average, public schools in Brazil are of lower quality than private schools. You don’t pay to attend them, but the quality is generally weaker.
Within that 50 percent, there’s another socioeconomic division: 25 percent of seats are reserved for students from lower-income backgrounds, and 25 percent for students from higher-income backgrounds who still attended public schools.
Then, inside those categories, there are racial quotas. And as you said, the racial proportions vary by state, depending on the local population.
AU: It’s now been a couple of decades since quotas were first introduced, and 13 years since the federal law came into effect. You mentioned earlier that there’s been a significant narrowing of racial access gaps. How substantial has that change been?
LAC: In terms of access, it’s very significant. Today, we can say that Brazilian universities are truly Black and Brown universities. If you visit a campus in Brazil now, you’ll see far more Black and Brown students than in the past.
That said, there are still limits and challenges. While the public higher education system has changed dramatically in both racial and socioeconomic terms, it remains quite small compared to the private sector. In the 1990s, the public system made up almost half of Brazil’s entire higher education system. Today, it accounts for only about 20 percent.
AU: What about graduation rates? It’s one thing to get into university, but as you mentioned, students from public secondary schools might not have had the same preparation. Has the system been able to adjust to ensure that racial minorities are graduating at the same rate as white students?
LAC: In terms of graduation, the rates are quite similar. Black and Brown students now graduate at roughly the same rate as white students. But there are still differences because, even with quotas, access isn’t evenly distributed across all majors.
AU: So, there’s still stratification within the system.
LAC: Yes, exactly. Because racial quotas exist within the broader socioeconomic quota, the share of seats reserved for Black and Brown students ends up being about half of their proportion in the overall Brazilian population.
As a result, in some programs—especially in the less selective ones—you might see 50 or 60 percent of students identifying as Black or Brown. But in the most selective fields, like law or engineering, that number drops to around 20 percent.
It’s also important to note that not all quota seats are filled. Universities sometimes introduce additional requirements or special exams that can limit how these racial quotas are implemented in practice.
AU: Based on your overview of quotas and their results, is there anything you think could be improved in the system?
LAC: Yes, there’s quite a lot that could be improved. We have a new law from 2023 that made some small but important updates to the 2012 legislation. It’s a good law—I think it corrected several issues—but there are still many areas that need attention.
First, data access. In Brazil, getting access to racial data is actually harder today than it used to be. This is partly due to new data protection laws that were meant to regulate big tech companies, but in practice they’ve ended up restricting academic research instead. So, access to race-related data for research is now much worse than before.
Second, the admissions system itself is extremely complicated. Students take a national standardized exam—the ENEM—to apply for higher education. Through this unified system, they can choose from roughly 6,000 different programs across the country.
Within that, there are multiple overlapping quota categories. Besides the main racial and socioeconomic quotas, there are additional ones—like for students with disabilities—which exist inside the broader categories. Altogether, there are around 16 groups, and combining all of them within a single national admissions platform makes it very difficult to fill every quota properly.
So, while the policy framework is strong, the system still has a lot of complexity and operational challenges that need to be addressed.
AU: And what do you think the future holds for quotas in Brazilian higher education? Is there a limit to how far quotas can help narrow the access gap? And can you imagine a future in which quotas wouldn’t be needed anymore?
LAC: I can imagine that future—and I hope for it. I think we’re all working toward a world where quotas are no longer necessary. But for now, they’re still very much needed.
At the moment, the quota system itself isn’t under serious attack. What is under pressure, though, is public higher education—and really the higher education system as a whole. There’s a growing discourse, mostly from the far right, claiming that higher education isn’t necessary, that people should simply “work hard” instead.
Public universities, in particular, have become targets. Critics accuse them of being useless or of being dominated by the far left, which simply isn’t true.
To answer your question directly, I’d say the quota system in Brazil is quite stable right now. But the institutions that sustain it—especially public universities—are facing challenges. Looking ahead, I think the next step is to expand affirmative action beyond higher education, into other areas like the labor market and public institutions, where access for Black and Brown Brazilians remains limited.
AU: Luiz, thank you so much for being with us today.
LAC: Thank you. It’s my pleasure.
AU: And it just remains for me to thank our excellent producers, Sam Pufek and Tiffany MacLennan, and you, our readers and listeners, for joining us. If you have any questions about today’s episode or suggestions for future ones, don’t hesitate to contact us at [email protected]. Next week is a break week—but after that, we’ll be back with another fascinating conversation. Bye for now.
*This podcast transcript was generated using an AI transcription service with limited editing. Please forgive any errors made through this service.Please note, the views and opinions expressed in each episode are those of the individual contributors, and do not necessarily reflect those of the podcast host and team, or our sponsors.
The sector level dashboards that cover student characteristics have a provider-level parallel – the access and participation dashboards do not have a regulatory role but are provided as evidence to support institutions develop access and participation plans.
Though much A&P activity is pre-determined – the current system pretty much insists that universities work with schools locally and address stuff highlighted in the national Equality of Outcomes Risk Register (EORR). It’s a cheeky John Blake way of embedding a national agenda into what are meant to be provider level plans (that, technically, unlock the ability to charge fees up to the higher level) but it could also be argued that provider specific work (particularly on participation measures rather than access) has been underexamined.
The A&P dashboards are a way to focus attention on what may end up being institutionally bound problems – the kinds of things that providers can fix, and quickly, rather than the socio-economic learning revolution end of things that requires a radicalised cadre of hardened activists to lead and inspire the proletariat, or something.
We certainly don’t get any detailed mappings between numeric targets declared in individual plans and the data – although my colleague Jim did have a go at that a while ago. Instead this is just the raw information for you to examine, hopefully in an easier to use and speedier fashion than the official version (which requires a user guide, no less)
Fun with indicators
There are four dashboards here, covering most of what OfS presents in the mega-board. Most of what I’ve done examines four year aggregations rather than individual years (though there is a timeseries at provider level), I’ve just opted for the 95 per cent confidence interval to show the significance of indicator values, and there’s a few other minor pieces that I’ve not bothered with or set a sensible default on.
I know that nobody reads this for data dashboard design tips, but for me a series of simpler dashboards are far more useful to the average reader than a single behemoth that can do anything – and the way HESA presents (in the main) very simple tables or plain charts to illustrate variations across the sector represents to me a gold standard for provider level data. OfS is a provider of official statistics, and as such is well aware that section V3.1 of the code of practice requires that:
Statistics, data and explanatory material should be relevant and presented in a clear, unambiguous way that supports and promotes use by all types of users
And I don’t think we are quite there yet with what we have, while the simple release of a series of flat tables might get us closer
If you like it you should have put a confidence interval on it
To start with, here is a tool for constructing ranked displays of providers against a single metric – here defined as a life cycle stage (access, continuation, completion, attainment, progression) expressed as a percentage of successful achievements for a given subgroup.
Choose your split indicator type on the top right, and the actual indicator on the top right – select the life cycle stage on the box in the middle, and set mode and level (note certain splits and stages may only be available for certain modes and levels). You can highlight a provider of interest using the box on the bottom right, and also find an overall sector average by searching on “*”. The colours show provider group, and the arrows are upper and lower confidence bounds at the standard 95 per cent level.
You’ll note that some of the indicators show intersections – with versions of multiple indicators shown together. This allows you to look at, say, white students from a more deprived background. The denominator in the tool tip is the number students in that population, not the number of students where data is available.
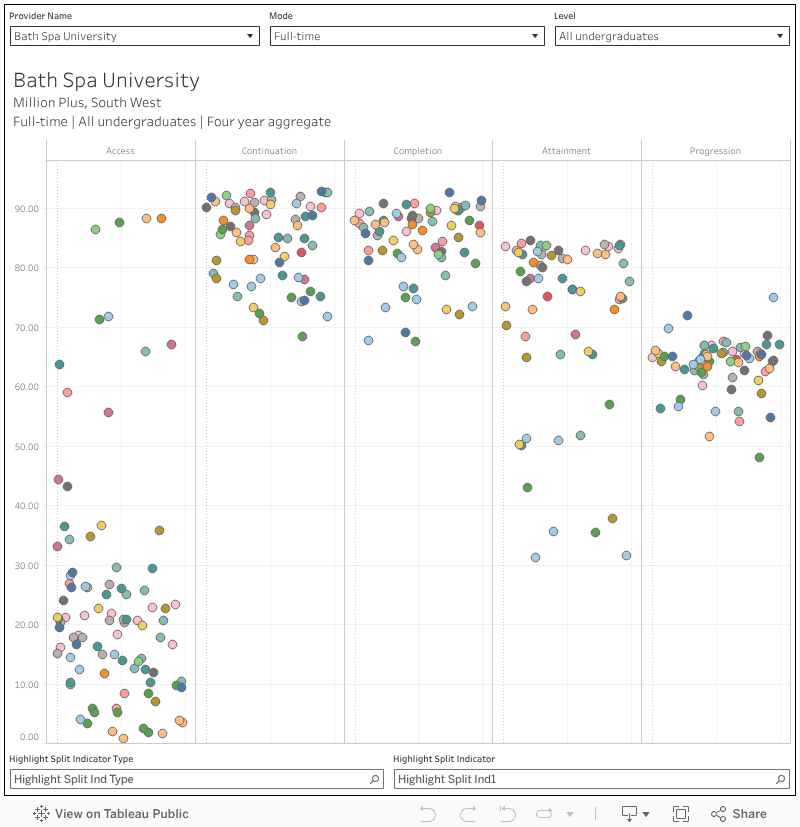
I’ve also done a version allowing you to look at all single indicators at a provider level – which might help you to spot particular outliers that may need further analysis. Here, each mark is a split indicator (just the useful ones, I’ve omitted stuff like “POLAR quintiles 1,2,4, and 5” which is really only worth bothering with for gap analysis), you can select provider, mode, and level at the top and highlight a split group (eg “Age (broad)”) or split (eg “Mature aged 21 and over”).
Note here that access refers to the proportion of all entrants from a given sub-group, so even though I’ve shown it on the same axis for the sake of space it shows a slightly different thing – the other lifecycle stages relate to a success (be that in continuation, progression or whatever) based on how OfS defines “success”.
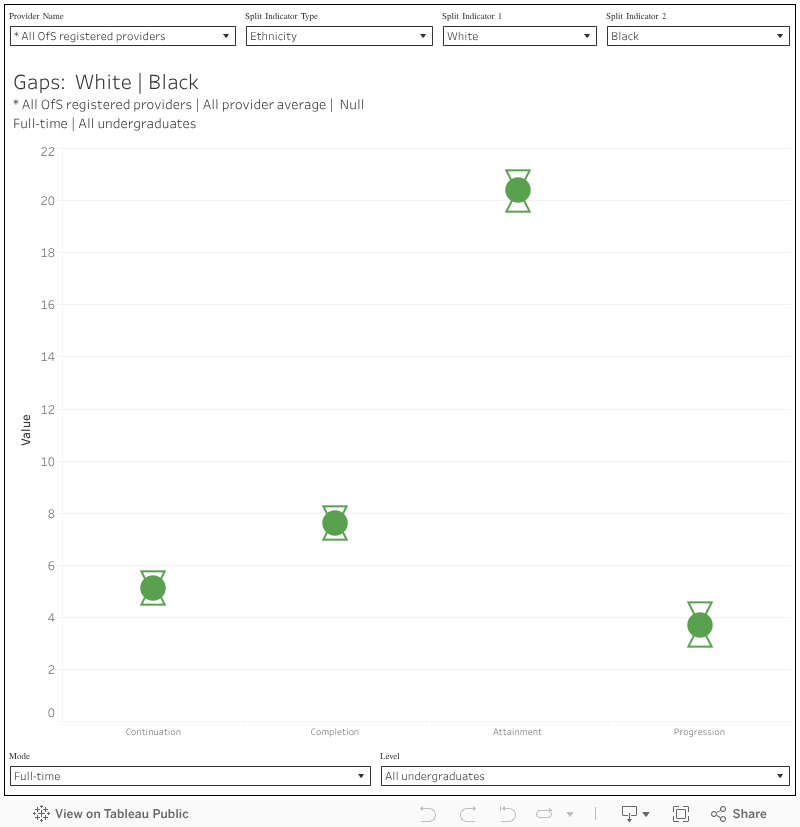
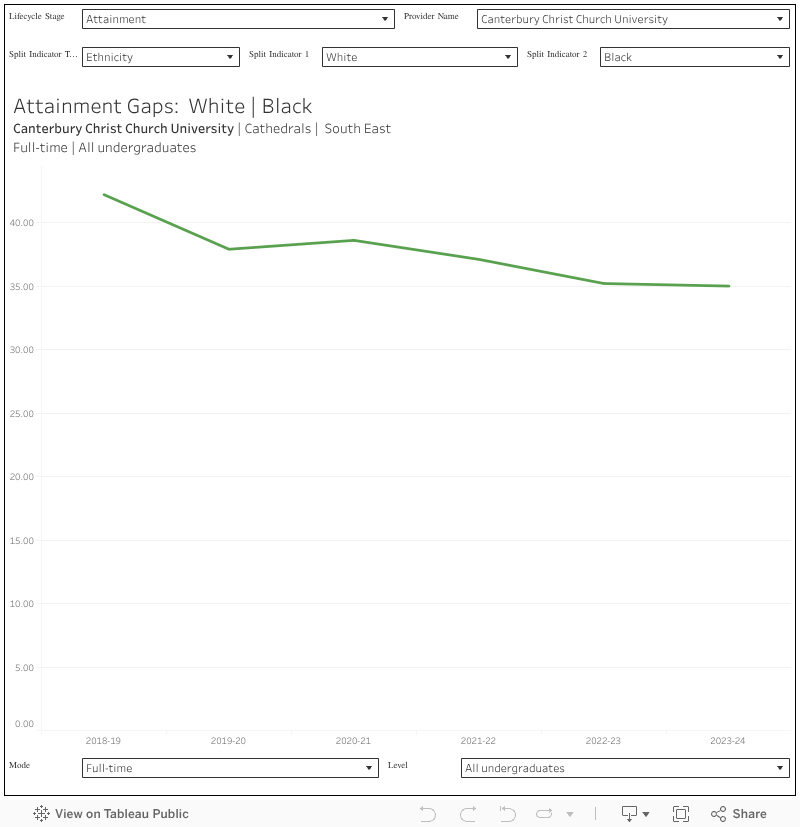
As you’ve probably spotted from the first section, to really get things out of this data you need to compare splits with other relevant splits. We are talking, then, about gaps – on any of the lifecycle stages – between two groups of students. The classic example is the attainment gap between white and Black students, but you can have all kinds of gaps.
This first one is across a single provider, and for the four lifecycle stages (this time, we don’t get access) you can select your indicator type and two indicators to get the gap between them (mode, and level, are at the bottom of the screen). When you set your two split, the largest or most common group tends to be on indicator 1 – that’s just the way the data is designed.
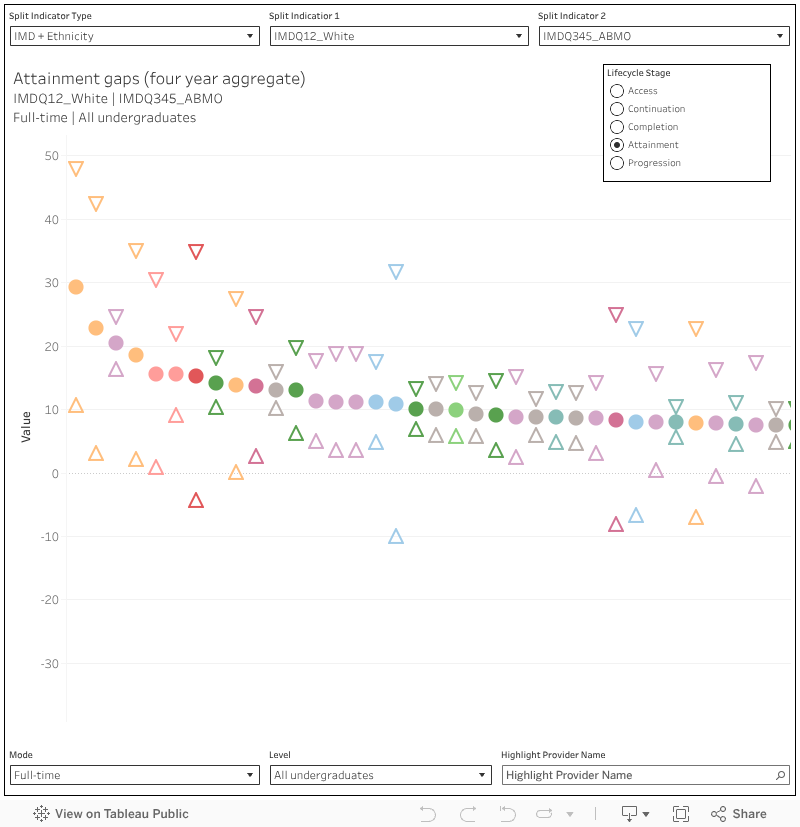
As a quick context you can look for “*” again on the provider name filter to get sector averages, but I’ve also built a sector ranking to help you put your performance in context with similar providers.
This is like a cross between the single ranking and the provider-level gaps analysis – you just need to set the two splits in the same way.
The four year aggregates are handy for most applications, but as you being to drill in you are going to start wondering about individual years – are things getting gradually worse or gradually better? Here I’ve plotted all the individual year data we get – which is, of course, different for each lifecycle stage (because of when data becomes available). This is at a provider level (filter on the top right) and I’ve included confidence intervals at 95 per cent in a lighter colour.
In an age defined by digital transformation, access to reliable, high-speed internet is not a luxury; it is the bedrock of opportunity. It impacts the school classroom, the doctor’s office, the town square and the job market.
As we stand on the cusp of a workforce revolution driven by the “arrival technology” of artificial intelligence, high-speed internet access has become the critical determinant of our nation’s economic future. Yet, for millions of Americans, this essential connection remains out of reach.
This digital divide is a persistent crisis that deepens societal inequities, and we must rally around one of the most effective tools we have to combat it: the Universal Service Fund. The USF is a long-standing national commitment built on a foundation of bipartisan support and born from the principle that every American, regardless of their location or income, deserves access to communications services.
Without this essential program, over 54 million students, 16,000 healthcare providers and 7.5 million high-need subscribers would lose internet service that connects classrooms, rural communities (including their hospitals) and libraries to the internet.
The discussion about the future of USF has reached a critical juncture: Which communities will have access to USF, how it will be funded and whether equitable access to connectivity will continue to be a priority will soon be decided.
Earlier this year, the Supreme Court found the USF’s infrastructure to be constitutional — and a backbone for access and opportunity in this country. Congress recently took a significant next step by relaunching a bicameral, bipartisan working group devoted to overhauling the fund. Now they are actively seeking input from stakeholders on how to best modernize this vital program for the future, and they need our input.
I’m urging everyone who cares about digital equity to make their voices heard. The window for our input in support of this vital connectivity infrastructure is open through September 15.
While Universal Service may appear as only a small fee on our monthly phone bills, its impact is monumental. The fund powers critical programs that form a lifeline for our nation’s most vital institutions and vulnerable populations. The USF helps thousands of schools and libraries obtain affordable internet — including the school I founded in downtown Brooklyn. For students in rural towns, the E-Rate program, funded by the USF, allows access to the same online educational resources as those available to students in major cities. In schools all over the country, the USF helps foster digital literacy, supports coding clubs and enables students to complete homework online.
By wiring our classrooms and libraries, we are investing in the next generation of innovators.
The coming waves of technological change — including the widespread adoption of AI — threaten to make the digital divide an unbridgeable economic chasm. Those on the wrong side of this divide experienced profound disadvantages during the pandemic. To get connected, students at my school ended up doing homework in fast-food parking lots. Entire communities lost vital connections to knowledge and opportunity when libraries closed.
But that was just a preview of the digital struggle. This time, we have to fight to protect the future of this investment in our nation’s vital infrastructure to ensure that the rising wave of AI jobs, opportunities and tools is accessible to all.
AI is rapidly becoming a fundamental tool for the American workforce and in the classroom. AI tools require robust bandwidth to process data, connect to cloud platforms and function effectively.
The student of tomorrow will rely on AI as a personalized tutor that enhances teacher-led classroom instruction, explains complex concepts and supports their homework. AI will also power the future of work for farmers, mechanics and engineers.
Without access to AI, entire communities and segments of the workforce will be locked out. We will create a new class of “AI have-nots,” unable to leverage the technology designed to propel our economy forward.
The ability to participate in this new economy, to upskill and reskill for the jobs of tomorrow, is entirely dependent on the one thing the USF is designed to provide: reliable connectivity.
The USF is also critical for rural health care by supporting providers’ internet access and making telehealth available in many communities. It makes internet service affordable for low-income households through its Lifeline program and the Connect America Fund, which promotes the construction of broadband infrastructure in rural areas.
The USF is more than a funding mechanism; it is a statement of our values and a strategic economic necessity. It reflects our collective agreement that a child’s future shouldn’t be limited by their school’s internet connection, that a patient’s health outcome shouldn’t depend on their zip code and that every American worker deserves the ability to harness new technology for their career.
With Congress actively debating the future of the fund, now is the time to rally. We must engage in this process, call on our policymakers to champion a modernized and sustainably funded USF and recognize it not as a cost, but as an essential investment in a prosperous, competitive and flourishing America.
Erin Mote is the CEO and founder of InnovateEDU, a nonprofit that aims to catalyze education transformation by bridging gaps in data, policy, practice and research.
The Hechinger Report provides in-depth, fact-based, unbiased reporting on education that is free to all readers. But that doesn’t mean it’s free to produce. Our work keeps educators and the public informed about pressing issues at schools and on campuses throughout the country. We tell the whole story, even when the details are inconvenient. Help us keep doing that.
Patients benefit from a diverse healthcare workforce. Doctors, particularly those from disadvantaged and minoritised backgrounds, play a crucial role in advocating for what is best for their patients.
The NHS recognises this, linking workforce diversity with increased patient satisfaction, better care outcomes, reduced staff turnover, and greater productivity.
A promising start
Efforts to widen participation in higher education began at the turn of the century following the Dearing report. Over time, access to medical schools gained attention due to concerns about its status as one of the most socially exclusive professions. Medical schools responded in 2014 with the launch of the Selecting for Excellence report and the establishment of the Medical Schools Council (MSC) Selection Alliance, representing admissions teams from every UK medical school and responsible for fair admissions to medical courses.
With medical school expansion under government review, institutions face increasing pressure to demonstrate meaningful progress in widening participation to secure additional places. Although medicine programmes still lag in representing some demographic groups, they now align more closely with wider higher education efforts.
However, widening participation policy often follows a deficit model, viewing disadvantaged young people as needing to be “fixed” or “topped up” before joining the profession. Phrases like “raising aspirations” suggest these students lack ambition or motivation. This model shifts responsibility onto individuals, asking them to adapt to a system shaped mainly by the experiences of white, male, middle-class groups.
Beyond access
To create real change, organisations must move beyond this model and show that students from diverse backgrounds are not only welcomed but valued for their unique perspectives and strengths. This requires a systems-based approach that rethinks every part of medical education, starting with admissions. In its recent report, Fostering Potential, the MSC reviewed a decade of widening participation in medicine. Medical schools across the UK have increased outreach, introduced gateway year courses, and implemented contextual criteria into admissions.
Contextual markers recognise structural inequalities affecting educational attainment. Students from low socioeconomic backgrounds often attend under-resourced schools and face personal challenges hindering academic performance. Yet evidence shows that, when given the chance, these students often outperform more advantaged peers at university. Contextual admissions reframe achievements in light of these challenges, offering a fairer assessment of potential.
Despite progress, access remains unequal. Although acceptance rates for students from the most deprived areas have increased, their chances remain 37 per cent lower than those from the least deprived areas. Research indicates that a two-grade A-level reduction is needed to level the playing field—an approach several schools now adopt. Other policies include fast-tracking interviews, test score uplifts, and alternative scoring for widening participation candidates.
Not just special cases
These processes, however, are often opaque and hard to navigate. Many applicants struggle to determine eligibility. With no single definition of disadvantage, medical schools use varied proxy indicators, often poorly explained online. This confusion disproportionately affects the students these policies aim to support; those without university-educated parents, lacking insider knowledge, and attending under-resourced schools.
A commitment to transparency is vital but must go beyond rhetoric. Transparency means all medical schools clearly outline contextual admissions criteria in one accessible place, provide step-by-step guides to applicants and advisors, and offer examples of how contextual data influences decisions. Medical schools could collaborate to agree on standardised metrics for identifying widening participation candidates. This would simplify eligibility understanding, reduce confusion, and promote fairness.
Tools like MSC’s entry requirements platform are a good start but must be expanded, standardised, and actively promoted to the communities that need them most. Genuine transparency empowers applicants to make informed choices, selecting schools best suited to their circumstances and maximising success chances. This also eases the burden on schools, advisors, and outreach staff who struggle to interpret inconsistent criteria.
Ultimately, moving away from the deficit model toward an open, systems-based approach is about more than fairness. It is essential for building a medical workforce that reflects society’s diversity, improving patient care, strengthening the profession, and upholding the NHS’s commitment to equity and excellence.
This audio is auto-generated. Please let us know if you have feedback.
Dive Brief:
The U.S. Department of Education quietly rescinded Obama-era guidance that called on states and districts to ensure English learners “can participate meaningfully and equally” in school and “have equal access to a high-quality education and the opportunity to achieve their full academic potential.”
The 40-page Dear Colleague letter, issued in 2015, commended districts for “creating programs that recognize the heritage languages of EL students as valuable assets to preserve.”
The department said in a statement to K-12 Dive that it rescinded the guidance because “it is not aligned with [Trump] Administration priorities.” The rescission of the guidance is part of a broader effort from the Trump administration to center the English language above all others.
Dive Insight:
The comprehensive and long-standing guidance included information on identifying and assessing potential EL students, evaluating EL students for special education services, ensuring their parents have meaningful access to information, and avoiding “unnecessary segregation” of EL students, among other tasks districts typically undertake when serving English learners.
Dear Colleague letters are not legally binding, but are often used to communicate to education stakeholders administration’s priorities and policy interpretations.
The current administration’s rescission of the guidance follows the department’s closure of the Office of English Language Acquisition, which was shut down entirely as part of the agency’s downsizing efforts that began in March.
Before its closure, that office helped ensure that English learners and immigrant students gained English proficiency and academic success, schools preserved students’ heritage languages and cultures, and that all students had the chance to develop biliteracy or multiliteracy skills.
The department’s erasure of the office and guidance that would have helped districts and states serve English learners comes amid other efforts from the Trump administration to prioritize the English language.
In March, President Donald Trump issued an executive order declaring English the national language, despite the country still having no legally established national language.
The order undid a Clinton-era orderthat required federal agencies to improve access to their programs for those with limited English proficiency.
The recent federal push to prioritize English over other languages and to reduce access for English learners comes at a time when the percentage of English learners in public schools is increasing.
There were approximately 5.3 million English learner students in fall 2021, compared with 4.6 million such students a decade prior, according to data from the Education Department last updated in 2024.
In 2021 AdvanceHE published our literature review which set out to demonstrate significant impact in access, retention, attainment and progression from 2016–21.
Our aim was to help institutional decision making and improve student success outcomes. This literature has helped to develop intervention strategies in Access and Participation Plans. But the HE world has changed since review and publication.
Recent sector data for England showed that 43 per cent of higher education providers sampled by the Office for Students (OfS) were forecasting a deficit for 2024–25 and concluded that:
Many institutions have ongoing cost reduction programmes to help underpin their financial sustainability. Some are reducing the number of courses they offer, while others are selling assets that are no longer needed.
All the while, institutions are, quite rightly, under pressure to maintain and enhance student success.
The findings of our 2021 review represent a time, not so long ago, when interventions could be designed and tested without the theorising and evaluation now prescribed by OfS. We presented a suite of options to encourage innovation and experimentation. Decision making now feels somewhat different. Many institutions will be asking “what works now, as we find ourselves in a period of financial challenge and uncertainty?”
Mattering still matters
The overarching theme of “mattering” (France and Finney 2009, among others) was apparent in the interventions we analysed in the 2021 review. At its simplest, this is interventions or approaches which demonstrate to students that their university cares about them; that they matter. This can be manifest in the interactions they have with staff, with systems and processes, with each other; with the approaches to teaching that are adopted; with the messages (implicit and explicit) that the institution communicates.
Arguably, a core aspect of mattering is “free” in terms of hard cash – us showing students that we care about them, their experience, and their progress, for staff to have a friendly approach, a regular check in, and meaningful and genuine dialogue with students. Such interactions may well carry an emotional cost however, and how staff are feeling – whether they feel that they matter to the institution – could impact on morale and potentially make this more difficult. We should also be mindful of the gendered labour that can be evident when teaching academics are encouraged to pick up more “pastoral” care of students; in research-intensive institutions, this may be more apparent when a greater proportion of female staff are employed on teaching focused contracts.
In our original review we found that there were clear relationships between each student outcome area – access, retention, attainment and progression – and some interventions had impact on more than one outcome. Here are five of our examples, within the overarching theme of mattering, which remind the sector of this impact evidence whilst illustrating developments in thinking and implementation.
Five impactful practices
Interventions which provide financial aid or assistance to students pre and post entry were evidenced as impactful in the 2016-2021 literature. We remember the necessity of providing financial aid for students during Covid, with the government even providing additional funding for students in need. In the current financial climate, the provision of extra funding may feel like a dream for many institutions. Cost reduction pressures may mean that reducing sizable student support budgets are an easy short-term win to balance the books.
In fact late last year, Jim Dickinson predicted just this as the first wave APPs referenced a likely decline in financial support. As evaluative data has shown, hardship funding is used by students to fund the cost of living. When money is tight, an alternative approach is to apply targeted aid where there is evidence of known disadvantage. Historically the sector has not been great at targeting, but it has become a necessity. Preventing student withdrawal has never been more important.
We also noted that early interventions delivered pre-entry and during transition and induction were particularly effective. The sector has positioned early and foundational experiences of students as crucial for many years. When discussions about cost effectiveness look to models of student support, targeting investment in the early years of study, rather than universally applied, could have the highest impact. Continuation metrics (year one to year two retention) again drive this thinking, with discrete interventions being the simplest to evaluate but perhaps the most costly to resource. Billy Wong’s new evidence exploring an online transition module and associated continuation impact is a pertinent example of upfront design costs (creation), low delivery costs (online), and good impact (continuation).
Another potentially low cost intervention is the design of early “low stakes” assessment opportunities that give students the chance to have early successes and early helpful feedback which, if well designed, can support students feeling that they matter. These types of assessments can support student resilience and increase the likelihood of them continuing their studies, as well as providing the institution with timely learner analytics regarding who may be in need of extra support (a key flag for potential at-risk students being non-completion of assessments). This itself is a cost saving measure as it enables the prioritisation of intervention and resource where the need is likely to be greatest.
Pedagogically driven interventions were shown in our review to have an impact across student outcome areas. This included the purposeful design of the student’s curriculum to impact on student learning, attainment, and future progression. Many institutions are embarking on large scale curriculum change with an efficiency (and student experience/outcomes) lens. Thinking long term enough to avoid future change, yet attending to short term needs is a constant battle, as is retaining conversations of values and pedagogy.
How we teach is perhaps one of the most powerful and “cost-free” mechanisms available, given many students may prioritise what time they can spend on campus towards attending taught sessions. An extremely common concern expressed by new (and not so new) lecturers and GTAs when encouraged to interact with students in their teaching is “But what if I get asked a question that I don’t know the answer to?” Without development and support, this fear (along with an understandable assumption that their role is to “transmit” knowledge) often results in a retreat to didactic, content heavy approaches, a safe space for the expert in the room.
But participative sessions that embed inclusive teaching, relational and compassionate pedagogies, that create a sense of community in the classroom where contributions are valued and encouraged, where students get to know each other and us – all such approaches can show students that they matter and support their experience and their success.
We also found that interventions which provided personal support and guidance for students impacted positively on student outcomes. One to one support can be impactful but costly. Adaptations in delivery or approach, for example, small group rather than individual sessions and models of peer support are worth exploring in a resource sensitive environment. Embedding personal and academic support within course delivery and operating an effective referral system for students when needed, is another way to get the most out of existing resources.
Finally, the effective use of learner analytics was a common theme in our review of impact. Certainly, the proactive use of data to support the identification of student need/risk makes good moral and financial sense. However, large scale investment might be necessary to realise longer term financial gains. This might be an extension of existing infrastructure or as Peck, McCarthy and Shaw recently suggested, HE institutions might turn to AI to play a major role in recognising students who are vulnerable or in distress.
Confronting the hidden costs
These financial dilemmas may feel uncomfortable; someone ultimately gains less (loses out?) in a targeted approach to enhancing student success. Equality of opportunity and outcome gaps alongside financial transparency should be at the forefront of difficult decisions (use equality legislation on positive action to underpin targeting decisions as needed). Evaluation, and learning from the findings, become even more important in the context of scarce resources. While quick decisions to realise financial savings may seem attractive, a critical eye on the what works evidence base is essential to have long term impact.
Beyond our AHE review, TASO has a useful evidence toolkit which notes cost alongside assumed impact and the strength of the evidence. As an example, the provision of information, advice and guidance and work experience are cited as low cost (one star), with high-ish impact (two stars). This evidence base only references specific evidence types (namely causal/type three evidence). The series of evidence-based frameworks (such as Student Success, Employability, Inclusive Practice) from AdvanceHE are alternative reference points.
The caveat to all of the above is that new approaches carry a staff development cost. In fact, all of the “low cost” interventions and approaches cited need investment in the development and support of academic staff. We are often supported by brilliant teams of learning designers and educational developers, but they cannot do all this heavy lifting on their own given the scale of the task ahead. As significant challenges like AI ask us to fundamentally rethink our purpose as educators in higher education, perhaps staff development is what we should be investing in now more than ever?
This blog was kindly authored by Dr Anna Anthony, director of HEAT. HEAT provides a collaborative data service enabling higher education providers, Uni Connect partnerships and Third Sector Organisations to show the impact of their equality of opportunity delivery through a shared, standardised data system. By aggregating data from across the membership, HEAT can publish national-level impact reports for the sector.
It has never been more important for providers across the sector to show that access and participation activities have an impact. With resources stretched, we need to know the work we are doing is making a measurable difference. New research from HEAT reveals a series of powerful findings:
Intensive outreach boosts HE entry by up to 29% – Students who received at least 11 hours of intensive outreach were up to 29% more likely to enter higher education (HE) than matched peers receiving minimal support.
Disadvantaged students see the biggest gains – Free school meal (FSM) eligible students were up to 48% more likely to progress to HE when engaged in intensive outreach.
Uni Connect makes a difference – The largest relative increases in HE entry were observed in FSM-eligible students who participated in Uni Connect-funded activities, further demonstrating the importance of impartial outreach delivered collaboratively.
Access to selective universities improves – Intensive outreach from high-tariff providers increased the chance of progressing to a high-tariff university by 19%.
Sustained support across Key Stages is vital – Outreach delivered across both Key Stages 4 and 5 had the greatest impact, highlighting the need for long-term, multi-stage interventionsthroughout secondary education.
These findings provide compelling evidence that the work being done across the sector to widen participation is not only reaching the right students but changing trajectories at scale. Crucially, this latest research includes previously unavailable controls for student-level prior attainment — adding new rigour to our understanding of outreach impact. You can read the full report on our website.
What’s next for national-level research?
Our ability to generate this kind of national evidence is set to improve even further thanks a successful bid to the Office for Students (OfS) Innovation Fund. Through a collaboration with academics at the Centre for Education Policy and Equalising Opportunities (CEPEO) at the UCL Institute of Education, HEAT will lead on the development and piloting of a pioneering new Outreach Metric, measuring providers’ broader contribution to reducing socio-economic gaps in HE participation. More details about this project can be found here, and we look forward to sharing early findings with the sector in 2026.
Local-level evaluation is just as important
While national analyses like these are essential to understanding the big picture, the OfS rightly continues to require providers to evaluate their own delivery. Local evaluations are critical for testing specific interventions, understanding how programmes work in different contexts, and learning how to adapt practice to improve outcomes. Yet robust evaluation is often resource-intensive and can be out of reach for smaller teams.
This is where use of a sector-wide system for evaluation helps – shared systems like HEAT provide the infrastructure to track student engagement and outcomes at a fraction of the cost of building bespoke systems. Thanks to a decade of collaboration, we now have a system which the sector designed and built together, and which provides the tools necessaryto deliver the evaluation that the OfS require providers to publish as part of their Access and Participation Plans (APP).
We’re also continuing to improve our infrastructure. Thanks to a second successful bid to the OfS Innovation Fund we are building system functionality to support providers to use their tracking data when evaluating their APP interventions. This includes an ‘automated comparator group tool’ that will streamline the process of identifying matched participant and non-participant groups based on confounding variables. By reducing the need for manual data work, the tool will make it easier to apply quasi-experimental designs and generate more robust evidence of impact.
Next steps – sharing through publication
With all these tools at their disposal, the next step is to support the sector to publish their evaluation. We need shared learning to avoid duplication and siloed working. HEAT is currently collaborating with TASO to deliver the Higher Education Evaluation Library (HEEL), which will collect, and share, intervention-level evaluation reports in one accessible place for the first time. By collating this evidence, the HEEL will help practitioners and policymakers alike to see what works, what doesn’t, and where we can improve together.
If we want to continue delivering meaningful progress on access and participation, we need both meaningful, critical local evaluation and powerful national insights. Centralised data tracking infrastructure can give the sector the tools it needs to do both.
The cancellation of the latest NACIQI (National Advisory Committee on Institutional Quality and Integrity) meeting brought back bitter memories that refuse to fade.
It’s been twenty years since I traveled to Washington, DC—dressed in my best lobbying attire and carrying a meticulous roster of Department of Education staff—to visit the Office of Postsecondary Education (OPE) on K Street. My goal was simple, even noble: to seek answers about the opaque workings of accreditation in American higher education. What I encountered instead was a wall of silence, surveillance, and authoritarianism.
I stepped off the elevator on the seventh floor of the Department building and signed in. Under “Purpose of Visit,” I wrote: Reform. I was calm, professional, and respectful. I asked to see the NACIQI Chair, Bonnie, hoping that she would be willing to speak with me about a system that, even then, was falling into disrepair. But what happened next still infuriates me.
Within seconds, two armed, uniformed guards approached me. They didn’t ask questions. They gave an ultimatum: leave or be arrested.
I eventually complied, descending into the lobby, still stunned. From there I began dialing—one by one—through the directory of names I had so carefully assembled. I called staffers, analysts, assistants, anyone who might answer. Not a single person picked up. I could feel the eyes of the guards watching me, one of them posted on the mezzanine like a sniper keeping watch over a public enemy. I was not dangerous. I was not disruptive. I was, however, unwanted.
The next day, I turned to my Congressman, Allen Boyd, whose LA generously tried to intervene. His office contacted OPE, attempting to broker a meeting on my behalf. The Department didn’t even return his call. Apparently, a sitting member of Congress—who didn’t sit on a high-ranking committee—carried no weight at the fortress of federal education oversight.
This most recent overstepping by US ED—unilaterally postponing NACIQI’s Summer 2025 meeting—reminds observers of how limited the oversight provided by NACIQI really is. It is, apparently, nothing more than a performative shell that fulfills ceremonial functions, and not much more.
I would argue that this latest episode reveals that NACIQI is less an independent watchdog and more a ceremonial body with limited real power, and so my view differs somewhat from David Halperin, because he sees more substantive activity than I do.
The history of ACICS (Accrediting Council for Independent Colleges and Schools) and SACS (Southern Association of Colleges) appearing before NACIQI illustrates how regulatory capture can manifest not only through industry influence, but also through bureaucratic design and process control. The OPE’s central role, combined with NACIQI’s limited enforcement power, has allowed failing accreditors to retain recognition for years, even in the face of overwhelming evidence of noncompliance and harm to students.
The illusion of accountability has long been a feature of the accreditation system, not a flaw. NACIQI meetings, when they occur, are tightly scripted, with carefully managed testimony and limited public engagement. The real decisions are made elsewhere, behind closed doors, often under the influence of powerful lobbying groups and entrenched bureaucracies that resist transparency and reform at every turn.
Despite the increasing scrutiny on higher education and growing public awareness of student debt, poor educational outcomes, and sham institutions, the federal recognition of accreditors remains an elite-controlled process. It is a closed loop. Institutions, accreditors, and government officials all play their roles in a carefully choreographed performance that rarely leads to systemic change. The result is a system that protects institutions at the expense of students, particularly the most vulnerable—low-income, first-generation, and minority students who are often targeted by predatory schools hiding behind federal accreditation.
This is the reality of the U.S. Department of Education’s accreditation apparatus: inaccessible, unaccountable, and increasingly symbolic. NACIQI, far from being an independent advisory body, has always functioned as a ceremonial front for political appointees and entrenched interests. It is, as I see it, just another arm of Vishnu—multiplicitous, all-seeing, but ultimately indifferent to critique or reform. Whether it’s chaired by a bureaucrat or a former wrestling executive like Linda McMahon, the outcome is the same: the process is rigged to exclude dissent and suppress scrutiny.
And yet, pundits today still fail to grasp the implications. They speak of accreditation as if it were a technocratic process guided by evidence and integrity. They act as if NACIQI were a neutral arbiter. But I know otherwise, because I was there—thrown out, silenced, and treated like a trespasser in the very institution that claims to protect educational quality and student interest.
This is more than personal bitterness. It’s about structural rot. When critics are expelled, when staff are muzzled, and when public servants ignore elected representatives, we are not dealing with oversight—we are witnessing capture. Accreditation in this country serves the accreditors and the institutions, not students, not taxpayers, and certainly not reformers.
Two decades later, the anger remains. So does the silence.
Sources: Department of Education building directory and procedures (2005) Congressional Office of Rep. Allen Boyd (archival record, 2005) Public notices regarding NACIQI meeting cancellations (2024–2025) David Halperin, Republic Report