Holiday shopping doesn’t need to empty your wallet or your sanity bar. Here’s a lineup of fun little treasures for friends, family or that one person who says “I don’t need anything” every year.
This list features 22 highly rated and well received items handpicked by Student Life Network!
P.s. You can also totally gift these to the most deserving person on planet earth… YOU! Treat Yo-self 
*Prices reflect the date of November 28, 2025.
Flower candle warmer lamp
~$31+ (after tax)
For: Candle lovers who want the scent without worrying about an open flame.


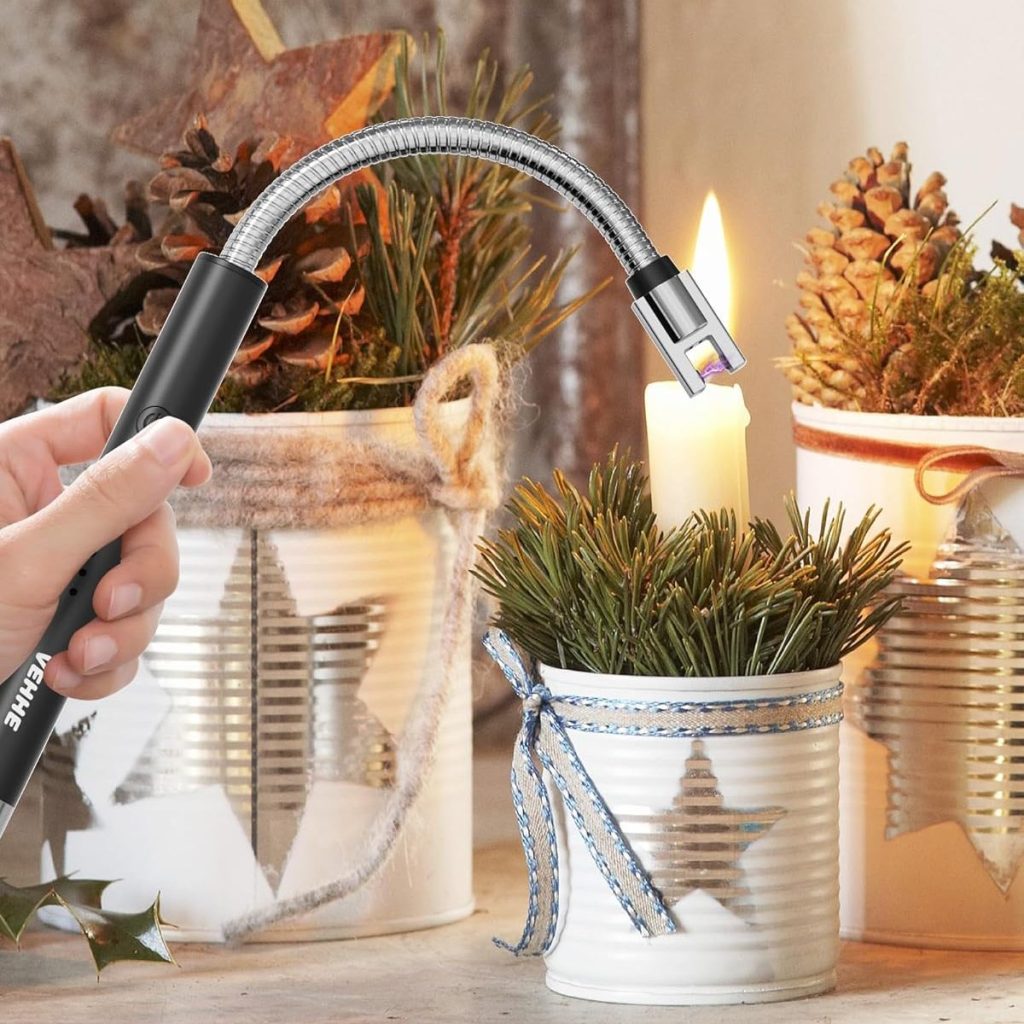
Rechargeable electric lighter
~$9 (after tax)
For: Those that prefer classic candles. Features a safe switch and long-lasting rechargeable battery!
Snowflake multi-tool
~$11 (after tax)
For: The handy friend who loves having tools ready for quick fixes.


Electric mug warmer
~$13 (after tax)
For: Anyone who gets distracted and forgets their coffee until it’s cold.
Casio watch
~$25+ (after tax)
An iconic Japanese brand known for quality, affordability and classic styles.


Page turner remote and ring
~$16 (after tax)
For: People who enjoy hands-free scrolling or like watching videos on the treadmill at the gym!
LEGO flower set
~$16+ (after tax)
For: Plant lovers who want something decorative and maintenance-free.


Portable precision pocket scale
~$13 (after tax)
For: Bakers, matcha fans, fitness enthusiasts counting macros, or anyone who loves precision cooking.
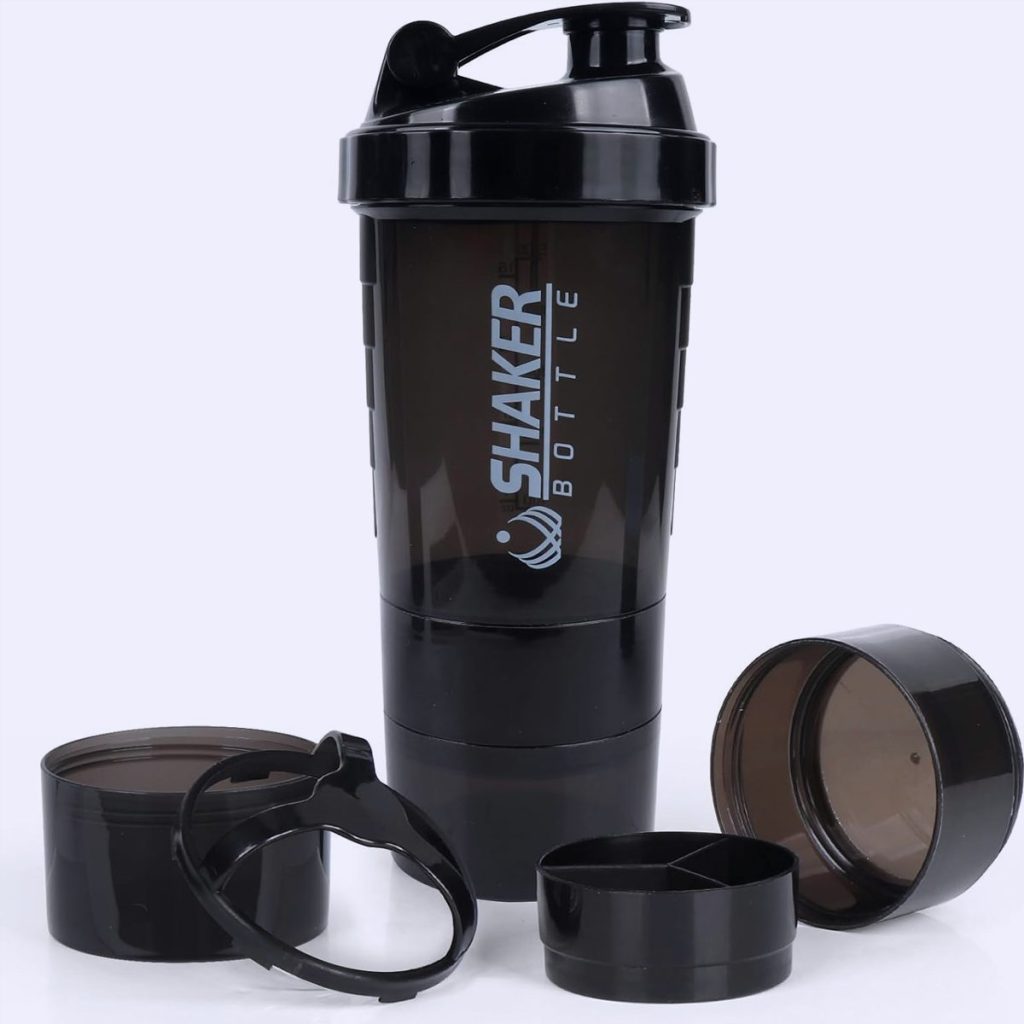
Protein shaker bottle with compartment
~$13 (after tax)
For: Gym goers, smoothie makers or anyone who’s always on the move.

Silk pillowcases
~$14+ (after tax)
For: Anyone who loves a soft pillow that’s also beneficial for their skin and hair.
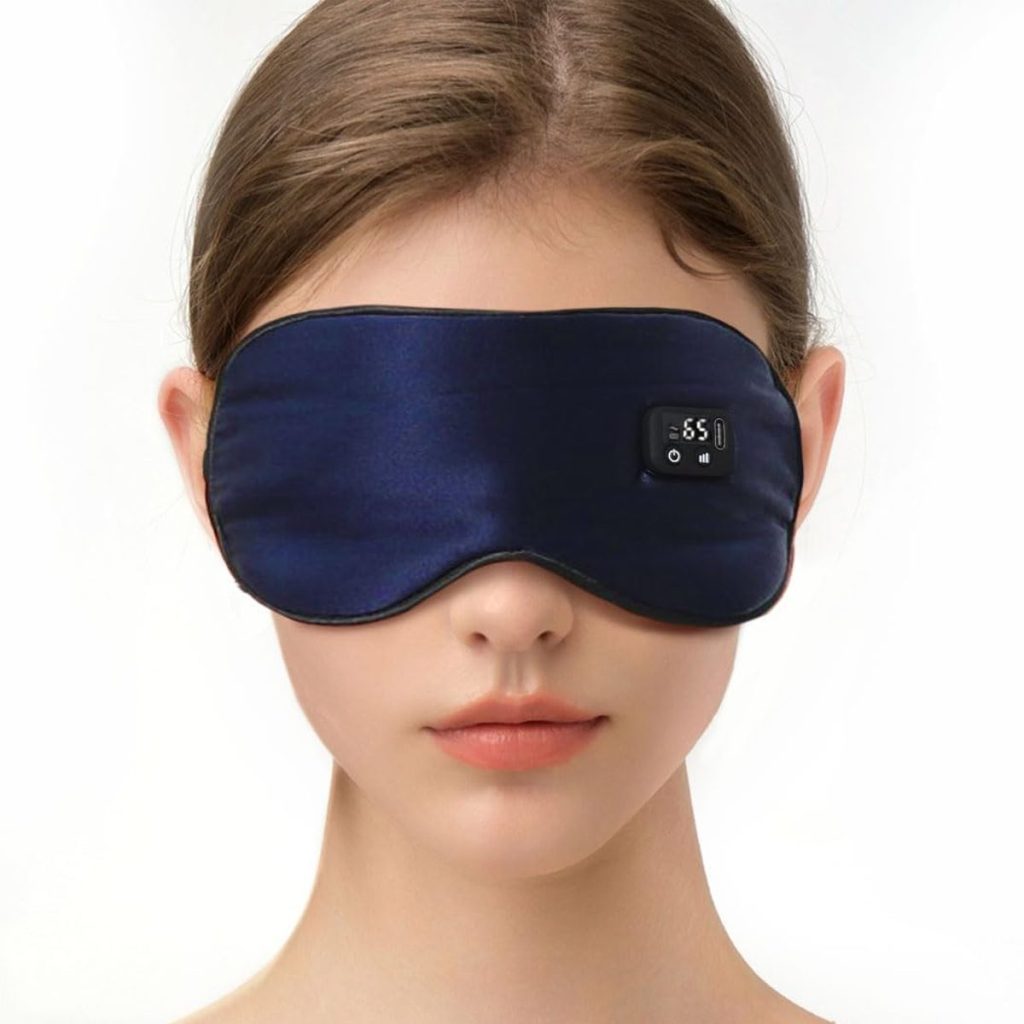
Cordless heated eye mask/compress
~$45 (after tax)
For: People who deal with tired eyes, dry eyes, or long screen days.

Scalp massager
~$11+ (after tax)
For: Anyone who enjoys a relaxing head massage, or a deeper shampoo clean.
Colouring books
~$12 (after tax)
For: Anyone who likes relaxing creative activities or wants a quick mental break.


Acrylic paint pens
~$13+ (after tax)
For: Creative friends who enjoy decorating notebooks, bottles or crafts.
Car 360° phone holder
~$23 (after tax)
Nothing more tedious than navigating with one hand and driving with another.
For: Drivers to navigate safer with a hands-free setup.


Portable phone charger
~$23+ (after tax)
For: People who always run low on battery when out. Perfect for small pockets and purses while packing a full charge. Make sure you get the charging port that’s compatible!
Remote control plugs
~$17+ (after tax)
For: Those with hard to reach outlets and like the traditional feel of a remote control.

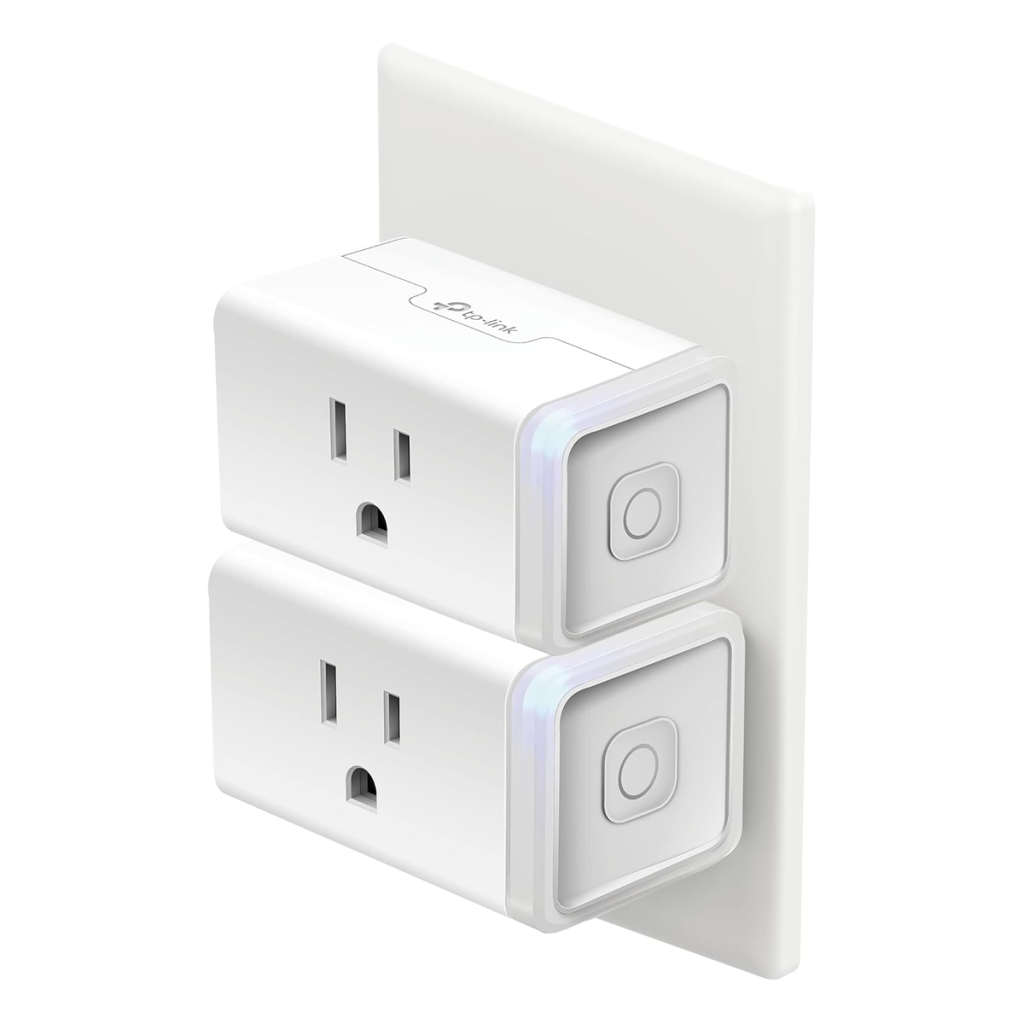
~$21+ (after tax)
Smart plugs
For: Those looking to make the home a little smarter. Control appliances, lamps and electronics with smart devices or phone app.
Sunset lamp
~$17+ (after tax)
For: Anyone stuck with bright fluorescent lights but want softer lighting and elevating the mood.

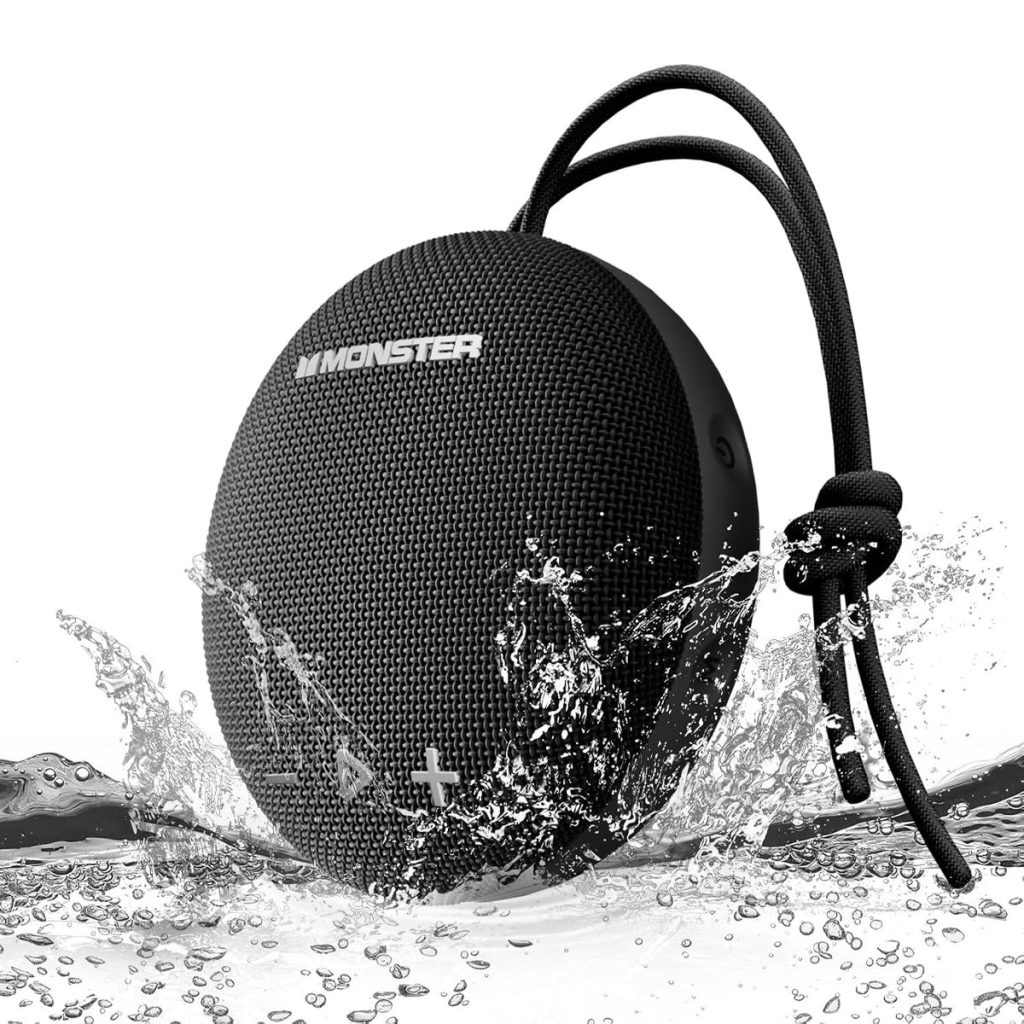
Waterproof bluetooth speaker
~$45 (after tax)
For: The shower performers! Also great for traveling and beach days.
Wireless gaming controller
~$50+ (after tax)
For: Perfect for gamers and multiplayer games. Available in various models compatible to gaming systems (PC, Xbox, Nintendo and Playstation.)


One Line a Day: a five-year memory book
~$29 (after tax)
For: Someone who enjoys journaling but prefers something simple and low-effort.
Pro tip: Students get a 6-month trial of Amazon Prime for FREE! Start your trial today and get fast two-day shipping as well as exclusive perks on affiliated services (Prime Video, Twitch, Prime Photos).
The post Cool Gifts Under $50 for All Ages appeared first on Student Life Network Blog.