This audio is auto-generated. Please let us know if you have feedback.
A large majority of U.S. adults say the cost of attaining a college degree is more expensive than it actually is — a perception that may cause some to forgo education beyond high school, according to a May report from Strada.
Among adults , 77% say college is unaffordable, according to Strada’s November 2024 survey of over 2,000 people. And 65% somewhat or strongly agreed that college is prohibitively expensive, regardless of how motivated the student is. But most people significantly overestimated the cost of attending both two- and four- year public institutions, the report found.
According to Strada’s latest report, 1 in 5 people “substantially overestimate” the cost of attending community college — reporting that the cost is more than $20,000 annually. A majority estimated that it costs more than $10,000 a year. In actuality, the average student pays about $6,000 annually, the report said, citing College Board data.
For public four-year institutions, just 22% of the survey’s respondents correctly identified that it costs the average student between $20,000 and $30,000 annually to attend, with about 35% believing it costs $40,000 or more.
These misperceptions are often fueled by the complex financial aid process and a lack of transparency surrounding the true cost of attending college, as many students are unaware that the price of attendance is often much less than the sticker price, the report added. That’s an issue that many colleges have tried to address in recent years.
“When students and families believe that college is out of reach financially, it can influence key decisions that shape college-going behavior, from which classes they choose in high school to whether they begin saving for college,” said Justin Draeger, senior vice president of affordability at Strada and a co-author of the report.
Strada’s findings follow a host of other research papers and surveys indicating that a growing number of adults say the value of a college degree is not worth the cost. However, research has shown that college graduates often have better financial outcomes than those who did not receive a diploma beyond high school.
The cost of price misconceptions
The cost of attending college is expensive and can be challenging for many students and families to afford, said Draeger. But when factoring in financial aid, the cost is more affordable than people realize, he said.
Overall, 37% of adults said the cost of college was not affordable at all, and 40% said it was not very affordable. Just 18% thought it was somewhat affordable and 5% indicated it was either extremely or very affordable.
A whopping 85% of adults said the cost of attending public four-year institutions is too high. And while community colleges are generally viewed as more affordable, two-thirds of adults said the cost of attending them was too expensive.
Misperceptions abound the cost of community college undercuts one of the strongest value propositions it has: affordability, said Draeger. For four-year schools, those perceptions can compound a range of existing issues, such as declining public trust in the value of a four-year degree and public backlash that exacerbates enrollment declines, he said.
They could also veer some adults from higher education altogether. About 40% of people do not enroll in college immediately after graduating high school, and just 54% of U.S. adults ages 25 to 64 have a postsecondary credential, the report said.
It also points to “a systemic failure in the way we price and market college,” said Draeger. Financial aid and financing systems are “complex, multistep and opaque, and filled with unfamiliar terminology and jargon,” he said.
A growing number of colleges have sought to counter sticker price misconceptions by resetting their cost of attendance to better reflect the amount students typically pay after factoring in institutional scholarships.
Institutions can also help address the issue by standardizing financial aid terminology, said Draeger. As of June, over 700 institutions have done exactly that through the College Cost Transparency Initiative.
Colleges should also embed price transparency and predictability into their enrollment strategies, Draeger said. That would make “it easier for students to understand what they’ll pay and why, and what sort of return they can expect from their degrees,” he added.
Phillip Levine, an economics professor at Wellesley College, has been studying college financial aid and students’ higher ed spending habits for more than a decade. When his children first started applying to college about 15 years ago, he was amazed by how difficult it was to get a clear answer on how much it was really going to cost them—and he was a trained economist.
Imagine, he thought, how the average family felt reading through interminable webpages and offer letters explaining the detailed price breakdowns, differences in tuition and fees, added expected costs, and loans versus grants. Then he tried to imagine how parents who’d never gone to college might feel.
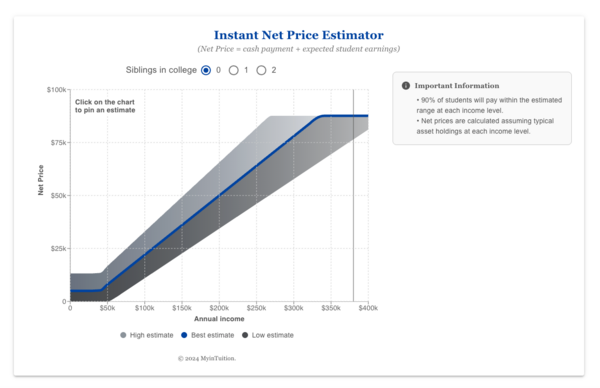
Since then, Levine has worked on a number of college cost transparency initiatives. His most recent project is the Instant Net Price Estimator, a streamlined digital tool that he hopes will make it easier for colleges to break through the noise and deliver a clear estimate to families.
As public skepticism about the value of a postsecondary degree grows and $100,000 sticker prices make front-page news, colleges are in the market for a simple way to let families know that their degrees can be affordable. Washington University in St. Louis became the first institution to adopt the tool and served as a kind of pilot program this application cycle. Interest from colleges has grown swiftly: This fall, an additional 19 institutions will introduce Levine’s calculator on their websites, and he anticipates that number will triple next academic year.
Levine spoke with Inside Higher Ed about his new tool, how low-income students get stuck in the financial aid “funnel” and how colleges can be better communicators in a time of widespread public distrust of higher ed. The conversation has been edited for length and clarity.
Q: Walk me through the genesis of this idea. What were you hoping to achieve?
A: I don’t think it’s a state secret that college pricing is complicated. If you go to any college website and look at the financial aid webpage, there’s tons of stuff there trying to explain how much they charge, but they overshoot it in terms of what people are looking for. You’re taking a high school kid and their family and giving them a Ph.D.-level course in financial aid. Not surprisingly, they don’t usually get it.
I think about the admissions process like a funnel: You give me a little information, I’ll give you a basic answer that’s pretty imprecise. You give me more information, I’ll give you a better answer that’s a little more precise. You can keep going down the process until eventually, you know, ultimately you fill out the FAFSA or the CSS Profile.
To maximize access, that funnel needs to have a very wide mouth at the top; in financial aid language, what that means is you need to communicate extremely quickly to as wide an audience as possible that college is not $100,000. It doesn’t even matter exactly what it is. But if you can’t get people off of the ledge at the $100,000 number—the mainstream media puts out stories all the time that college costs a million dollars a year, so their perception is that it’s extremely expensive. All you want them to do at the beginning stages is to be like, “Hey, maybe this is something I can afford.” Then you need to lead them through the rest of the funnel.
Phillip Levine
Ultimately, the financial aid process really is complicated because we have this concept of what a family can afford to pay, and there’s no right answer to that question, but we have all these complicated formulas that are trying to find it anyway. Over time, colleges have been trying to do a better job of getting past that point, just not very successfully. What I’ve been working on for the last 10 or 15 years is to make an easier entry point, and this tool is even higher up the funnel than what I’ve been working on in the past.
It takes three seconds to get a sense of what college is going to cost you, and in particular to get you over that hurdle that it’s probably not $100,000. My goal is within a matter of literally a few seconds to give people a sense that college is very unlikely to be as expensive as they fear. And then you can start having a more substantive conversation. Otherwise, you close the door on the poor kids, way before they’re into the process.
Q: Colleges have been trying to do this kind of thing on their own for a while. What makes your tool an improvement on institutional efforts?
A: Colleges understand that this is a problem. But to be quite honest, the only people who actually understand the way the financial aid system works are the people in the financial aid office, and they don’t speak English, so to speak. It’s an unbelievably complicated process, very complex, and now they have to explain it to a regular person, and they can’t do that. It’s not their fault; they try, they’re just not successful. There’s a handful of people in the admissions office who understand it, too, but not many. And once you get past those two audiences, nobody else at the college understands it, including the public affairs people.
I got started on this because when my kids were looking at colleges, I just wanted to know whether I was eligible for any financial aid, yeah. And I realized how unbelievably hard it was to figure it out. Back then [around 2010] it was actually impossible to figure out. Things have evolved a lot since then.
Q: Like you said, there are other tools out there now. What makes this one different?
A: I’m just trying to push it to the next stage of development. I’m an economist; I can speak geek as well as anyone. But as I started doing this, I’m learning more and more about how you sell a product, which is basically what you’re doing with college cost. I’m realizing how little time you have to communicate a message.
I’m in a weird position, because I’m doing the research on the pricing issues, and I’m developing the tools. It was in one of the Brookings [Institution] papers I wrote when these ideas were just kind of coming together and we were thinking about how you do the graphics. And it just kind of came together that we can visually display this information in a simulator, what I really refer to as a simple game. So I thought, if I can do it for a Brookings paper, why can’t I do this for a school or a family? And about that time, Washington University [in St. Louis] came to me looking for assistance on some other issues, and I pitched this to them, and they bought into it. So they paid for the development, and it’s been up and running there since December. If you go to most schools’ webpages, including my own, there’s stuff there, but you gotta read forever. And you know as well as I do that nobody reads that much anymore.
That’s what I’m trying to accomplish with this: just get the ball rolling with something that speaks to where students are.
A demo version of Levine’s Instant Net Price Estimator, which can be customized to fit colleges’ specific needs and profiles.
Screenshot from myintuition.org
Q: I assume the calculator doesn’t factor in things like merit aid?
A: You want it as simple as possible. So you just slide your input and it essentially just tells you what the average cost is going to be for you based on income, and tells you the range, which may be very broad. At Washington University, they don’t give a lot of merit aid, so, like, it would not be a big deal there, but at schools that do a lot of merit aid, that range could also include merit. They can factor that into the calculator.
But mainly, you just want the light bulb to go off of, “Oh, maybe I can afford this.” And then maybe they’re willing to go spend some time reading instead of getting scared off right from the start. Their initial instinct is, there’s no way I can afford to go to Washington University. And it’s the school’s job in terms of marketing to communicate to people. The problem, in my mind, is that the door is closed so early for so many people that you need to be able to just let them get through that first door in the process. There’s still a lot of hurdles you have to get through after that, yeah, but if you don’t make it through the first one, you don’t even approach any of the others.
Q: There’s been legislation introduced at the federal level and passed in many states to mandate that colleges take certain steps toward cost transparency. Do you think there’s a good understanding of what that takes among policymakers?
A: Clearly, policymakers have figured out that transparency is an issue, and they’re right. But their intentions are often better than their proposals. The net price calculator law [a federal law mandating institutions include a price calculator on their websites by 2011], for instance, was very well intended. But it’s easy to see the big picture problem; to then come up with a solution that actually works, you have to have a little bit more inside baseball. The net price calculator law is a perfect example. It was so well intended, they completely had the right idea, and they blew it. I obviously don’t know all of the details of all the different state laws, but I’ve seen proposals, and generally I look at them and go, right idea, wrong solution.
Q: Have there been any good policy solutions?
A:The College Cost Transparency Initiative. It’s much better if the schools can fix this problem on their own, because they know what they’re doing. It’s a tiny step, and you have to already apply and get accepted before you get your letter. And then it tells you, in a more clear way than it used to. It’s lower on the funnel, really at the bottom. But it’s a good step.
[Levine later clarified that he sat on the technical advisory committee for the CCTI.]
Q: Has there been a lot of interest in your instant price calculator from other colleges? And what kinds of colleges seem to be most invested in these transparency efforts?
A: Nineteen more colleges will roll it out in the fall. It’s a small range right now, from relatively wealthy to very wealthy. I think at the very high end of higher ed, the Ivies and such, where they have a lot of money to spend on financial aid, they’re trying to increase access in a very direct way. It is good for them to enroll more lower-income students from a public relations perspective. And I think every school wants to do the right thing. But as you stray from the very top of the spectrum, there’s also an interest in simply increasing enrollment, where they don’t want to be turning away students because they think they can’t afford it when they can. They’re just looking for more students, especially because there’s fewer kids. So the ability to open the door to as many kids as possible at this moment has appeal.
If you are the kind of person who sits down to read analysis of the latest available TRAC (officially, Transparent Approach to Costing) data the last thing you would expect would be cautious optimism.
The sector, after all, is circling the financial drain – and when you can read press releases from unions and sector representative bodies that say fundamentally the same thing you could feel confident that this is the situation.
Much of what we’ve recently read in the press is about the impacts of measures taken to address this financial peril – course closures, job cuts, changes in terms and conditions, and a retreat from spending plans on everything from maintenance to recruitment.
And what the latest TRAC tells us is that these measures are working.
Who turned on the light?
To be clear, it’s not time to quit lobbying for a better funding settlement.
Based on 2023-24 submissions from 128 institutions in England and Northern Ireland the sector has an aggregate deficit of £2,003m – down substantially from £2,854m in 2022-23. The sector has made savings of more than £800m between two years – no mean feat where costs are rising and the value of income is falling.
What’s going on under the hood is that institutions are getting better at recovering the costs of things they are funded to do – 95.7 per cent of costs were recovered in 2023-24, up from 93.6 per cent in 2022-23. Costs still exceed income (they have done since the pandemic) but the direction of travel is promising – providers are generating more income (up 5.8 per cent to £44,508m) while limiting increases in costs (up 3.5 per cent to £46,511m).
This is good news, but counterintuitive. We know that staff costs are rising (there was an annual pay uplift, and pensions spending has increased substantially for those providers involved in TPS), we know that the cost of doing business (everything from maintenance to logistics to consumables is rising). And TRAC confirms this – staff costs are up 6.4 per cent, other operating costs are up 4.7 per cent, on last year.
There are savings in the costs of finance (such as interest payments) – these have fallen 13.3 per cent over last year, though this does not make a huge contribution to overall spending.
MSI (coming on like a seventh sense)
We do, however, need to talk about the margin for sustainability and investment (MSI). It’s the most controversial part of the TRAC specification, and when you tell people that universities need to have at least some money for non-income generating fripperies like student support and estates maintenance within any calculation of the cost of doing business they will lose their minds.
The calculation is done by institution and is based on an average of three years of data and three years of projections (the nerd in me wants to be clear that these are based on Earnings Before Interest Taxation Depreciation and Amortisation – EBITDA) expressed as a proportion of full economic costs. In 2022-23 this was £3,770m (8.4 per cent of FEC), in 2023-24 this was £3,548 (7.6 per cent of FEC) for the sector as a whole.
The effect here is that the total costs of running a university (FEC plus MSI) looks lower than it did last year. This is more evidence of savings over multiple years – cutting spending on maintenance, sustainability, and student services. This will make cost recovery and the deficit look better: it doesn’t explain all of the improvements this year but it explains some of them.
The document provides a fuller list of institutional decisions that would have an impact on the MOS calculation – inflationary pressures, a (regulator advocated) caution in recruitment income growth and research activity growth, variability in forecasts as more institutions design in large changes of focus to plans for future spending, and the usual weirdnesses around pension provisions.
Spend less, earn more
So institutions are making cuts, and look financially healthier for it. But there is still an overall deficit, and if cuts and efficiencies are the only answer to financial constraints there is a long and painful road left to walk.
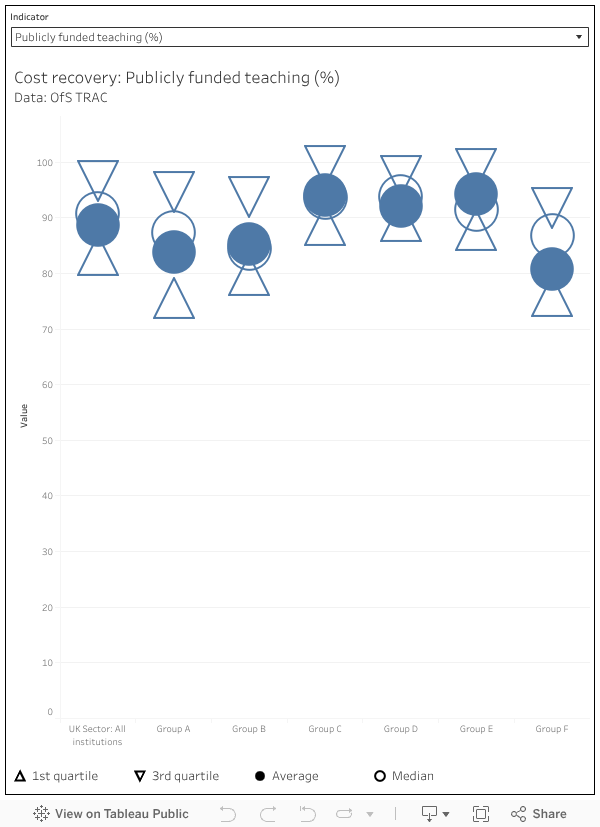
Within the overall £2,003m deficit, the £1,693m deficit on publicly funded teaching is a major contributing factor: for every £100 a university spends on teaching home students, it receives £89.20 from the public purse. This varies, as we will see, by the type of institution in question and what else it gets up to. In real terms income is actually up slightly (a slight rise in the number of students), but it costs more to pay staff and to do all the other things that teaching requires.
Conversely non-publicly funded teaching (all overseas students, and some self-funded home students) has a 143.1 per cent recovery rate, generating at a £3,232m surplus. The recovery rate is actually down marginally on last year, but the overall income from this source is up by 7.8 per cent (to £10,727m).
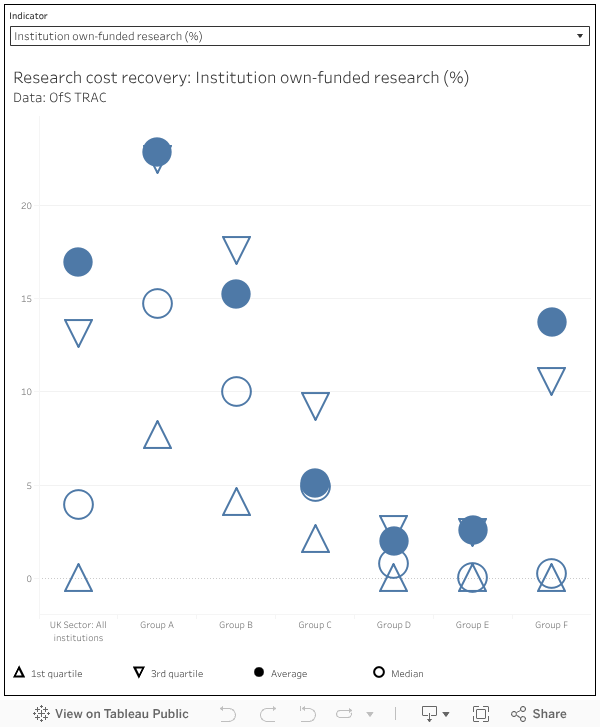
Research has never had a good recovery rate – we’re now down to 66 per cent for 2023-24, from 68.5 per cent the previous year, and again there’s substantial differences by provider type. Again we can point to staff costs and operating costs rising as the reason, but we should also recall that most publicly funded research returns 80 per cent, and some research has no income attached at all.
We should also note that other (income generating) activities like catering and accommodation run a small deficit, while other non-commercial activity (investments, donations, endowments) have an on-paper surplus.
Peer pressure
While the sector level figures are useful, they disguise a lot of diversity in the sector. We still – in 2025 – do not get institutional TRAC data, which would genuinely be useful for understanding where providers have costs that are substantially higher than comparators.
Group A: Institutions with a medical school that get 20 per cent or more of their total income from research (pretty much the Russell Group)
Group B: Other institutions with research income constituting 15 per cent or more of all income (largely the big, research intensive, traditional universities that sit outside of the Russell Group).
Group C: Research income between 5 and 15 per cent of all income (larger and research focused post-92 providers with some pre-92s mixed in)
Group D: Research income less than 5 per cent of a total income greater than £150m (Other big post-92 providers)
Group E: Research income less than 5 per cent of a total income less than £150m (the rest of the traditional universities, plus specialist providers)
Group F: Specialist music and arts institutions (as you might expect)
Here’s what they all spend money on, as a proportion of total expenditure:
It’s not usually a good idea to make blanket statements about sector finances – what’s true for one university is generally not true for another. But in this case the generality is valuable – it highlights that the problems facing the sector are less to do with autonomous decisions and more to do with the overall financial settlement. Individual, provider action is clearly helping the situation. But it won’t be enough.
The argument for investment in R&D goes as follows.
The more innovative an economy is the greater level of economic output it will produce. The more output an economy produces the wealthier a country will be and by extension its citizens will enjoy higher wages, better public services, and a greater quality of life.
Innovation is dependent on two things. The first is the infrastructure to make innovation happen. The great universities, laboratories, equipment, and less prosaically the roads, broadband, and public transport, that facilitate the physical transfer of ideas. The second is human capital. The educated workforce that can turn the raw materials of our collective knowledge into new products and services which make the economy strong and society better.
The ideal scenario has two major assumptions. The first is that the products of innovation will be widely felt in the economy to spur economic growth and these benefits will be felt by the workers who are not taking part in R&D intensive activities. In other words, private activities have a spill over benefit to the public at large. The second is that human capital will be allocated efficiently where the best people to do R&D will be placed in the best roles and the market will reward them for their time.
This means that work in R&D should return higher wages through the input (people’s labour) and through its output (a more productive economy.) A new independent report for DSIT has raised questions on whether the benefits of R&D are felt evenly either by its producers or the population at large.
Skill issue
As the report highlights there is little empirical evidence on the kind of R&D workforce the UK needs. The evidence of which kinds of people in which kinds of roles will spur which kinds of R&D activity is poorly understood across geographies, it is poorly understood which specific skills are needed, and it is poorly understood which skills are needed to meet the R&D challenges of the future.
This is surprising when we learn that 56 per cent of all business R&D spend is spent on staff and the number of people working in roles essential for R&D activity has grown by over a million in the past eleven years. Owing to changes in R&D accounting methodology it’s hard to suggest whether R&D activity or spending intensity has increased at the same rate. It is however true that there are regional imbalances in R&D spending, R&D intensive roles generally pay more, and despite an increase in the R&D workforce the UK’s overall productivity levels remains frustrating low.
Successive government industrial strategies, incentives, and supply-side reforms, aimed at any kind of redistribution of the proceeds of R&D activity may not have been an effective counterweight to the incentives of business to simply invest where they will see the largest private returns.
Imbalances
There is a distinct problem that the R&D workforce is imbalanced. Some parts of the R&D economy, particularly roles like software, have an underrepresentation of women, a significant number of people with level four and above qualifications, and growth is rapid in London and the South East. There is both a demographic and geographic equality issue which means the benefits of R&D investment are not broadly felt across the UK population.
This is bad on its own terms. It is not a good outcome for society that the public investment in R&D through subsidies, tax credits, capital investment, infrastructure, and the myriad of kinds of corporate welfare, is producing a workforce which has gendered earning inequalities amongst even the highest paid R&D workers (albeit this less than some parts of the labour market), where growing investment is concentrated in the most economically prosperous part of the country, and where there is significantly more instability for the least qualified workers.
As the report points out, academic literature demonstrates that a more diverse workforce is good for economic growth, productivity, innovation, and entrepreneurship. The inequality of inputs limits the UK’s innovation potential, which in turn impacts how widely the benefits of R&D are felt. Compounding this innovation trap is the UK’s poor record at in work training, geographic inequalities in access to jobs, challenges with university pipelines into specific skills, and geographic imbalances in hard to fill vacancies.
Universities
The solution to a more dynamic R&D workforce does not fall exclusively at the door of universities. As the report highlights, universities are churning out large numbers of graduates in subjects aligned to the R&D intensive roles. However, there is a significant undermatching in those graduates then being able to deploy their skills in the labour market. There is also a significant gender imbalance in university recruitment into STEM programmes which then leads into the imbalances in the workforce.
Interviewees for the report also suggested that university CPD for R&D industries could help close skills gaps and redefining their commercial approaches with SMEs could help with the workforce challenges. Yes, but it also doesn’t feel like universities should be responsible for the permanent reskilling of their graduates. Again, in work training in the UK is low.
The labour market in R&D is the product of every step up to someone entering the workforce and then the conditions once they are in it. At the current trajectory the UK will have an ever large R&D workforce but the expansion in its size will not occur conterminously with a geographic or demographic expansion of its impacts.
Universities are not factories that churn out graduates with neatly aligned skills to the ever changing demands of the labour market. However, this report does convincingly point out that the UK’s economy benefits from diverse firms and more diverse firms will only happen with more diverse graduates.
Drive along any motorway in September and you will see car after car full of duvets, pots and pans, and clothes as students head off to pastures new. I remember my own experience, crossing the Severn Bridge with the bedding on the front seat of my Fiesta muffling Oasis’ Definitely Maybe.
This stereotypical view of a literal journey into higher education isn’t the case for everyone, however. In fact, far more students live at home during their studies than you may think.
The UCAS application asks students about whether they intend to live at home. In 2024, 30 per cent of UK 18-year-olds said they planned to live at home during their studies – up from 25 per cent in 2019 and just 21 per cent in 2015.
However, when we look beyond the headline numbers, over half of the most disadvantaged students (IMD Q1) live at home during their studies, compared to fewer than one in five of the least disadvantaged (IMD Q5). Regional distribution will have an impact here, particularly London.
Scottish students are more likely to live at home during their studies. On a recent visit to Edinburgh, all the students I met spoke with excitement about their plans to study at their chosen university within the city. By contrast, Welsh domiciled students are the least likely to live at home during their studies.
In London, 52 per cent of 18-year-olds progress to HE – with around half of those students staying in London, making it unsurprising that the capital sees the highest proportion of live at home students in England.
Cost of living pressures
Cost of living is undoubtedly influencing student choice. At the January equal consideration deadline, UCAS saw a 2.1 per cent increase in the number of UK 18-year-old applicants – a record high. However, regular readers of Wonkhe will know this also represents a decline in the application rate – the proportion of the 18-year-old population applying to HE, and UCAS insight increasingly points to the cost of living playing a role.
Our latest survey insight suggests that 43 per cent of pre-applicants feel they are less likely to progress to HE due to cost-of-living pressures, up from 24 per cent in 2023 – although their commitment to going to university remains high.
Financial support is also of growing importance to students when it comes to deciding where to study. While finding the perfect course content was the most important factor when shortlisting universities (49 per cent), the financial support available while studying (such as a scholarship or bursary) was a close second (46 per cent). Specific cost-of-living support offered by universities was third (34 per cent).
The availability of support with the cost of living has risen in relative importance as a factor when shortlisting universities from 12th in 2022 to 3rd in 2024 – a significant shift, which suggests a change in student mindset. There have also been large changes in rank importance of “universities that are close to home” from 9th to 4th, “universities with low-cost accommodation” from 13th to 7th and “universities I can attend but still live with my parents” from 16th to 11th.
Source: Potential applicants for 2025 entry, 1,023 UK respondents, Dec 2024–Jan 2025
It isn’t just at the point of application where we see the cost of living impacting choice. In 2024, UCAS saw 43,000 students decline the place they were holding in favour of an alternative institution or subject – making this the largest group of students using Clearing.
This is not a spur of the moment decision, with 52 per cent having already decided to do this prior to receiving their results and a further one in five considering it based on their results.
When asked what drove their decision, 23 per cent told us they had a change in personal circumstances and 17 per cent wanted to live somewhere cheaper. We also know this impacts on all cohorts of students – 19 per cent of international students that don’t accept a university offer through UCAS tell us they have found a more attractive financial offer elsewhere.
However, the primary reason that students use Decline My Place is linked to the course, with 31 per cent changing their mind about the subject they wish to study.
Support measures
It’s clear that cost of living and financial support is a key factor influencing student choice and so we must ensure this information is easily accessible and understood by students.
Students tell us they’d like more practical information about student discounts, financial support packages or bursaries/scholarships. UCAS will shortly be launching a scholarships and bursary tool to promote these opportunities to students.
Around half of offer holders in 2024 recalled receiving information about cost of living support. This presents a timely opportunity for any university staff working in marketing, recruitment or admissions to ensure information about financial support is easy to find on their website, along with information about timetabling to help students understand how they may be able to balance work and study commitments.
There will be certain groups of students that are even more acutely impacted by cost of living challenges. Last cycle saw a record number of students in receipt of Free School Meals – 19.9 per cent – enter HE. Whilst it is only a small part of the puzzle, UCAS has removed the application fee for these students.
Cost of living pressures are likely to persist, with students continuing to assess the value of HE in this context. The sector should continue to highlight the benefits of university study as a vehicle for social mobility, along with the graduate premium – the higher earnings they typically earn compared to non-graduate peers. But we also need to make it clearer how HE of all forms remains accessible – from funds for travel to open days, to in study commuter breakfasts, hardship funds, cost of living support, and high-quality careers guidance to support graduate employability.
This article is published in association with UCAS. It forms part of our ongoing series on commuter students – you can read the whole series here.
The Department of Defense is planning to cap indirect cost reimbursement rates for higher education institutions at 15 percent, according to a May 14 memo signed by Secretary of Defense Pete Hegseth.
“The Department of Defense (DoD) is the steward of the most critical budget in the Federal Government—the budget that defends our Nation, equips our warfighters, and secures our future. That stewardship demands discipline. It demands accountability. And it demands that we say no to waste,” wrote Hegseth.
The memo directs the DOD to develop the new policy within 21 days, marking the fourth federal agency—including the National Institutes of Health, the Department of Energy and the National Science Foundation—that has enacted a plan to cap indirect cost rates at 15 percent. For decades, universities have negotiated with the federal government to calculate bespoke indirect cost reimbursement rates to pay for research costs that support multiple grant-funded projects, such as facilities maintenance, specialized equipment and administrative personnel. (The paragraph has been updated.)
Universities and their trade associations have already sued the NIH, DOE and NSF over these plans, arguing that capping indirect costs would hurt research production and compromise global competitiveness, all while violating multiple aspects of the Administrative Procedure Act, including bypassing congressional authority required to alter indirect cost rates. So far, federal judges have blocked indirect cost caps from taking effect at the NIH and DOE. The NSF agreed to pause the cap until June 13 in order to proceed to summary judgment, which is a way to resolve the case quickly without a full trial.
Matt Owens, president of COGR, which represents research institutions, condemned the DOD’s newly announced plan.
“DOD research performed by universities is a force multiplier and has helped to make the U.S. military the most effective in the world. From GPS, stealth technology, advanced body armor, to precision guided missiles and night vision technology, university-based DOD research makes our military stronger,” Owens said in a statement. “A cut to DOD indirect cost reimbursements is a cut to national security. Less funding for research means less security for our nation.”
Hegseth’s memo claimed that capping the Defense Department’s indirect cost rate for universities would “save up to $900 [million] per year on a go-forward basis,” while also claiming that the department’s “objective is not only to save money, but to repurpose those funds—toward applied innovation, operational capability, and strategic deterrence.” The NIH has also made similarly incompatible assertions. It touted on social media its indirect rate cap plan’s potential to save taxpayers more than $4 billion, while a lawyer for the NIH told a federal judge that the cut was simply a reallocation of funds.
The Defense Department’s plans “will not stop at new grants,” Hegseth wrote, adding that “meaningful savings can also be achieved by revisiting the terms of existing awards to institutions of higher education.” The memo directed the under secretary of defense for research and engineering to do the following within 30 days:
Initiate a departmentwide effort to renegotiate indirect cost rates on existing financial assistance awards to institutions of higher education. “Wherever cooperative, bilateral modification is possible, it shall be pursued.”
“Where bilateral agreement is not achieved, identify and recommend lawful paths to terminate and reissue the award under revised terms.”
“Complete renegotiations or terminations for all contracts by 180 days from the date of this memorandum.”
This audio is auto-generated. Please let us know if you have feedback.
Dive Brief:
For each student who is chronically absent in California schools, there’s a $5,630 economic burden to the community, according to a report released Wednesday by the University of Pennsylvania Graduate School of Education’s Center for Benefit-Cost Studies.
Each expulsion costs $70,870 in social burdens such as increased likelihood of dropping out, said the report, which was developed with the University of California, Los Angeles’ Center for the Transformation of Schools.
Using state, school and student data, researchers calculated the total economic burdens and gains resulting from factors such as graduation rates, school attendance and disciplinary infractions. To improve those factors and offset burdens, the report calls for more equitable opportunities for student success, as well as efficiency-based reforms like the use of a multi-tiered system of supports framework.
Dive Insight:
Like many other localities, California’s chronic absenteeism rate rose because of the COVID-19 pandemic. In the 2019-20 school year, the state’s chronic absenteeism rate for all students was 10%, compared to 30% in 2021-22, which was the same rate nationally. The report uses a common definition of chronic absenteeism, which is when a student misses 10% of the school year, or about 18 days.
The report also calculates that each suspension costs $27,260 and each disciplinary restraint adds up to $6,040. The economic burden for each student who does not graduate high school is $478,440.
On the other hand, a 3 percentage point increase in California’s high school graduation rate would add almost $10 billion to state coffers and $3 billion in taxpayer savings.
To calculate these financial burdens and gains, researchers used an economic model that accounts for all the resources that are needed or contributed to for each educational status over an individual’s working life.
For example, the lifetime social gain of an 18-year-old who graduates high school is $478,440, or $681,930 if the student enrolls in college, according to the report. A variety of factors are taken into consideration in this calculation, including the estimation of higher earnings with additional education and the assumption of reduced criminal activity, improved health status and less reliance on a social safety net.
A. Brooks Bowden, an associate professor of educational policy at the University of Pennsylvania and director of the Center for Cost-Benefit Studies of Education, said the study’s findings in California are an indication of potential economic burdens nationwide.
“Addressing these challenges can lead to substantial savings and improved educational outcomes across the country,” said Bowden in a statement.
The report also said multi-tiered system of supports holds the promise of efficiency in education, because rather than schools delivering extensive support to all students, the MTSS framework provides resource-intensive supports to students with the highest need, as well as equitable services because interventions are individualized based on data.
The MTSS framework has been used by districts across the country to address stubborn absenteeism rates. This approach — which begins with universal supports and increases the intensity of interventions based on student needs — is also promoted by Attendance Works, a nonprofit that provides school attendance resources.
A coalition of universities and trade groups is suing the National Science Foundation over the independent federal agency’s plan to cap higher education institutions’ indirect research cost reimbursement rates at 15 percent.
In the lawsuit, filed Monday in the U.S. District Court for the District of Massachusetts, the same day the NSF’s new policy went into effect, the coalition argued that a cut would risk the country’s standing “as a world leader in scientific discovery” and “the amount and scope of future research by universities will decline precipitously.”
It warned that “vital scientific work will come to a halt, training will be stifled, and the pace of scientific discoveries will slow” and that “progress on national security objectives, such as maintaining strategic advantages in areas like AI and quantum computing, will falter.”
Plaintiffs in the lawsuit include the American Council on Education, the Association of American Universities, the Association of Public and Land-grant Universities, and 13 universities, including Arizona State University, the University of Chicago and Princeton University.
They attest that the NSF violated numerous aspects of the Administrative Procedure Act, including bypassing Congress to unilaterally institute an “arbitrary and capricious” 15 percent rate cap and failing to explain why it’s only imposing the policy on universities.
The NSF awarded $6.7 billion to some 621 universities in 2023.
Indirect costs fund research expenses that support multiple grant-funded projects, including computer systems to analyze enormous volumes of data, building maintenance and waste-management systems. In 1965 Congress enacted regulations that allow each university to negotiate a bespoke reimbursement rate with the government that reflects institutional differences in geographic inflation, research types and other variable costs.
Typical negotiated NSF indirect cost rates for universities range between 50 and 65 percent, according to the lawsuit.
And while the Trump administration has claimed that indirect cost reimbursements enable wasteful spending by universities, the plaintiffs note that an existing cap on administrative costs means that universities already contribute their own funds to cover indirect costs, “thereby subsidizing the work funded by grants and cooperative agreements.” In the 2023 fiscal year, universities paid $6.8 billion in unrecovered indirect costs, the lawsuit read.
The NSF is the third federal agency that has moved to cap indirect research costs since President Donald Trump took office in January; federal judges have already blocked similar plans from the National Institutes of Health and the Department of Energy.
“NSF’s action is unlawful for most of the same reasons,” the lawsuit read, “and it is especially arbitrary because NSF has not even attempted to address many of the flaws the district courts found with NIH’s and DOE’s unlawful policies.”
A federal judge temporarily blocked the U.S. Department of Energy’s plan to cap universities’ indirect research cost reimbursement rates, pending a hearing in the ongoing lawsuit filed by several higher education associations and universities.
Judge Allison D. Burroughs of the U.S. District Court for Massachusetts wrote in the brief Wednesday order that the plaintiffs had shown that, without a temporary restraining order, “they will sustain immediate and irreparable injury before there is an opportunity to hear from all parties.”
Plaintiffs include the Association of American Universities, the American Council on Education, the Association of Public and Land-grant Universities and nine individual universities, including Brown, Cornell and Princeton Universities and the Universities of Michigan, Illinois and Rochester. They sued the DOE and department secretary Chris Wright on Monday, three days after the DOE announced its plan.
Department spokespeople didn’t return Inside Higher Ed’s requests for comment Thursday afternoon.
DOE’s plan is to cap the reimbursement rates at 15 percent. Energy grant recipients at colleges and universities currently have an average 30 percent indirect cost rate. The Trump administration has alleged that indirect costs are wasteful spending, although they are extensively audited.
The DOE sends more than $2.5 billion a year to over 300 colleges and universities. Part of that money covers costs indirectly related to research that may support multiple grant-funded projects, including specialized nuclear-rated facilities, computer systems and administrative support costs.
The department’s plan is nearly identical to a plan the National Institutes of Health announced in February, which a judge also blocked.
International students are increasingly looking for affordable destinations and alternative programs rather than give up on study abroad due to increasing costs, a new ApplyBoard survey has shown.
While 77% of surveyed students ranked affordable tuition fees as the most important factor shaping study decisions, only 9% said they planned to defer their studies based on these concerns, according to a recent student survey from ApplyBoard edtech firm.
“Students weren’t planning to wait for things to change,” said ApplyBoard senior communications manager Brooke Kelly: “They’re considering new destinations, adjusting which programs they apply to, and accepting that they have to balance work with study, but they’re still planning to study abroad,” she maintained.
Just over one in four students said they were considering different study destinations than originally planned, with Denmark, Finland, Nigeria and Italy the most popular emerging destinations.
Additionally, 55% of students said they would have to work part-time to afford their study abroad program.
After affordability, came employability (57%), career readiness (49%), high-quality teaching (47%), and program reputation (45%), as factors shaping student decision-making.
With students increasingly thinking about work opportunities, software and civil engineering topped students’ career choices, with nursing as the second most popular field. Tech fields including IT, cybersecurity, and data analysis also showed strong interest.
What’s more, interest in PhD programs saw a 4% rise on the previous year, while over half of students were considering master’s degrees, indicating that students are increasingly prioritising credentials and post-study work opportunities.
[Students are] considering new destinations, adjusting which programs they apply to, and accepting that they have to balance work with study, but they’re still planning to study abroad
Brooke Kelly, ApplyBoard
The study surveyed over 3,500 students from 84 countries, with the most represented countries being Nigeria, Ghana, Canada, Pakistan, Bangladesh and India.
Given its share of international students, it should be noted that China is absent from the top 10 most represented countries.
As students’ priorities shift and currencies fluctuate, “diversity will be key to mitigate against increased volatility and to ensure campuses remain vibrant with students from all around the world,” said Kelly.
Meanwhile, institutions should increase communication about scholarships and financial aid, offer more hybrid learning experiences and highlight programs on different timelines such as accelerated degrees, she advised.
While alternative markets are on the rise, 65% of respondents said they were only interested in studying in one of the six major destinations, with Canada followed by the US, UK, Australia, Germany and Ireland, in order of popularity.
Despite Canada’s international student caps, the largest proportion of students said they were ‘extremely’, ‘very’ or ‘moderately’ interested in the study destination, highlighting its enduring appeal among young people.
While stricter controls on post study work were implemented in Canada last year, in a rare easing of policies, the IRCC recently said that all college graduates would once again be eligible for post study work.
This change, combined with the fact that international students can still be accompanied by their dependants while studying in Canada, is likely to have contributed to it maintaining its attractiveness, according to Kelly.