Tag: costs

  • No One Will Say Why School Lunch Costs Hawaii DOE $9 A Plate – The 74

    No One Will Say Why School Lunch Costs Hawaii DOE $9 A Plate – The 74


    Get stories like this delivered straight to your inbox. Sign up for The 74 Newsletter

    In January, the Department of Education released a shocking number: it now costs nearly $9 to produce a school lunch in Hawaiʻi. Lawmakers and advocates — after they recovered from the sticker shock — responded with a reasonable question: Why are school meals so expensive? 

    Eight months later, the public still doesn’t have an answer. Despite pressure from lawmakers, the department has yet to publish detailed information about why it costs so much to feed students. 

    The department doesn’t share — and may not even collect — campus-level data on how much individual schools are spending on meals. It has provided no breakdown of how much the state spends on items like milk or fresh produce that go into lunches.

    But lawmakers say schools need to explain what’s driving up the costs, especially since the DOE is struggling to make ends meet with its lunch program and has requested an additional $40 million from the Legislature over the past two years on top of the state and federal funds it already receives for its meal program.

    Hawaiʻi law requires the education department to charge families half the cost of producing school meals, although current lunch prices fall far below that threshold. In January, the DOE proposed gradually raising meal prices over the next four years, but state lawmakers stepped in with funds to avoid increasing costs for families.  

    Under the DOE’s proposal, lunch for elementary and middle school students would cost $4.75 by 2028. High schoolers would pay $5 for meals. 

    Breaking Down The Numbers 

    The DOE serves more than 18 million meals every year to students across 258 campuses. This spring, lawmakers set aside roughly $50 million to fund the school meal program over the next two years. 

    The department publishes quarterly financial reports for its food services branch, but the online reports only track the total amount of money coming in and out of the meals program. Through the third quarterof the 2024-25 school year, the program brought in $108 million in student payments and state and federal funds, but spent roughly $123 million on meals, salaries and other expenses.

    In response to a Civil Beat public records request for school and state-level spending on lunches this spring, a representative from the superintendent’s office shared a one-page financial report breaking down the meal program’s spending and revenue in more detail. Roughly 40% of the 2023-24 budget went toward the salaries and benefits of workers, and the department spent roughly $81 million on food. 

    But there was little information explaining what goes into a $9 school meal — for example, how much the department spent on specific ingredients or juice, or what cafeteria supplies cost the department more than $5.6 million in 2024. The department provides more detailed estimates of its purchase of local ingredients in its annual report to the Legislature, but this spending makes up only 5% of the school meal budget.

    In response to Civil Beat’s request, the DOE also said it didn’t have records of schools’ annual financial reports for campus meal programs. The department did not respond to requests for interviews about the availability of school meal data and the rising costs of lunches.

    Jesse Cooke, vice president of investments and analytics at Ulupono Initiative, said he’s concerned about a lack of consistent tracking and reporting from schools. He said he hasn’t seen any data breaking down the costs of meal programs at individual schools on a regular basis, which makes it harder for the department and lawmakers to identify what’s driving up the costs of meals and understand how programs can operate more efficiently. 

    “When you’re trying to make decisions, trying to make something more efficient, you need pretty quick numbers,” Cooke said. “They’re not looking at specific schools and their numbers.”

    The education department has also come under fire from the federal government for its lack of data collection. When Hawaiʻi sought an increase in federal funds for school meals in 2015, officials denied the request because the department wasn’t able to provide enough details on the costs of its lunches, said Daniela Spoto, director of food equity at Hawaiʻi Appleseed Center for Law and Economic Justice. 

    “Historically, the only thing they could provide is what they provided here,” Spoto said. “Here’s our cost, and here’s the total number of meals we provide.” 

    Lawmakers passed two resolutions this spring asking the department to produce a detailed breakdown of its meal programs, including the cost of ingredients, beverages and supplies. The DOE currently has no process of reporting and publishing such costs, the resolutions stated.

    “It is essential to ensure that proper reporting processes are in place to provide transparency as to the costs of producing school meals,” one resolution said. 

    DOE leaders argued they publish enough information to justify rising lunch costs, but they’ve given lawmakers mixed messages on the data that’s readily available. 

    In one hearing, Interim School Food Services Branch Administrator Sue Kirchstein said the DOE already collects and publishes data on the costs of ingredients and other factors going into school meals. But another official said the DOE doesn’t collect data with the level of detail lawmakers were requesting, and the department’s communications team was unable to provide the report Kirchstein mentioned during the hearing. 

    Besides looking at rising inflation rates, the department hadn’t completed a detailed analysis of what’s increasing the costs of meals, former Deputy Superintendent Dean Uchida said in another hearing this spring, drawing strong criticism from lawmakers. 

    “You should be looking at it, and maybe there’s a different way that you can do things,” Sen. Troy Hashimoto said during the hearing. “But you won’t know that unless you do the analysis.” 

    The department has not said if it’s working on a cost analysis for the Legislature. Any report DOE submits to lawmakers won’t be published until late 2025 or early 2026 in the lead-up to the new legislative session. 


    Get stories like these delivered straight to your inbox. Sign up for The 74 Newsletter

    Source link

  • What today’s report on living costs means for students, universities and parents – and policymakers

    What today’s report on living costs means for students, universities and parents – and policymakers

    • HEPI Director, Nick Hillman OBE, takes a look at why today’s landmark report on student maintenance from HEPI, TechnologyOne and the Centre for Research in Social Policy at Loughborough University is so important.
    • Later today, HEPI will be hosting a free webinar with UCAS on this year’s admissions round – see here for details and to register for a free place.

    A recent Wonkhe article by Will Yates of Public First noted, ‘It really was not that long ago that maintenance grants were the norm and student life was cheap and cheerful.’ We probably all know what he means.

    When I went to the University of Manchester 35 years ago, I had no tuition fees and got to collect a grant cheque even though my parents were in secure middle-class jobs. Since then, life has become harder financially for students. Costs have gone up and grants have disappeared (in England). Meanwhile, the student body has diversified to include more people from disadvantaged backgrounds.

    As if battling with the impact of COVID on their secondary schooling was not enough, today’s students face big financial obstacles. During my nine years as a Trustee of the University of Manchester (which sadly came to an end last month), I regularly ascended those same stairs I used to climb to collect my physical grant cheque in order to attend Board meetings at which we would discuss student poverty and its impact.

    Will Yates’s conclusion needs qualifying of course. Just as it is true that there are today many poor pensioners alongside all the well-off ones who have cleaned up thanks to intergenerational inequities, so there have always been some students who struggled to survive on the maintenance support they received. I recently stumbled across the following exchange in Hansard from 1969, for example, on whether parents were making up the income of their student offspring in the way they have long been supposed to:

    Mrs. Shirley Williams: I appreciate that students who do not receive the full parental contribution often suffer hardship. My Department recently wrote to local education authorities asking them to ensure that parents were made aware of the importance of making up the student’s grant. But I do not think it would be desirable or practicable to impose a legal obligation on parents to make their contributions. (Source: Hansard, 30 January 1969)

    Plus ça change… Aside from the reference to local education authorities (which no longer have a role in student maintenance), the answer could have come from pretty much any one of the last seven decades.

    These issues are topical in part because the threshold at which parents are expected to start contributing to their adult student offspring’s living costs has not increased for over 15 years – it was set at £25,000 for England by Gordon Brown (six Prime Ministers ago…). So parents in English households on just over £25,000 a year are expected to cough up – the situation is even worse elsewhere (just over £19,000 in Northern Ireland).

    The recent HEPI / Advance HE Student Academic Experience Survey shows over two-thirds of full-time undergraduates now do paid work during term time, and often at a dangerous number of hours (‘dangerous’ in the sense of impacting their academic work). So what has changed is the proportion of students who feel wickedly under-resourced financially.

    The biggest lie told about students today is that they are pathetic ‘snowflakes’ who melt on contact with real life; in fact, when financially challenged, they tend to confront the problem head on by going out and finding paid work. Norman Tebbit would have been proud.

    While my generation of students were debating or politicking or going to gigs, today’s students are more often serving those who do have the money to go out. In the UPP Foundation / Public First research that Will Yates was writing about, the students said they thought ‘it was them (rather than the university, the government, the OfS or any other body) who took responsibility for ensuring that they could afford to study and socialise.’

    In my view, one of the very best projects we do at HEPI is the HEPI / TechnologyOne Minimum Income Standard. This is completely different to the student money surveys that ask students what their income is and how they spend it. Those are useful but only up to a point because what if the income is not enough? Knowing I have X pounds and spend X pounds is only of modest value if I actually need 2X pounds in order to afford the bus to campus, join my favourite student society and buy personal healthcare items (on this, see HEPI’s recent report by Rose Stephenson on menstruation and learning).

    So the Minimum Income Standard starts with a blank sheet of paper plus a tried-and-tested methodology developed by the Centre for Research in Social Policy at Loughborough University to consider how much students really need to live with dignity – the calculation is not for a plush lifestyle nor a monastic one, but rather for a fairly basic-but-safe one and is based on the extensive experience of the research team as well as detailed focus groups with multiple students around the UK.

    This year, the second such study dwells upon first-year students in Purpose-Built Student Accommodation (university halls and privately-owned student accommodation blocks). So it supplements last year’s study of second and third-years in shared ‘off-street’ housing. (In my view, it should really be called ‘on-street’ housing as it tends to be on normal residential streets, but I digress.)

    While TechnologyOne have generously funded this vitally important work, I must stress that neither they nor HEPI have had any editorial control over the core central numbers, which are entirely Loughborough’s work and based on what students have told them. HEPI’s input has included feeding in supplementary figures for accommodation costs , with the help of Student Crowd and Students, and thinking through the possible policy consequences of the research.

    The top-level finding is that first-year students living in halls need £418 a week – over £20,000 a year and double the maximum maintenance support package in England. Even if a student (in England, living away from home and studying outside London) is in receipt of the maximum maintenance loan, they need to work 20 hours a week throughout the year to earn enough money to hit the Minimum Income Standard. Remember, these are people on full-time courses. As a society, we are now expecting people to do full-time study and half-time paid work and then we wonder why young students struggle to feel a sense of belonging to their institution…

    People should look carefully at the methodology and conclusions to see if they agree with them. As a think tank, our job is to make people think; we can identify the main challenges and propose solutions but we are not a lobby group, so we would never claim we have all the answers. There may be elements of the Minimum Income Standard for Students that people want to pore over, challenge and improve.

    Some of the issues people may want to consider on the back of the MISS include:

    1. As the report makes clear, student life is generally a temporary phase that lasts no more than three or four years. So is it reasonable to apply the same methodology as is used for defining the basic minimum income for someone in work or in retirement? It is valid, in my view, because three years still represents a substantial proportion of a young person’s life up to that point and undergraduate study is often the first period of real independence for people – plus some other phases of life for which the minimum income methodology has been applied are also not always very long term. For example, someone on a ‘living wage’ is likely to hope to rise above it in due course as they gain experience. Besides, in one sense, no phase of life is permanent.
    2. A second important question is whether letting students define their own minimum standard of living via focus groups will always tend towards larger monetary sums. The Minimum Income Standard for Students assumes students are likely to have gym membership, a short UK holiday and other costs (like wireless headphones, a modest alcohol budget and food for takeaways) that some people may deem to be non-essentials or at least not things that should be subsidised by taxpayer-funded income-contingent student loans (though, on the other hand, we only include very small sums for study-related costs). The MISS also includes some costs than some people might deem relevant only to a minority of students (such as paying to store items between terms). But the MISS is about having enough money for every student to live reasonably, with dignity and safety; it is not designed to be a ‘bare minimum’ or to represent the lifestyle of an ascetic. This is one of a number of reasons, further explored below, why we studiously avoid ever saying we think the Government should automatically set the maximum maintenance package at exactly (or even roughly) the level of the MISS. Moreover, students are not spendthrift – one interesting change this year compared to last, for example, is that they no longer deem a TV Licence as a must-have item so it has been removed from the calculation.
    3. What we call a ‘minimum’ is also an ’average’; some cities are notably more expensive than others – London aside, we generally ignore this in the calculation and so the MISS might look too high or too low depending on where someone is studying and their own personal circumstances. For example, this means some of the freebies – such as prescriptions and bus travel – enjoyed by many Scottish students are ignored.
    4. Should we be looking to reduce costs by giving applicants and students better information? A modest amount of the first-year premium (the extra costs that first-years seem to accrue) comes from being unused to budgeting and feeding themselves. The MISS for first-year students even includes a small additional sum for the first 12 weeks while students settle down and get used to things like eating up food before it goes off. Would better information of the students are crying out for fix at least some of the need for this? Similarly, would better information on the different consequences of different accommodation preferences shape better decisions, which in turn could shape the supply of student accommodation, and lead to a reduction in the MISS?
    5. One particular policy challenge is explaining how any extra student maintenance support that could be offered now or later is likely to be spent in practice. Ministers will be less likely to give students improved maintenance packages if they think they will be entirely swallowed up by higher rent levels. One real challenge here, as so often, is that student accommodation tends to fall through the cracks in Whitehall, so it is not always clear who should be approached for these conversations.

    Above all, HEPI is a policy body so for us the key question is always: what are the possible policy ramifications? On this, and notwithstanding the important fact that the report gives a clear indication of a preferred direction of travel, we are still working them out.

    For example, the report concludes that the maximum maintenance package is only half of what students need to live. It clearly needs to be higher and available to more people. It would be absurd (literally absurd) to think parents could easily fill in the gap from their take-home pay unless they are on very good salaries indeed. It is similarly absurd, however, to think the Government can easily fill the whole gap, given the fiscal situation and the much larger number of students than in the past.

    So what level of paid employment is it reasonable to assume students might do (and in holidays or term-time or both)? Or should students opt for a more basic standard of living (no en suite perhaps or more shared rooms, as in the United States)? Or should more students live at home as commuter students but at the cost of experiencing a full traditional student experience? These are difficult questions and, again, the answers will be different in different cases. Nonetheless, we welcome all thoughts in response.

    As I sometimes say when speaking in schools, if and when it comes to my own children going to higher education, I will tell them three things:

    1. good social spaces are more important than things like en suite facilities – if you are living a full student lifestyle, you may spend less time in your room than you originally expected;
    2. taking a temporary full-time job in the holidays is generally preferable to doing a high number of hours of paid employment during term time, if you’re lucky enough to have the choice; and
    3. in general, it tends to be better not to be a commuter student, unless there are specific individual reasons for being one.

    Yet like most parents, I will also have to accept they will take what I say with a large pinch of salt and then find their own way.

    Source link

  • The maintenance loan now covers only half of students’ costs

    The maintenance loan now covers only half of students’ costs

    I’m in two minds over whether it was a curse or a blessing – and I may be retrospectively overstating its impact.

    But when I sat down to watch a bit of telly back on Tuesday 13th May 2003, I had no real sense of the extent to which it would end up causing me lost sleep over silos.

    The Day Britain Stopped was a BBC1 docudrama, set in the near future, that explored how a devastating chain of events could leave the country completely paralysed.

    First, a national rail strike pushes huge volumes of passengers and freight onto the roads, overwhelming the motorway network.

    Then the M25 becomes jammed after multiple accidents, including one on the Dartford Crossing. Poor coordination between highways management, police, and emergency services slows response times, and conflicting rerouting decisions worsen the congestion, leaving rescue crews unable to reach incidents.

    Then severe delays ripple through the air transport system, compounded by diverted flights and congested airports. And these all lead to a mid-air collision between two aircraft near Heathrow – killing hundreds – as communication and coordination systems fail under strain.

    Gridlock

    I was thinking about The Day Britain Stopped on a campus a few weeks ago. Student leaders were explaining a proposal from their university to take 30 ECTS credits or so of most degrees (ie a semester) and turn them into a compulsory placement.

    A “mini sandwich” is not, all things considered, a terrible idea. Students would gain valuable work experience – which we know helps with graduate outcomes – and in aggregate there would end up being a moderate reduction in teaching and assessment costs.

    But on the assumption that it would often be unpaid, given the maximum maintenance loan is now significantly below the National Minimum Wage (when chunked out at 30 weeks for 35 hours a week), working full-time for a semester would pretty much prohibit students from earning the extra that many need to now.

    Just like the two teams each re-routing traffic down the same country lanes around the M25, it’s a classic case of not seeing the full picture – and when combined with the HE sector’s preference for policy over scenario planning, potentially disastrous. But nothing like that could be coming in the year ahead, surely?

    Britain’s best days are ahead

    This does nothing for my doom-mongering street cred, but back in May 2024 – when HEPI and TechnologyOne published work from Loughborough University on a Minimum Income for Students (MIS) – I allowed myself a little optimism.

    In a sea of information that seemed to be designed to entice participation rather than be realistic about the costs of it, I imagined that the headline figure – that students need £18,632 per year outside of London to achieve a baseline student experience – would start to adorn .ac.uk cost of living webpages offering budgeting advice to students.

    Given the methodology for calculating the MIS was close to that used by the Living Wage Foundation, and given the Westminster government’s intent to ask the Low Pay Commission to (to all intents and purposes) replicate that methodology for the National Living Wage, I even allowed myself to imagine for a few moments that government might commit to closing the gap between available support and liveable income. It surely wouldn’t be committed to a liveable income for work but not one for study?

    Alas, it wasn’t to be. Vanishingly few of the universities that offer “typical” or “sample” student budgets quote anything like that figure – and that’s if they offer one at all. International students are still misled into thinking that the maximum maintenance loan will cover their costs, parents are still completely in the dark about what they’ll really need to contribute, and many of the survival stories that I’m told by new student leaders every summer have gone from amusing to heartbreaking.

    The MIS report even recommended that when students apply to higher education, UCAS could compare the support available from the student’s home UK nation with their expected living costs. But at the time of writing, the admissions service’s webpage on budgeting instead offers “average” spend figures from 2020, and somehow omits the £2,110 that the source study found students spending when preparing for higher education.

    Governments, meanwhile, did little. This coming September, Scotland is offering up a freeze (real terms cut) on maintenance support, Northern Ireland has an increase that still falls significantly short, and both Wales and England are increasing the maximum by 3.1 per cent. A frozen means test threshold means even fewer will get that max in England – and right now both RPI inflation and CPI inflation are in fact running at 4.1 per cent.

    Update: It’s all worse

    As such, if last year’s report was like a warming sign, the 2025 update to the MIS report ought to be like a fire alarm. The update expands on the 2024 research by examining first-year students and those living in halls for the first time – and through focus groups across five UK cities, researchers found that first-year students face the highest costs of any student group – £418 per week including rent to reach a minimum acceptable standard of living.

    This represents a “first-year premium” of around £14-20 more per week than continuing students, driven by both “setting-up” costs (laptops, kitchen equipment, bedding) and “settling-in” costs (freshers week activities, food wastage while learning to budget, and higher social spending to establish friendships).

    The financial pressure on students has intensified dramatically across all UK nations. In England, even students receiving maximum maintenance support can only cover half (50 per cent) of their actual living costs, forcing them to work over 20 hours per week at minimum wage to make ends meet.

    That, I add in passing, is 20 hours more a week than most politicians’ alma mater allows students to work to have a fulfilling student experience:

    Studying at Oxford is an exciting experience with plenty of opportunities and a high number of contact hours. For this reason, paid term-time employment is not permitted except under exceptional circumstances and in consultation with your Tutor and the Senior Tutor.

    Students from different UK nations face different circumstances – Welsh students have 63 per cent of their costs covered by maintenance support, while those from Northern Ireland receive support covering just 42 per cent of their needs. The gap between what students need and what they receive has created what the researchers term a “hidden parental contribution” – one that now exceeds £10,000 annually for English families.

    I still regularly encounter those who expect to see mass dropouts as a result of the growing gap – but anyone that works closely with students will tell you that it’s a slow participation implosion that we’re seeing rather than a non-continuation explosion.

    Two-thirds of students now work during term time, the highest on record – pressure that is squeezing out various aspects of university life, as students report less time for independent study, fewer opportunities to join activities, and increased commuting distances. Many are experiencing a fundamentally different university experience than they expected, with a third having less disposable income than planned, and 1 in 5 buying fewer books or course materials.

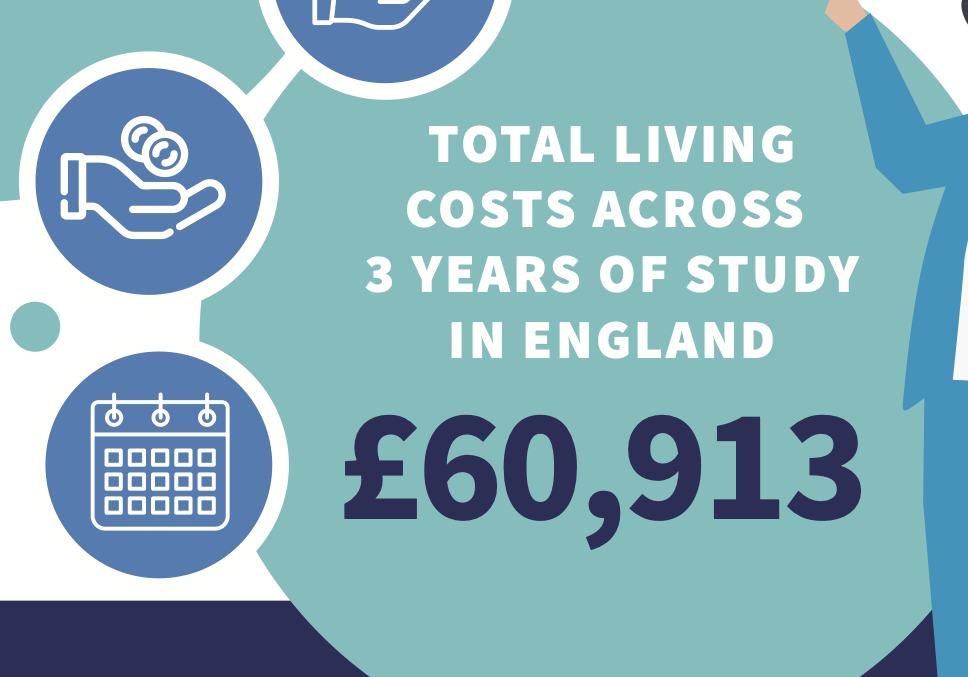
    Over a three-year degree, the total cost of reaching minimum living standards ranges from approximately £59,000 in Wales to £77,000 in London, excluding tuition fees. And these figures are what students need not for luxury, but simply to participate fully in university life with dignity. Even living in accommodation that is “purpose built” for students, while providing important social opportunities, is typically more expensive than shared private housing – with rent making up to 47 per cent of total living costs in London.

    Thanks to Terry Nutkins, Gordon Banks and Let Loose

    One particularly pleasing aspect of the report is the “surprising” costs that so many miss when casting round the marcomms office for a couple of student ambassadors to cobble up a budget.

    Practical necessities include storage costs between academic years when halls contracts end, insurance for phones and laptops used outside accommodation, and mattress protectors for the “really cheap and uncomfortable” beds typically provided.

    First-year students face particular financial pressures during their settling-in period, wasting money on food while learning to shop and cook independently, plus ongoing laundry costs in halls that can reach £5 weekly for basic washing needs.

    Academic periods bring additional expenses, from extra food costs during exam sessions when students spend long hours in libraries, to transport costs for third-year students attending job interviews and graduate recruitment events.

    Basic costs related to social participation and mental health are also included. They include individual crockery and cutlery in halls to avoid hygiene issues when sharing with strangers, a £20 (!) annual personalisation budget for room decoration that prevents students feeling like they’re “in prison,” and £50 annually for clothing required for university social events and society activities.

    They are seemingly minor expenses – but they all add up, and they highlight how the “minimum” standard isn’t about luxury, but about enabling students to participate fully in university life, maintain their mental health, and avoid social exclusion.

    There’s also dehumidifier packs to combat poor ventilation and condensation from drying clothes, tabletop ironing boards to fit cramped spaces, and overdoor hooks because standard furniture is insufficient for storing belongings across shared living arrangements.

    Technical necessities include extension leads for inadequate electrical outlets and Wi-Fi boosters for poor connectivity, while protective measures like upholstery and carpet cleaners become crucial for avoiding deposit losses. Even basic items like door mats for communal cleanliness and shower caddies for bathroom storage represent additional shared costs when five people live together.

    Beyond accommodation, students face numerous individual costs related to campus life and practical necessities that all accumulate quickly. They include water bottles and Tupperware containers for daily campus use and food storage, delivery and returns costs reflecting modern shopping patterns, and small airers for bedroom clothes drying when shared facilities are limited.

    Admin costs like provisional driving licences at £34 become the most practical form of student ID, cheaper and more portable than passports. And there’s eye tests every two years with potential glasses purchases, and a small budget for everyday medicines and a couple of prescriptions annually – along with significant variations in personal care costs, the report particularly noting “the higher cost of hairdressing for afro hair in particular,” while emphasising that regular haircuts are deemed essential for being “presentable” and maintaining “self-respect”. Luxuries these are not.

    Parental contribution

    The report repeats last year’s calls for urgent, system-wide reform based on five principles: simplicity, transparency, independence, sufficiency, and fiscal neutrality. Key recommendations include increasing maintenance support so students can reach minimum living standards through a combination of government support and reasonable part-time work, providing a “first-year boost” to help new students establish themselves, and raising parental contribution thresholds so families only contribute when they themselves have achieved minimum living standards.

    The researchers argue reforms could be implemented without additional government spending – although the proposal is to reintroduce much-maligned but fairly progressive real interest rates on student loans, ensuring those who benefit most from higher education contribute accordingly. Sadly, they’re usually the loudest too.

    Without reforms, they warn of three critical risks – increasingly unequal access to higher education, declining quality of student experience, and threats to sector sustainability as students struggle to afford university attendance.

    But forgive me for the doom. Any or all of that will have to wait until at least September 2026, and even then is looking increasingly unlikely, given that the Treasury is said to be staring at a £41bn hole in its budget, and is currently borrowing the money on the bond markets to lend to students at an interest rate of 4.5 per cent – a far cry from 0.5 per cent nine years ago.

    And it could all be about to get much much worse.

    Basket cases

    Whether you use RPI or CPI is almost immaterial – it’s the basket of goods that matters, and neither basket captures the basket of a student typified in the MIS. Students spend more on food than the average consumer, and in that basket they’re less able to “trade down” through the brands.

    The Bank of England expects food inflation to be around 5 per cent Q3, rising to 5.5 per cent by the end of the year – higher global commodity prices, higher labour costs and Extended Producer Responsibility regulations that come into effect from October of this year all driving the change.

    In June, Beef and Butter were up at 20 per cent, Coffee was at 12.5 per cent and Chocolate was running at 16 per cent. Decent rent data is hard to come by – but it always seems to increase by more than inflation. If not included in their rent, energy prices have shifted from being a drag on inflation to providing a boost – Ofgem’s price cap for households is £1,720 for July-September 2025, almost 10 per cent higher than the same period last year.

    And the BoE’s key mitigation measure – to cut the Bank Rate by 0.25 percentage points to 4 per cent at its August meeting – might be helping students’ landlords, but it won’t be impacting student budgets.

    Meanwhile, if students have been steadily increasing their term-time work (both in numbers of students and hours worked), that could be a coming problem too. Employment growth has stagnated, and job vacancies have fallen significantly. And while two-thirds of students say they’ve been in work during term time, 89 per cent of applicants are now expecting to find work – rising to 93 per cent of care leavers, 94 per cent of international students and 96 per cent of estranged students.

    Either there’s lots of spare jobs going, or the UK may be about to run out of part-time work for students. That’s a problem few will see coming, will be almost certainly be worse in some cities than in others, and would be exacerbated if the usual ratio of students spending in businesses v those working in those businesses shifts significantly – both having grown gently in tandem as student numbers have grown. The need to convert more jobs on campus to those that students can do has never been greater – even if they sound like the first to have gone as teams have contracted in recent years.

    Some will find work that’s further and further away from campus, some will find work that’s more and more punishing on them both mentally and physically, and some simply won’t find it at all. Many – like the international student leader I met last week – will find themselves working for less than minimum wage just to pay their fees, in a country that couldn’t seem less interested in those sorts of labour market abuses if it tried.

    God forbid a student has a setback, an accident or a costly health problem. Or happens to be a student in a year when if nothing else, there will be major and un-modelled impacts on student housing supply as a result of dramatic reforms to the way that an already scandalously poor rental market is regulated.

    Implosions v explosions

    Maybe a crisis is coming – the classic unplanned-for crisis of the sort in The Day Britain Stopped, when various factors conspire in a single period to multiply each other into something that few saw coming. But even if it isn’t an explosion and we see non-continuation rates fall off a cliff, we can see what’s coming – students choosing to stay at home just as their local university closes courses, students choosing against the extracurriculars that would make up for the skills their course supplies but are no longer needed.

    Students breathing in the spores of black mould as they literally choose between heating, and eating.

    In the 2024 MIS report, the authors warned against any increases to maintenance support that would come at the cost of lower participation in higher education, “for example if an increase could only be paid for by capping the number of students who can study in higher education”. The kneejerk makes sense – neither governments, universities nor students are ever keen on measures that might limit opportunity.

    But offering students a loan that only covers half of their basic living costs, and then asking them to work a minimum 20 hours a week during term-time isn’t “opportunity”, it’s a scam – one that sells “student life” but for those on low incomes offers the kind of experience associated with labour market outcomes they’re less likely to achieve anyway, and one that allows lots of people to pat themselves on the participation back while plunging unsuspecting students into poverty.

    If the country really can’t afford mass participation in higher education, and students can’t afford to be students, the only morally right thing to do is admit it. And if telling students they need £21,126 per year to live on might put some of them off, then maybe it should.

    Source link

  • Universities Sue, Judge Blocks DOD’s Indirect Costs Cap

    Universities Sue, Judge Blocks DOD’s Indirect Costs Cap

    Johns Hopkins, Arizona State and Cornell Universities are among a coalition of 12 higher education institutions and three trade groups that filed a lawsuit against the Department of Defense on Monday over the agency’s plan to cap universities’ indirect research cost rates at 15 percent. 

    While DOD secretary Pete Hegseth said in a memo last month that the policy is aimed at “accountability” and rooting out “waste,” the lawsuit argues that slashing indirect costs rates “will stop critical research in its tracks, lead to layoffs and cutbacks at universities across the country, badly undermine scientific research at United States universities, and erode our nation’s enviable status as a global leader in scientific research and innovation.”

    On Tuesday, a federal judge in Boston issued a temporary restraining order, prohibiting the DOD from enacting the cap. A hearing in the case is set for July 2. 

    The litigation filed this week is the latest legal challenge universities and their advocates have mounted against the federal government’s attempts to cap the amount of money it gives universities for the indirect costs of conducting federally funded research. The National Institutes of Health, the National Science Foundation and the Department of Energy have all attempted to unilaterally enact similar caps, and federal judges have blocked those efforts for now

    For decades, universities have periodically negotiated with the federal government to calculate bespoke indirect cost reimbursement rates to pay for research costs that support multiple grant-funded projects, such as facilities maintenance, specialized equipment and administrative personnel. Universities factor those rates into their institutional budgets.

    For example, Johns Hopkins and the DOD currently have in place a negotiated indirect cost rate of 55 percent. In 2024 JHU received $32 million from the DOD to cover indirect costs, according to the lawsuit. If the DOD’s plan moves forward, however, the university would lose $22 million. 

    Source link

  • Minnesota college leaders eye tuition hikes as costs rise and state funding flatlines

    Minnesota college leaders eye tuition hikes as costs rise and state funding flatlines

    This audio is auto-generated. Please let us know if you have feedback.

    Dive Brief:

    • Minnesota’s public colleges could institute substantial tuition spikes in the next academic year, after state officials have so far failed to meet funding requests. 
    • College officials’ latest projections estimate students could see price increases ranging from 4% to 9.9% to offset budget gaps, according to a presentation at a Minnesota State system board of trustees meeting this week. Most colleges and universities are modeling an increase of 8%. 
    • Those proposed increases come as analysis from the Minneapolis Federal Reserve showed enrollment in public Minnesota colleges increased substantially in the 2024-25 academic year — up 12% at two-year institutions and 4% at four-year institutions.

    Dive Insight:

    Leaders at public institutions in Minnesota are having to grapple with state funding that will likely remain flat while inflation continues lifting costs for college operations. 

    Minnesota State Board of Trustees, which oversees 33 institutions, requested $465 million in new funding in the state budget covering fiscal 2026 and 2027. 

    But so far, state executive and House budget proposals include no funding increases for the system, said Bill Maki, vice chancellor of finance and facilities for the Minnesota State system, during Tuesday’s presentation. He noted that the state Senate offered additional funding but only a fraction of what was asked for — $100 million.

    The muted proposals from the state — which is facing its own fiscal shortfalls — would leave colleges on their own in filling budget gaps created by increasing costs and financial needs, such as maintenance backlogs. 

    Modest tuition increases would still leave substantial structural deficits, Maki noted. A system-wide tuition increase of 3.5% would still leave a $65.1 million budget shortfall in fiscal 2026. Even a 9% tuition hike would mean a $23.8 million gap. 

    Regardless of what level of tuition increase may be approved by the board, every one of our colleges and universities is going to have to implement budget reallocations and reductions in order to cover inflationary costs,” Maki said. 

    Complicating things, as the chancellor pointed out, is that institutions have to set tuition rates before they fully know their costs for the year. 

    To date, the Minnesota State system has remained relatively strong financially. The system’s operating revenues increased in fiscal years 2024 and 2023, according to its latest financial statement. It ended fiscal 2024 with total revenues of $2.3 billion and a surplus of $108.9 million. 

    Helping the system’s finances is the support it has received from the state. In 2024-25, tuition accounted for about 30% of the Minnesota State system’s revenue, compared to 42% made up by state appropriations. 

    And the state’s public colleges have beaten the nationwide trend of declining enrollment, reporting student growth in recent years.

    Minnesota’s enrollment growth brought the state just short of its pre-pandemic levels in 2019, according to the Minneapolis Fed’s analysis. 

    The state’s enrollment upticks in 2024 and 2023 also break a decade of decline in Minnesota and many of its neighboring states.

    In explaining the state’s enrollment growth, the Fed’s analysis pointed in part to Minnesota’s recently implemented North Star Promise. The program offers free tuition to students whose families make under $80,000 — a boon to enrollment and educational access but not necessarily to colleges’ coffers.

    Source link

  • Federal judge freezes Energy Department’s 15% cap on indirect costs

    Federal judge freezes Energy Department’s 15% cap on indirect costs

    This audio is auto-generated. Please let us know if you have feedback.

    A federal judge Wednesday temporarily blocked the U.S. Department of Energy from implementing a 15% cap on grant funding for indirect costs. The ruling came just days after a dozen higher education associations and colleges sued the department, calling the new policy an overstep of authority and a threat to U.S. research and advancement.

    In the ruling Wednesday, U.S. District Judge Allison Burroughs said the plaintiffs — including higher ed groups like the American Council on Education and threatened colleges like the University of Michigan and Brown University — had successfully demonstrated that they would “sustain immediate and irreparable injury” if the policy were allowed to proceed in tandem with the lawsuit. 

    Burroughs’ temporary restraining order bars the Energy Department — until further court order — from terminating grants, either under the challenged policy or “based on a grantee’s refusal to accept an indirect cost rate less than their negotiated rate.” The judge is also requiring the department to submit biweekly reports confirming that the federal funds are being distributed during the pause.

    When announcing the funding cap last Friday, the Energy Department said the move would save $405 million annually and reduce what it called inefficient spending. Indirect research costs typically include overhead expenses such as facilities and administrative support staff.

    The department said the change would affect over 300 colleges and that it would terminate grants to any institutions that failed to comply.

    But the plaintiffs said the policy’s rapid implementation would give institutions no choice but to scale back funding and lay off staff.

    Their lawsuit, filed in U.S. District Court in Massachusetts, called the Energy Department’s policy “a virtual carbon copy” of one announced in February by the National Institutes of Health. A federal judge permanently blocked NIH’s plan to cap indirect cost funding at 15% earlier this month, a decision the agency quickly appealed. The NIH plan would cost research universities billions in annual funding.

    “DOE’s action is unlawful for most of the same reasons and, indeed, it is especially egregious because DOE has not even attempted to address many of the flaws the district court found with NIH’s unlawful policy,” the plaintiff’s lawsuit said.

    The next hearing in the case is set for April 28 before the same court. 

    Source link

  • The five things universities do to cut costs

    The five things universities do to cut costs

    Incoming Office for Students chair Edward Peck would have expected that many of the questions he would face at his pre-appointment Education Committee hearing would concern the precarious financial situations that are the reality at many higher education institutions.

    His answer to this line of inquiry was instructive. As a part of an urgent briefing with the current chief executive he would want to know:

    the extent to which those universities have done all the things you do as an organisation when you face financial pressures. There are five or six things that you routinely do. To what extent have they been done by those organisations? To what extent is the financial pressure they are facing particularly acute because they have not yet got through all the cost reduction measures that would have enabled them to balance income with expenditure?

    To many with an interest in universities – as places to study, as employers, as local anchor institutions – this idea of “five or six things” would have been confusing and opaque. Is there really a commonly understood playbook for institutions facing financial peril? If there is, why would there be any doubt as to whether senior leaders were following these well-worn tracks to safety? If there genuinely is a pre-packaged solution to universities running out of money, why do so many find themselves in precarious financial situations?

    It would help to take each of these “five or six things” (I’m going to go with five) in turn.

    1. Size and shape

    If your university is smaller than expected in terms of students or income this year, the chances are it has been this size before.

    The sector has grown enormously over the last few years, and the way that funding incentives currently work (both in terms of boom and bust in international recruitment, and the demise – in England – of the old HEFCE tolerance band) has meant that the expansion needed to teach more students, run more estate, or conduct more research has had to happen quickly – taking action when the money and need is there, rather than as a part of a long term plan.

    Piecemeal expansion suffers when compared against strategic growth in that the kinds of efficiencies that a more considered approach offers are simply not available. Planned growth allows you to build capacity in a strategic way, in ways that take into account the wider pressures the institution is facing, the direction it wants to head, or plans for long term sustainability.

    Often senior leaders look back to the resources needed in previous years for a similar cohort or workload in determining costs at a subject area or service level of granularity. If we could teach x undergraduates with y academic staff and z additional resources in 2015–16, why do we need more now? – that’s the question.

    It’s a fair question – but it is a starting point, not a fully formed strategic plan for change. You may need more resources because there is more or different work to do – perhaps your current crop of academics are bringing in research contracts that need specialist support, perhaps the module choices available to undergraduates are more expansive, perhaps the students you are currently recruiting have different support needs. There’s any number of reasons why 2024-25 is not a repeat of 2015-16, and the act of comparison is the start of the conversation that might help unpack some of these a bit.

    2. Pausing and reprofiling

    Imagine that at your university the last few rounds of the national student survey have seen students increasingly bring up the issue of a lack of library capacity as a problem. In response, the initial plan was to increase this capacity – an extension to the existing building paid for with borrowing, refurbishment and update of the rest of the building, and more money for digital resources.

    A sound plan, but three years of lower than expected recruitment, declining income elsewhere, and an increased cost of doing business (construction costs are way up, for example) mean that the idea of putting the plan into action is keeping the director of finance up at night. It may be a necessary improvement, but it is no longer affordable.

    In other words some or all of this valuable work isn’t going to happen this year, as things stand. One decision might be to redesign the project – perhaps covering some of the refurbishment and the content subscriptions but not the new build (and thus not the new borrowing). Even these elements would still have a cost, and with no new finance this would be coming out of recurrent funds. And there’s not as much available as there used to be.

    So the other end of this point is reprofiling existing debt. For even a moderately leveraged university the repayment of capital and interest (under 6 per cent is pretty decent for new borrowing these days) takes up a fair chunk of available recurrent funding each year. If you are able to renegotiate your repayments – extending the loan term perhaps, or offering additional covenants, or both – this frees up recurrent funding to meet other needs.

    Both of these solutions are temporary ones – one day that library will need sorting out, and paying less of your loan back now inevitably means paying more back later. But sometimes suboptimal solutions are all that are available.

    3. Bringing things together

    There may well be cases where the same thing is being done in multiple ways, by multiple teams, across a single institution. There might be benefits in every faculty having an admissions team and a research manager, but in a time of financial constraint you have to ask whether a central team might be more efficient – and whether this efficiency is more important than the benefits being realised from the current configuration.

    Again – the calculus here differs from institution to institution. Where faculty autonomy is the norm, it may be that benefits are being realised that the centre doesn’t know exist, much less understand. As I am sure is becoming increasingly clear, questions like these are the start of a conversation – not the end. Even if in bald resource terms centralisation is a saving, you may not be taking all of the variables into account.

    Conversely, where there are clear savings and no meaningful reduction in benefits you are still entering into a course of action that could prove hugely disruptive to individual staff members. For some, your plan may represent a long hoped for chance for progression or role redesign – for others it may be the push that means that their years of experience are lost to the university as they retire or move to another role. With campus redundancies in the news each week, staff are rightly suspicious of change – bringing people along with new structures requires a huge investment of time and effort in communication, consultation, and flexibility.

    4. Focus

    There are many, many more effective ways to run a surplus than being a university. The converse of this is that people who run universities probably have non-financial reasons to want to run universities rather than running something else. In some of the wilder us-versus-them framings of campus industrial relations we can lose sight of the fact that pretty much everyone involved wants a university to keep on being a university, despite the benefits that would come alongside a sudden pivot into, say, rare earth metal extraction or marketing generative AI.

    That’s an admittedly flippant expression of something that is often forgotten in university strategising. We all have our reasons to be there. Expressing these is often the start of understanding which are the things a particular university does that are non-negotiably essential, and which are the things we do that are either generating income to subsidise these, or facilitating these things being done.

    If there is something that a university is doing that is non-essential, is not helping essential activity to get done, and it is not generating income to subsidise the things that are essential, why is it being done at all?

    Of course, this presupposes that everyone agrees on what activity fits into each category. Even posing the question can be painful. Once again, we are at the very beginning of a journey that probably took up a large part of governance and management meetings over the past few years.

    5. Addressing underperformance

    A couple of years ago, my party trick at conferences involving senior university staff was to show them my “fake subject TEF”. Confronted with a by subject analysis of student progression and satisfaction at their own provider, many of the staff I talked to would give me a similar answer – and it started “ah, I know why that is…”

    The problems our universities face are already known to those who work there. External datapoints only confirm things that are pretty well understood, and usually confirm an instinct to act on them sooner rather than later – a reason why OfS investigations have tended to find the smoking guns already put beyond use by the time they get on campus.

    If the problems within your institution are less obvious, a well-judged comparison with a competitor could help make things clear. A lot of the data you might want to play with is closely guarded, but there are ways in which you might use HESA’s public data to make a start (my tips – Student table 37, Staff table 11, Finance table 8). Otherwise, your staff will have a rich experience of working at other universities – what are the key differences. What is special about the way your place does things – and are there ways you can learn from the way things are done elsewhere.

    Bring to the boil and mix well

    If you are a university governor hoping for the mythical playbook, I can only apologise. If there was an easy way to make university books balance, we wouldn’t be where we are now.

    What is on offer is the hard choices and difficult conversations that will very often lead to arguments, mistrust, and conspiracy theories. At boards and councils up and down the UK, variations on the above conversations are at the root of everything you feel is going wrong on campus.

    You’ll be learning just how good your senior executive and governors actually are at running large, complex, beautiful organisations like universities. Parts of the university you may never have given a second thought to – the planning team, the finance department, the data analysis directorate, internal audit, procurement – will be coming up with ever more ingenious ways to make savings while preserving the university as a whole.

    Source link

  • College costs have grown, but so has the return (opinion)

    College costs have grown, but so has the return (opinion)

    FG Trade Latin/E+/Getty Images

    What’s the biggest problem facing college students today? Cost is a big concern, of course, for good reason. But many would point to something equally troubling—misperceptions about the value of college degrees. That’s no surprise when reasonable questions are raised about whether graduates are job-ready—and if too many jobs unnecessarily require diplomas.

    There has long been a paper ceiling that penalizes applicants who lack degrees. And more companies are now taking a closer look at so-called STARs—people Skilled Through Alternative Routes.

    The group Tear the Paper Ceiling says that 61 percent of Black workers, 55 percent of Hispanic workers, 66 percent of rural workers and 62 percent of veterans are considered STARs. They have learned valuable work skills through military service, certificate programs, on-the-job training and boot camps. But too often, they’ve been shut out unfairly.

    I applaud the work of this national group and their partners. The equity barriers to jobs are real. Only half of working-age people have a quality degree or other credential beyond high school, even as millions of jobs go unfilled in part because applicants lack the required background or credentials. It only makes sense to make sure we’re not leaving behind talented but uncredentialed neighbors.

    But to take a deeper look is to understand this isn’t only about expanding opportunity and filling today’s open jobs, but the jobs that an increasingly tech-driven, interconnected world will demand in coming years. Skills-based hiring is a good idea, but it won’t on its own come close to solving the nation’s human talent crisis. Increasing higher educational attainment by making sure many more people get better credentials—credentials of value—is the key.

    Foundation of Growth

    Higher education has always been about producing graduates who are ready to start careers, not just jobs. This matters because a person who is a good applicant for a position now could face challenges moving to better and higher-paying positions because they lack the foundation for career growth fostered in postsecondary programs.

    The American Association of Colleges and Universities has surveyed executives and hiring managers eight times since 2006. The most recent survey, from 2023, found that 80 percent of employers strongly or somewhat agree that college prepares people for success in the workforce. Getting a degree is certainly worth the time and money, respondents suggested, as the survey “found a strong correlation between the outcomes of a liberal education and the knowledge and skills employers view as essential for success in entry-level jobs and for advancement in their companies.”

    There will always be conflicting data points in times of change. For example, the push for skills-based hiring, including at the federal level, is opening doors to a broader array of good jobs that historically required a college degree. However, research by Harvard Business School and the Burning Glass Institute shows that college graduates still have an advantage when it comes to getting jobs with higher salaries and better benefits.

    It turns out that employers aren’t committing to skills-based hiring at the level that recent headlines might suggest. The Harvard–Burning Glass report tracked more than 11,000 jobs where a bachelor’s degree was no longer required in the job description. It found only a 3.5-percentage-point increase in the share of non-degree-holders hired into those roles—a decidedly underwhelming number suggesting the buzz about skills-based hiring may be more hype than trend.

    The Lifelong Payoff

    This and other signs reinforce the enduring value of degrees: A recent report from Georgetown University’s Center on Education and the Workforce found that 72 percent of jobs in the United States will require post–high school education or training by the year 2031. The center also found:

    • People with bachelor’s degrees earn, on average, $1.2 million more over their lifetime than those with only a high school education.
    • Of the 18.5 million annual job openings we expect in the coming years, more than two-thirds will require at least some college education.
    • Earnings for people without degrees have been growing over the past decade, but so has pay for degree holders. Even as people without degrees earn more, they are still not catching up with those with diplomas.

    Durable Skills Matter

    Employers often say they’re looking for “durable” skills, such as critical thinking, communication and problem-solving.

    Someone looking to hire an entry-level software developer might consider a candidate with skills in Python or other programming languages developed through informal learning. Many gifted techies are self-taught or developed skills through coding boot camps or working at start-ups, for example.

    But a college graduate with similar skills might stand out because of their experience working in groups to complete projects, their communication and presentation skills, analytical thinking, and other traits fostered in college classes.

    The catch: Across the board, we need better definitions of what our credentials mean. What defines a credential of value, exactly, and how do we make sure that the people obtaining credentials can do the work of the future?

    Certainly, our fast-moving, tech-driven economy increasingly rewards nimble problem-solvers. According to the World Economic Forum’s 2023 Future of Jobs report, employers estimate that 44 percent of workers’ skills will be disrupted in the next five years.

    “Cognitive skills are reported to be growing in importance most quickly, reflecting the increasing importance of complex problem-solving in the workplace,” the report said. “Surveyed businesses report creative thinking to be growing in importance slightly more rapidly than analytical thinking.”

    There are many implications to this change. Embedded in the education pay premium is a fairness issue when it comes to who goes to college and how we support them. The Georgetown center has long reported on the value of a college degree and the persistent opportunity gaps for women and people of color.

    The Change-Ready Nation

    Whatever the impact of skills-based hiring on the nation’s labor shortage, we shouldn’t stop there. Addressing the long-standing inequities in higher education and the workforce means ensuring that these skills-based pathways include opportunities for all workers, especially when it comes to pursuing further education and training even after they enter the workforce.

    Skills-based hiring and the push for increasing attainment aren’t countervailing forces. They’re aimed at ensuring that the nation grows and applies the talent it needs to be prepared for the human work of the 21st century, and to achieve the civic and economic benefits that people with good-paying jobs bring to their communities.

    In the end, this is about more than the job readiness of our students. We’re talking about the change readiness of our entire nation in a rapidly evolving economy. It makes sense to revamp job requirements to meet workforce demands, but there’s no denying we’ll need the best-educated country we can build if we’re going to deliver opportunity and economic prosperity fairly for everyone.

    Source link

  • Understanding Digital Marketing Strategy and Costs to Effectively Budget for Growth

    Understanding Digital Marketing Strategy and Costs to Effectively Budget for Growth

    In today’s digital-first world, higher education institutions are increasingly turning to digital marketing to educate, engage, enroll, and retain students. However, one of the key challenges that the campus decision-makers face is understanding the potential costs associated with digital marketing and how to effectively budget for growth.

    As someone deeply immersed in the world of digital strategy, I often find myself having the same conversation with campus leaders: how do we set realistic expectations about what it really costs to do effective digital marketing? And more importantly, how do we directly link those costs with your institution’s growth objectives? In this blog, I will highlight the key data-driven strategies for assessing ROI and how these strategies inform a strategic budget plan that strengthens your institution’s overall portfolio and drives sustainable growth.

    The importance of setting realistic expectations

    Success in higher education landscape, particularly when managing a large portfolio, is driven by a disciplined, metrics-oriented approach. From my experience, the institutions that excel are those that rely on crisp numbers, rigorously evaluate their plans ahead of time, and understand the value of projections and estimations. By leveraging detailed forecasts and aligning resources accordingly, we can navigate the complexities of enrollment growth with precision and confidence, always mindful that incremental progress, evaluated at every stage, is key to achieving long-term goals.

    Setting expectations means recognizing that significant results take time and careful planning. This translates to setting realistic growth expectations based on an understanding that reaching your enrollment goals will take multiple academic terms. When I am collaborating with our partners, we adopt a structured five year growth trajectory where Year 1 serves as the “foundational” phase, establishing the core infrastructure and strategic alignment. Year 2 is focused on “scaling,” optimizing initial investments to drive measurable growth. Years 3 and beyond are dedicated to “sustained value creation,” with a continuous focus on refining processes and maximizing returns through ongoing optimization and strategic enhancements. This phased approach allows for calculated risk-taking and ensures a clear path to long-term, scalable success.

    Chart showing 5-year projected growth for digital leads with 20%YoY growth

    Once we’ve set realistic expectations for our digital strategy, it’s crucial to ensure that every tactic -whether paid digital marketing, SEO, or creative content, all work together seamlessly to achieve your goals. These elements don’t function in isolation; rather, they complement each other to drive greater visibility, engagement, and, ultimately, enrollments. A well-rounded strategy that integrates SEO to boost discoverability, paid digital marketing for targeted reach, and compelling content to engage prospective students will create a strong foundation for success. By understanding how these components interrelate, you’ll be better equipped to assess their effectiveness and make data-driven adjustments as needed.

    From here, let’s dive into how digital strategy translates into budget planning and ROI. Understanding the interconnectedness of these key elements will help you allocate resources more efficiently and set a clear path for measuring the success of your investments.

    Connecting strategy to ROI and crafting a strategic budget plan for growth

    The connection between strategy and ROI is grounded in the ability to align your digital marketing efforts with measurable outcomes, and it all starts with the establishment of clear and precise enrollment goals. Prioritizing top programs ensures that marketing resources are directed toward the areas with the highest demand or growth potential, improving overall program performance. The right channel mix is crucial to reaching the right audience, maximizing visibility, and efficiently converting interest into applications. Monitoring data and optimizing it in real-time ensures that marketing efforts are continuously adjusted for maximum effectiveness, enhancing the likelihood of meeting targets and improving ROI. Finally, effective allocation based on application timing, seasonality projections, and market revisions allows for strategic adjustments in campaigns to account for fluctuating demands, ensuring marketing spend is optimized throughout the enrollment cycle. Collectively, these elements create a robust framework for maximizing ROI, ensuring that marketing investments lead to increased applications, conversions, and, ultimately, student enrollment.

    Graphic of connecting digital marketing strategy to ROI: Enrollment Goal Mapping, Program Prioritization, Channel Mix Strategy, Monitor&Optimize, App Deadlines and Scaling UpGraphic of connecting digital marketing strategy to ROI: Enrollment Goal Mapping, Program Prioritization, Channel Mix Strategy, Monitor&Optimize, App Deadlines and Scaling Up

    How do you craft a budget that supports your growth goals? Whether you are the decision-making authority or a decision influencer, here are the essential steps to craft a budget plan that aligns with your institution’s growth objectives and maximizes your enrollments:

    1. Define your enrollment goals in detail

    When you think of marketing costs, what comes to mind first? How much will it cost to meet your enrollment goals, right? So, your first step in planning a budget is to have your overall Enrollment goal (and, for graduate or online programs, a goal for every program) in front of you. With the goal (or program-level goals) in hand, determine what that means in terms of percentage growth from the current state. You may also have subsidiary goals like enhancing brand awareness, building more brand equity, or engaging alumni. If these are going to be part of your plan, they should also have tangible goals for what you are trying to do. Defining your enrollment goals helps you allocate your budget accordingly and measure ROI effectively.

    STRATEGY TIP

    Develop a “Goal Mapping” Scenario or you can say a Reverse Funnel (for each program). After you set enrollment goals (for the year or the term) you then need to understand the lead to enroll ratio. This will help you work backwards to determine how many accepted apps/admits will be needed, how many completed apps, how many submitted apps, and finally how many qualified leads will be needed. Based on the program category, dig deeper into what the Cost per Leads (CPL’s) are, based on industry benchmarks. That will help you calculate the estimated ad spend needed to generate those qualified leads.
    Goal Mapping for digital marketing: 1. Qualified Inquiry 2. Submitted Application 3. Completed Application 4. Admitted StudentGoal Mapping for digital marketing: 1. Qualified Inquiry 2. Submitted Application 3. Completed Application 4. Admitted Student

    A note on program-level goals: If you don’t have program-level enrollment goals for your online and graduate programs, finalize those as soon as possible. Until then, focus marketing on building brand awareness. It is likely that people in your own backyard could be less familiar with your program than you may think they are. Brand advertising will ensure that awareness rises so that when you have your program goals, you can build your campaigns on a higher level of familiarity with your institution. However, given that Google reports that 75 percent of graduate and online program searches don’t include an institution name, remember that branding alone will not be enough to fill your classes.

    Institutional example: When we began work with one of our partners nearly two years ago, they had not established program-level goals. So, in year one, we focused the largest portion of the budget on institutional awareness, with mini-campaigns focused on specific programs of importance to the institution. By the beginning of the second year, the institution had set program-level goals based on a greater understanding of market conditions. At that point, we began transitioning our campaigns to focus (ultimately 80 percent of the budget) on the programs with the “mini campaign” focused on continuing the brand equity efforts.

    2. Prioritize your programs

    It is highly unlikely that most institutions can spend marketing dollars on every program they offer. This means that in order to maximize the ROI of your marketing budget, you must prioritize your programs. But how? Take a data-driven approach, prioritizing programs for which you a) know there is market demand both among students and employers, and b) understand the competitor environment. These are the “cash cows” that will demonstrate the best ROI on your marketing spend and support the programs that, while not demonstrating significant market demand, are critical to the institutional mission.

    STRATEGY TIP

    Spreading a $100K marketing budget across 15 -20 programs will only dilute the ad spend, by spreading it too thin. Instead, identify the top 5-7 programs that have the greatest market demand and focus on them. Note that sometimes, the programs that seem most in need of a “marketing boost”, really aren’t. They are struggling because their market demand situation is not what it once was.

    Institutional example: A partner institution recently commissioned RNL to conduct a Program Prioritization and Positioning study focused on their current program mix. The goal was to take a data-driven deep dive into 12 programs vying for marketing dollars, with a focus on understanding student demand and employer needs in the region. The results indicated that while one of the programs they had planned to prioritize came out on top, two others that they hadn’t been planning to focus on also demonstrated strong demand, and one of the programs that they had questioned was confirmed as having weak local market demand.

    3. Determine your channel strategy

    Once you have prioritized your programs for marketing ROI, setting your channel strategy is pivotal. Personas (at the graduate and online levels developed for each program) dictate the channels on which you should focus. You don’t want (or need) to be present on every single channel just for the sake of “eyeballs.” Be mindful of the budget and how best to use it in order to maximize return, which can only be accomplished if you apply the personas that will inform you where your target student spend their “digital time.” So, for example, not every program may benefit from marketing on LinkedIn. Since it is expensive with a $10 minimum ad spend, a persona-based approach may indicate that other platforms are a much better match. But you can only do this if you know the characteristics of your audience, and that comes from the program personas.

    STRATEGY TIP

    The critical element in increasing marketing ROI is to engage the right students at the right time on the right channel, without spreading your budget too thin. In contrast, being too invested in any single channel exclusively or too long is also almost always the wrong strategy. There is always a point of diminishing returns as students cycle to different platforms, and you want to be sure to know where to go next before you approach that point by being able to tap into the next new thing.
    Chart of program and channel performance for different degrees and channels.Chart of program and channel performance for different degrees and channels.

    Institutional example: One of our prestigious campus partners was struggling with recent market shifts that resulted in an overall decline in applications. We dug into market and performance data to help them prioritize programs that had the highest lead-to-enroll ratios, lowest cost per acquisition, and good search volume with an eye to increasing marketing ROI and overall success. This approach not only helped regain their momentum at the top of the funnel but also generated strong conversion volume that exceeded goals and sustainably reduced cost per conversion. These changes benefited not only the marketing operation but were also felt by the call center, and further down the funnel where we saw an increase in applications.

    Talk with our digital and enrollment experts

    We’re to help you find the right digital marketing and recruitment strategies. Let’s set up a time to talk.

    Contact us

    4. Analyze data regularly and optimize with agility

    If (quality) content is king, data is queen! Sustained growth can only occur when data and insights are continuously incorporated into strategy. Analyzing performance data is crucial to understanding which programs and channels are yielding the largest numbers of applications and enrollments and, hence, generating the best return on ad spend (ROAS). This type of analysis allows for a data-driven approach to strategic pivots on how the marketing budget is allocated to ensure the highest ROI (or ROAS) across channels and the program portfolio. As the cost of marketing has risen, so has the need for marketers to make an effective case to senior leadership for additional marketing dollars. You can only do this if you can demonstrate that you are the best possible stewards of current resources.

    STRATEGY TIP

    As you continue to increase your campaign efficiency and success with the focus on ROI, your cost per lead will gradually start to go down – on average by 5 – 10 percent in year 2 and beyond. So, campaigns can generate more qualified leads efficiently over the years (for the same cost), thereby maximizing the return on your ad spend (ROAS). This helps you not just grow but also helps in building forecasts and projections for growth compounded over several years – and it also provides a strong ROI-driven basis for any requests you may need to make for additional funds elsewhere.
    Cost-per-lead trends over one year, showing how current CPL has been greatly reduced from the previous year.Cost-per-lead trends over one year, showing how current CPL has been greatly reduced from the previous year.

    A note on analytics platforms: The fact that resources have become increasingly scarce at the same time as marketing costs have skyrocketed has resulted, out of necessity, in more sophisticated tracking of ROI. If your internal systems are set up in the correct manner (or if you are working with a strategic partner like RNL) every lead can be tracked to its source, thereby allowing for the assessment of just how effectively each marketing dollar has been used.

    Institutional example: A prestigious campus partner was having challenges with converting leads to applications and enrollments. We reviewed their full-funnel data (compete with attribution percentages) and realized something wasn’t working. The top of the funnel was healthy, with good lead volume. However, down the funnel we saw that a disproportionate number of leads were not converting to apps and enrollments. As a result of the review and data analysis, we made a bold strategic pivot to shift significant budget allocations to the channel (Google search) that we could see was producing the greatest numbers of applications and enrollments. Without the data, solving the challenge would have been impossible. With the data, it was easy. Since we made this change, applications, and enrollments have consistently increased each academic period.

    Graphic showing two circle charts and the reallocation of channel spend from Facebook as the largest channel to Google Search as the largest channelGraphic showing two circle charts and the reallocation of channel spend from Facebook as the largest channel to Google Search as the largest channel

    Making sure that the top of the funnel strategy is guided by down funnel numbers is the KEY! Effective strategy must evolve through ongoing optimizations with thoughtful placements across diverse media platforms that are informed by performance data. Remember that the path to enrollment is rarely linear and an integrated media strategy allows you to provide a personalized message in the right place at the right time.

    5. Understand and account for seasonality/application timings/expansion

    Another aspect of the dynamic nature of the marketing process relates to the seasonality of lead flow – and subsequent enrollment. This requires flexibility to adjust your strategies based on real-time performance data collected throughout the year. For any program or institution, there are times of the year during which more or fewer leads are generated. Fully understanding these trends takes time; you can make preliminary judgments on when the lead volume is highest and lowest within one year, but multiple years will allow for greater certainty. As you build your capacity to track lead generation – and conversion throughout the funnel – by program and source – you can create visualizations that map these factors by month. They can be used to build monthly budget allocations like those presented below.

    Bar chart showing budget allocation over the year for search, social, display, retargetingBar chart showing budget allocation over the year for search, social, display, retargeting

    Institutional example: For one campus partner we used the annual performance data in an innovative way. Our data insights indicated that there was more market share to capture, by having the program leverage low cost per conversion at the top of the funnel at certain points in the year, and low cost per acquisition at the bottom at other points of the year. There was time to scale up both applications and enrollments. We developed a forecast plan to address the potential areas of opportunity, calculated the cost, and pitched it to the partner. Once approved, we moved with agility, and implemented additional ad spend on the top champion programs and frontloaded the budgets for the academic periods yielding the highest number of applicants and enrollments. With this, we were not only able to meet the qualified lead goal but also exceeded the enrollments by 19% for the following academic period.

    The lifetime value of the student

    As you budget for growth, it’s crucial to consider the lifetime value (LTV) of a student. LTV refers to the total revenue a student generates throughout their academic journey and beyond. This value encompasses tuition fees, ancillary revenues (like housing and meal plans), alumni donations, and increasingly in our era lifelong learning opportunities.

    Talk with our digital and enrollment experts

    We’re to help you find the right digital marketing and recruitment strategies. Let’s set up a time to talk.

    Contact us

    Source link