by Julie Burrell | January 22, 2024
Progress in both representation and equitable pay for women and people of color remained sluggish in most roles on college and university campuses in academic year 2022-23, according to the newest data. Through several interactive graphics representing years of research, CUPA-HR highlights the progress that has been made and the disparities that persist. The data track gender and racial composition as well as pay of administrative, faculty, professional, and staff roles, collected from CUPA-HR’s signature surveys.
While the representation of women and people of color across all roles has steadily increased, inequity remains, especially when it comes to compensation for women and people of color. However, there were some notable areas of progress when it comes to compensation. Asian women and men of color (except for Native American/Alaskan Native men) in administrative roles saw better pay equity than most other groups.
Administrators
The share of racial and ethnic minorities in administrative roles continued to grow over the past decade, but gaps in both representation and pay remained steady. This is especially true for women of color, who represented less than 11% of these roles and, for the most part, received lower salaries than White men.
In 2022-23, people of color made up 18.7% of administrators, up from 12.9% in 2011-12. Although the proportion of people of color in higher ed administrator positions grew steadily over the last decade, these increases have not kept pace with the rate at which minorities are obtaining graduate degrees.
No improvement was shown in pay disparities for most women administrators. All female administrators except for Asian women received lower salaries than White men. Conversely, men of color, except for Native American/Alaskan Native men, were paid salaries greater than those of White men.
The Administrators in Higher Education Survey collects data on administrator positions that manage a higher ed institution or a division within it.
See the Administrators Composition and Pay Equity by Gender and Race/Ethnicity interactive graphics, as well as data broken out by CEO, provost and chief HR officer.
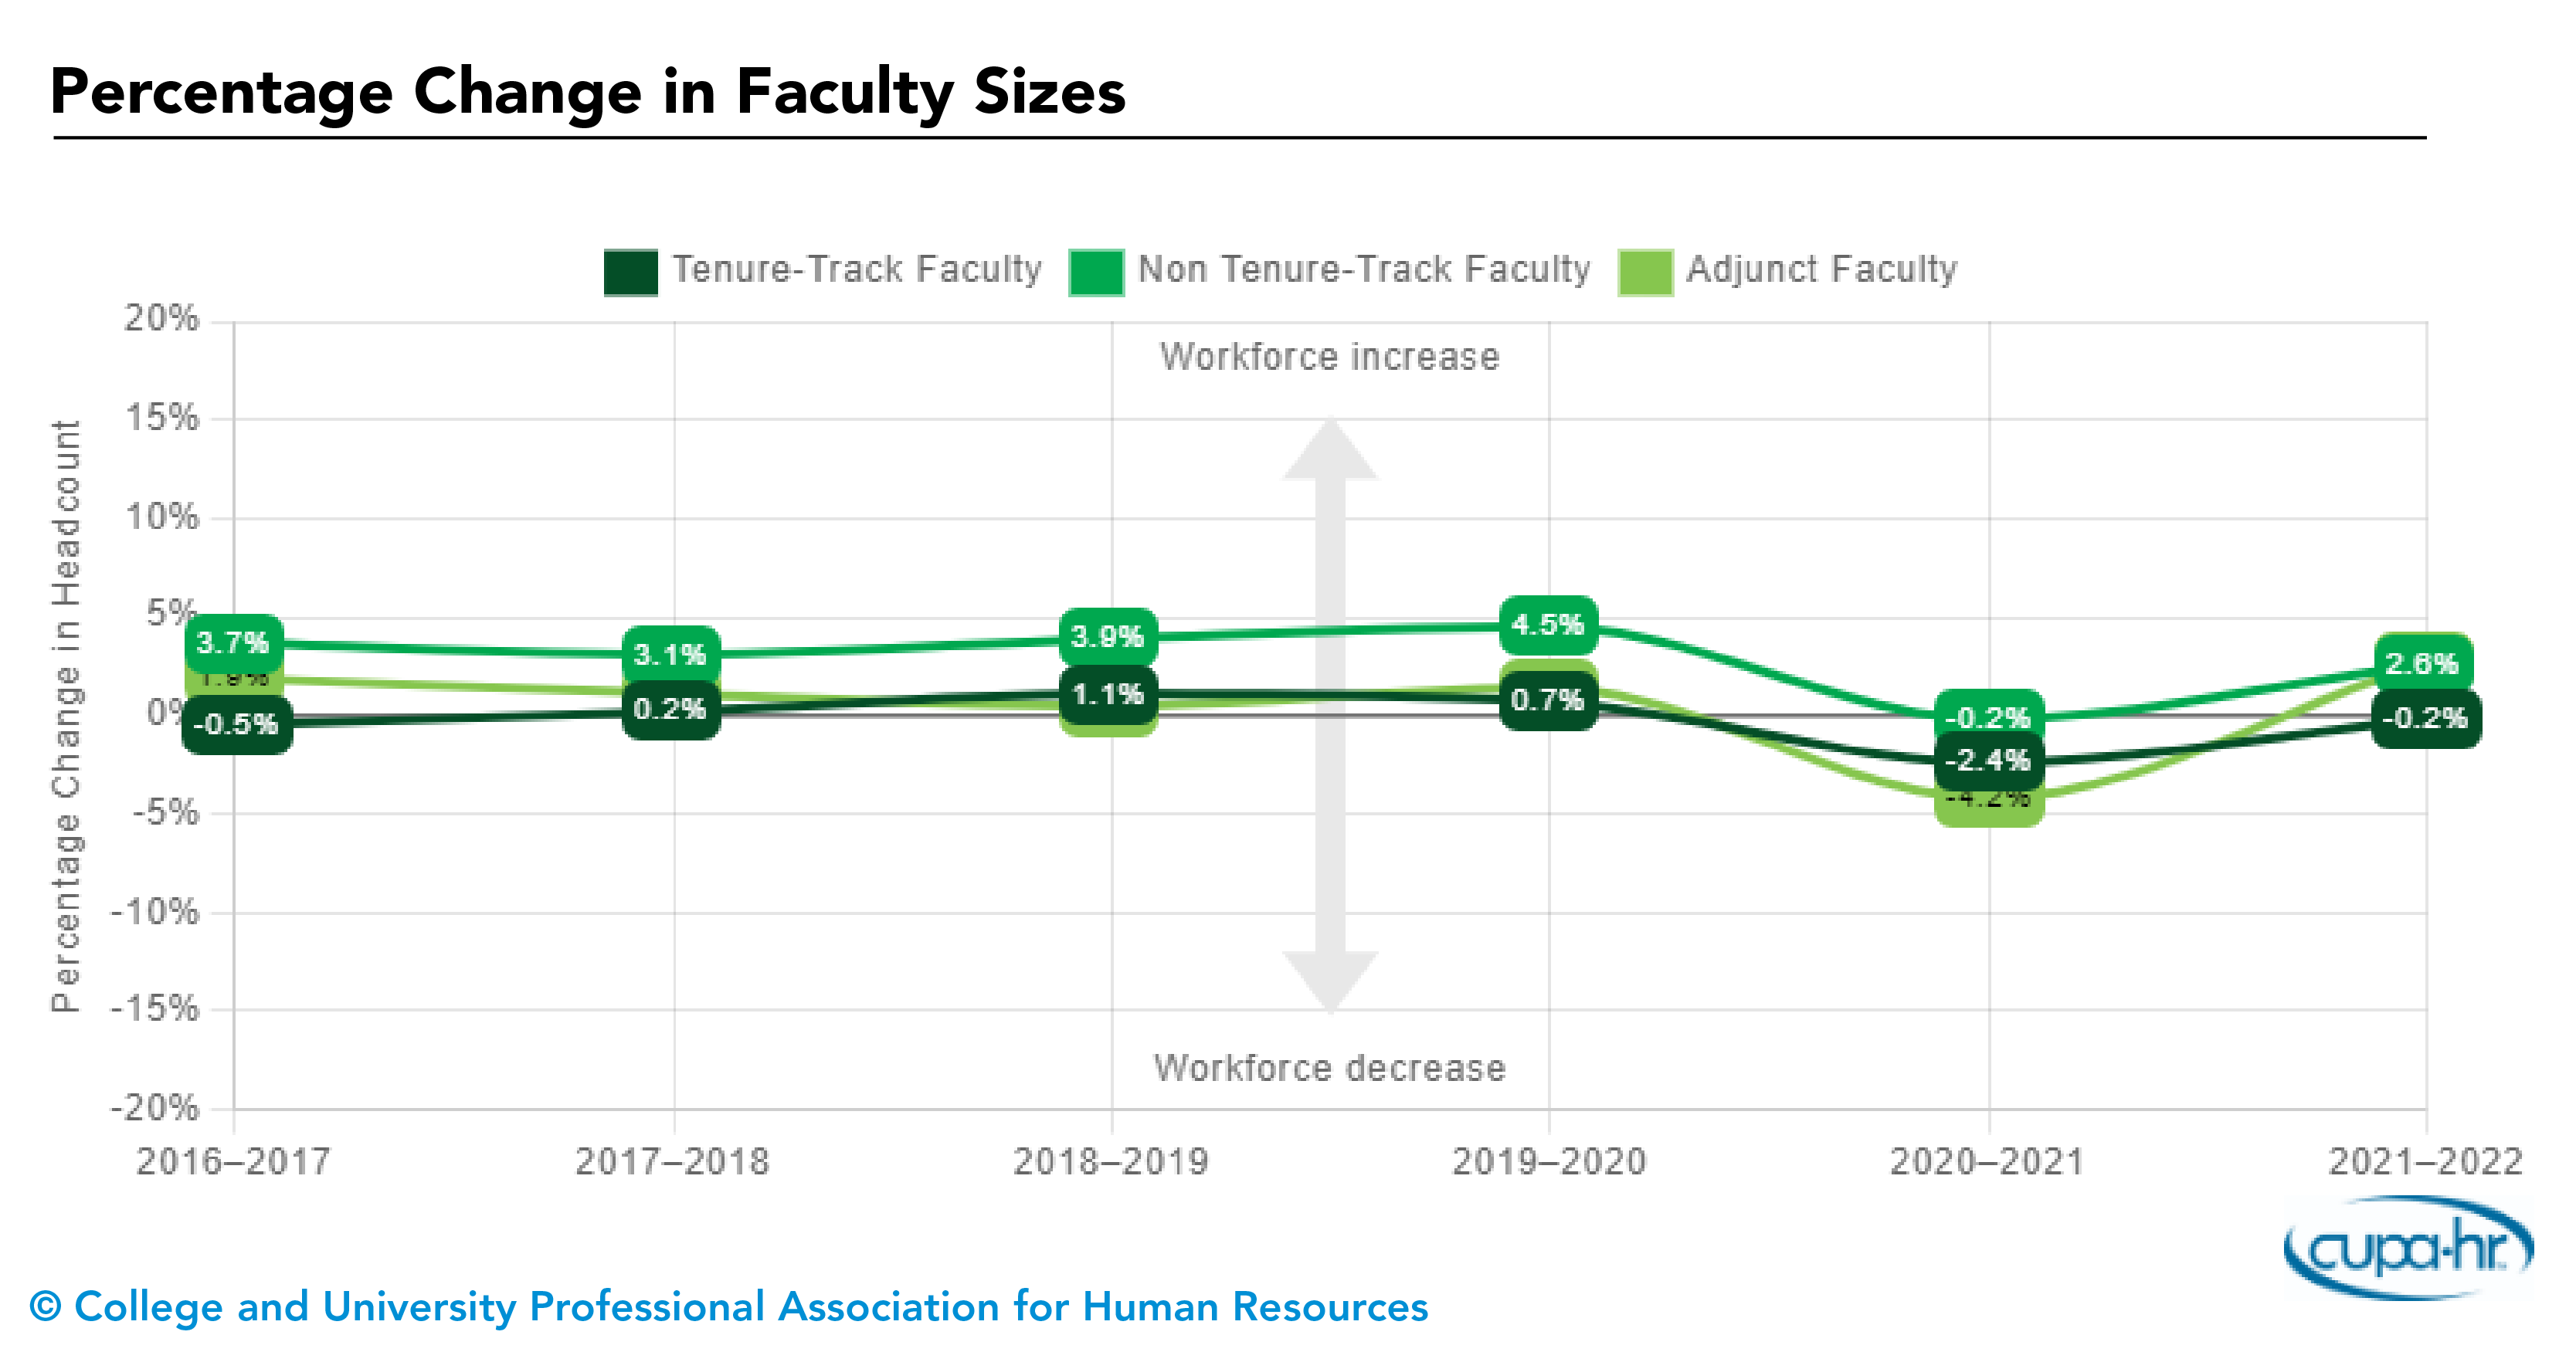
Faculty
There are two notable findings regarding faculty composition. First, more women faculty were represented in non-tenure-track roles than in tenure-track roles in 2022-23. Second, with each increase in rank, the proportions of women faculty and faculty of color decreased for both tenure-track and non-tenure-track faculty. Taken together, this means that women were over-represented in the lowest-paying and lowest-ranking positions.
Pay gaps within rank persist, particularly for women faculty at the professor level, regardless of tenure status. These gaps are most notable for female professors of color in non-tenure-track positions. Pay gaps for assistant and associate professors have narrowed over time, particularly for tenure-track faculty.
The factor that most impacts faculty pay is promotion to a higher rank, which is often the only time faculty receive significant increases in salary. When there is bias in promoting women and faculty of color to successive ranks, as our data continued to show, this results in career earnings gaps that far exceed what is often detected in pay equity studies within rank for a given year.
The Faculty in Higher Education Survey collects data on tenure-track faculty positions and non-tenure-track teaching faculty positions.
See the Faculty Composition and Pay Equity by Gender and Race/Ethnicity interactive graphics.
Professionals
In academic year 2022-23, women of all races and ethnicities were paid less than their male counterparts in professional roles, while women’s representation increased from 58% to 61% across all professional positions since 2016-17. The growth is due to slight increases in the representation of women of color, from 13.1% in 2016-17 to 15.7% in 2022-23.
Representation by gender and race/ethnicity varied widely by position. Human resources had the greatest share of women professionals, with 82% being women, including 28% women of color. Information technology had the lowest percentage of professional women (27%), and librarians and development/fundraising professionals had the lowest representation of professionals of color (14%).
While pay was more equitable for most groups (apart from Hispanic/Latina women and men of two or more races), pay disparities persisted. Women of all races and ethnicities were paid less than their male counterparts. In addition, Hispanic/Latino men, Native Hawaiian men, and men of two or more races were paid less than White men.
The Professionals in Higher Education Survey collects data on positions in specific functional areas in higher ed institutions, such as academic or student services, that usually require a baccalaureate degree.
See the Professionals Composition and Pay Equity by Gender and Race/Ethnicity interactive graphics.
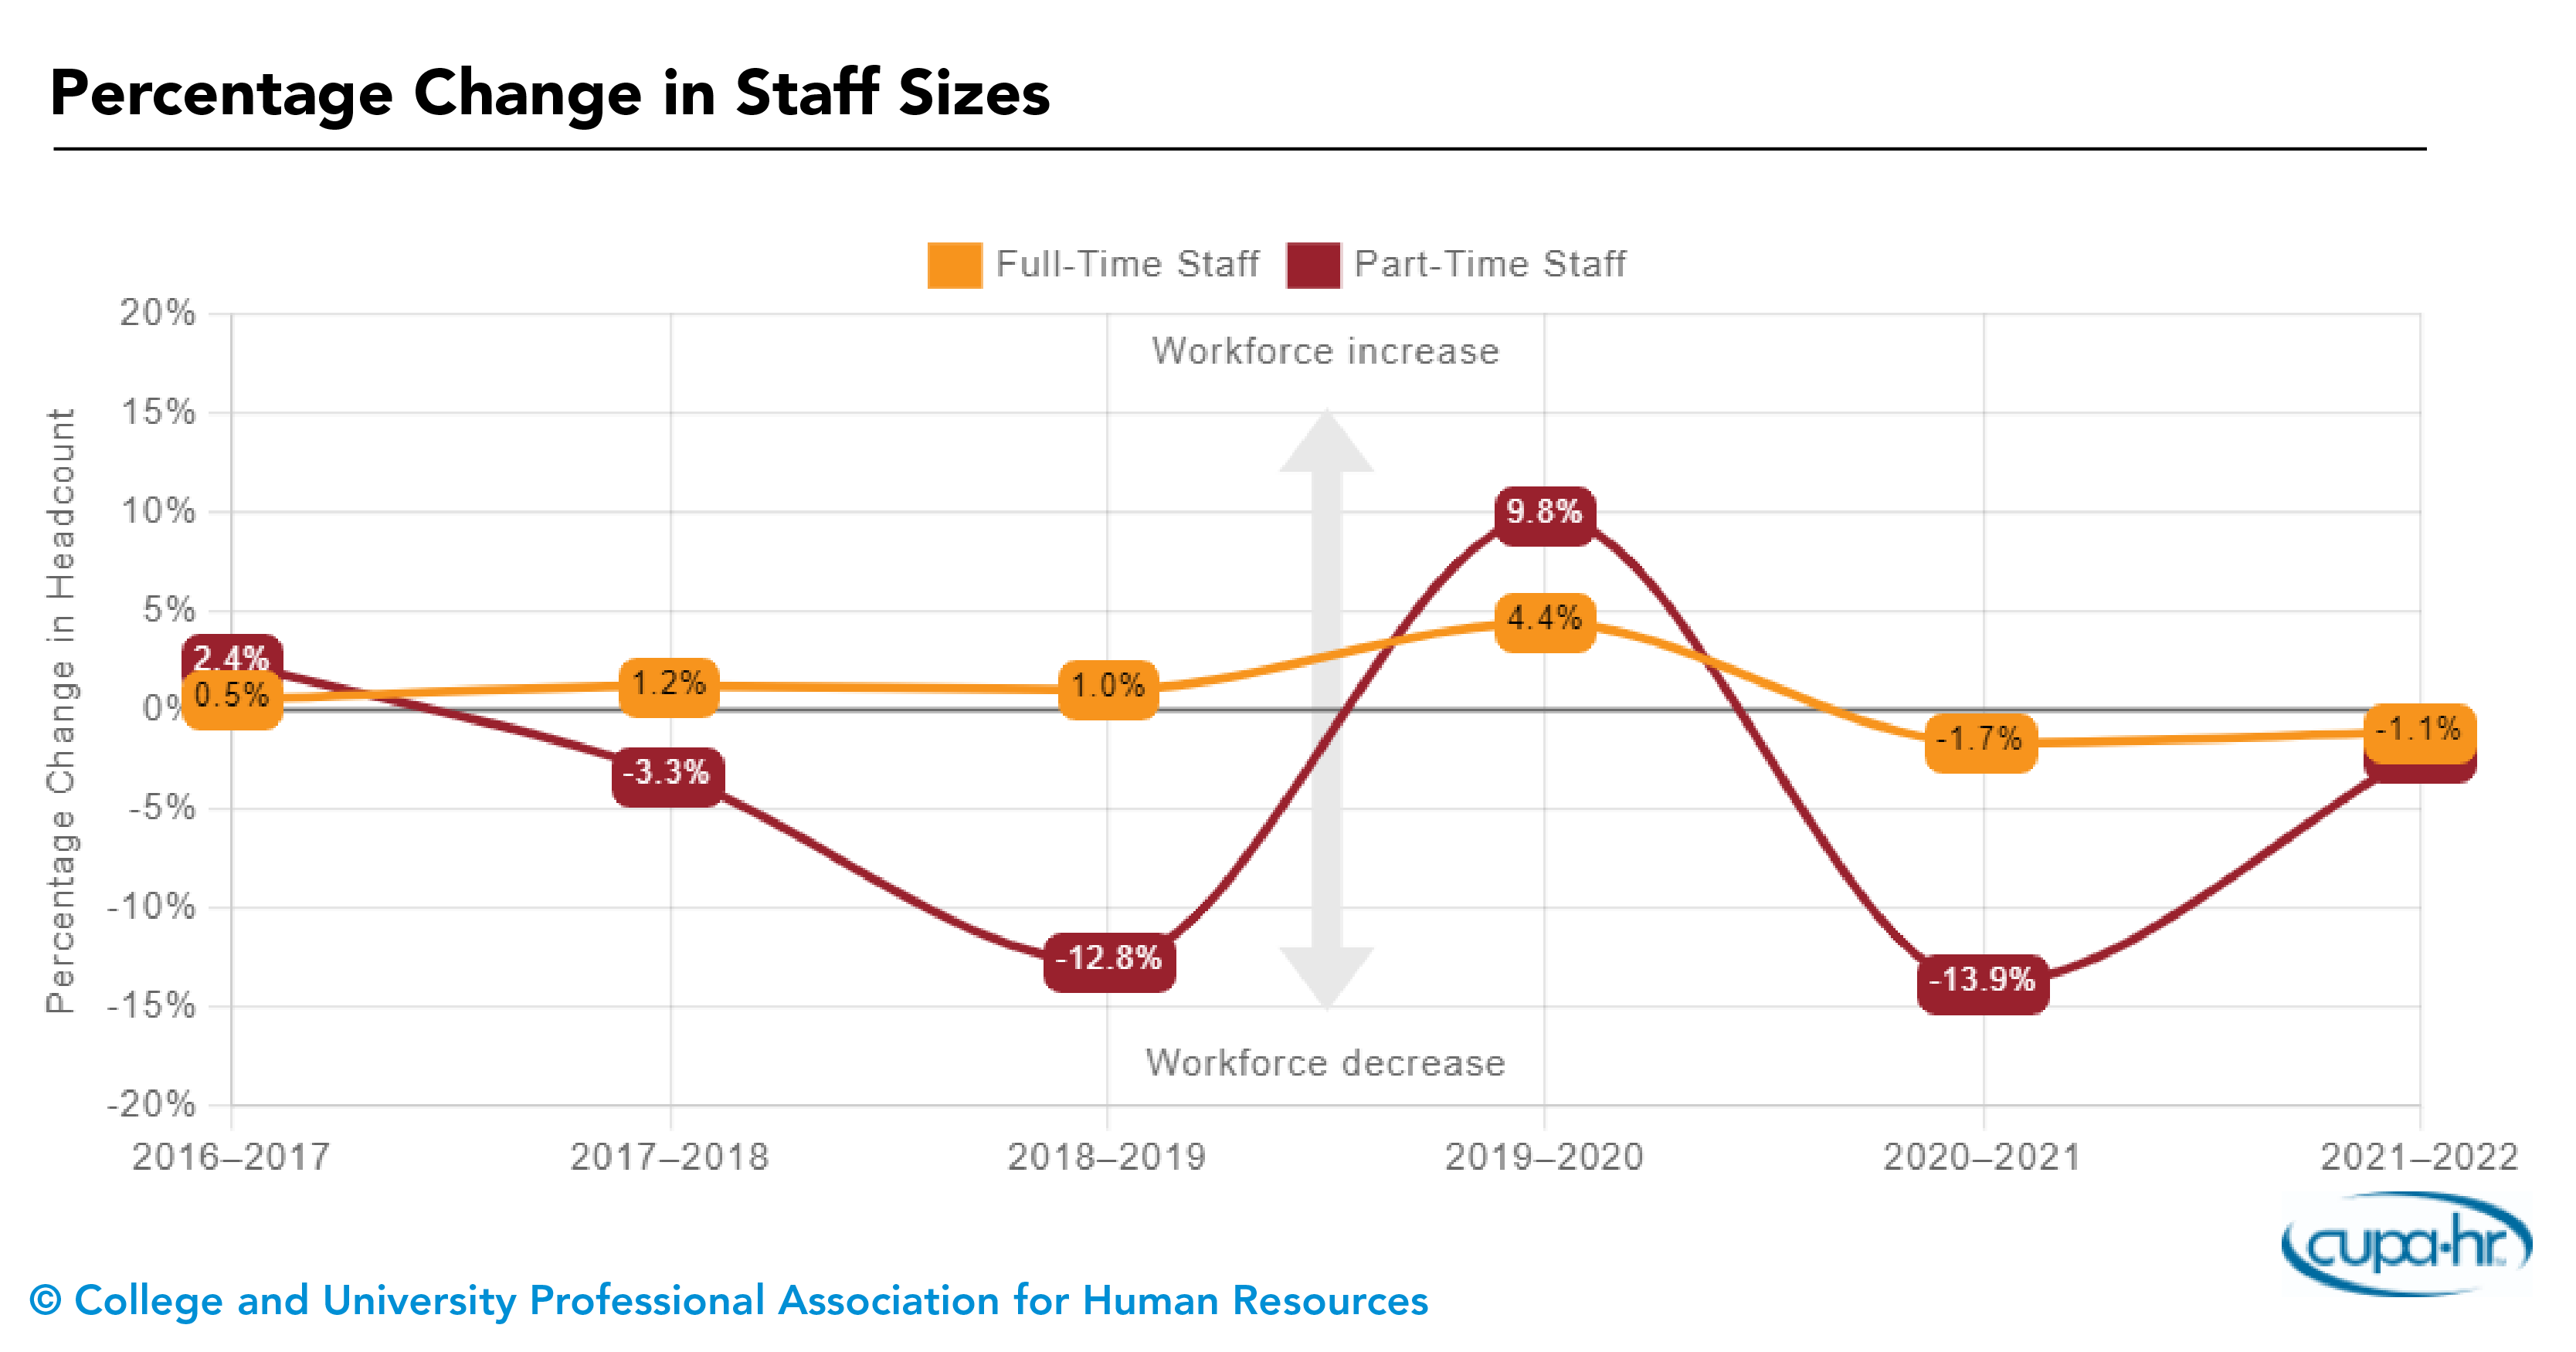
Staff
Staff roles continued to have a higher representation of people of color than any other higher ed employee group last year. Staff also continued to be the lowest-paying positions in higher ed, with women particularly hard hit by pay disparities.
In 2022-23, women of color represented about 19% of all higher ed staff, and men of color represent about 13% of all higher ed staff — a modest increase since 2016-17. Skilled craft employees were the least racially diverse, a finding that has persisted across the past six years. Notably, skilled craft staff are among the highest-paid staff positions.
Since 2016-17, women were paid consistently and considerably less than White men. Pay equity for American Indian/Alaska Native women, Asian women, and Native Hawaiian/Other Pacific Islander women was better in 2022-23 than in 2016-17. Pay equity was the same or worse in 2022-23 than in 2016-17 for Black women, Hispanic/Latina women, women of two or more races, and White women. Men of color fared considerably better than women of color when it came to pay equity.
The Staff in Higher Education Survey collects data on positions that are generally non-exempt and do not require a college degree.
See the Staff Composition and Pay Equity by Gender and Race/Ethnicity interactive graphics.
CUPA-HR Research
CUPA-HR is the recognized authority on compensation surveys for higher education, with its workforce surveys designed by higher ed HR professionals for higher ed HR professionals and other campus leaders.
Share This Article: