Creating consistency between classrooms and ensuring curriculum alignment school-wide can be challenging, even in the smallest of districts. Every educator teaches–and grades–differently based on their experience and preferences, and too often, they’re forced into a solution that no longer respects their autonomy or acknowledges their strengths.
When Superior Public Schools (SPS), a district of 450 students in rural Nebraska, defined standards-referenced curriculum as a priority of our continuous improvement plan, bringing teachers in as partners on the transition was essential to our success. Through their support, strategic relationships with outside partners, and meaningful data and reporting, the pathway from curriculum design to classroom action was a smooth one for teachers, school leaders, and students alike.
Facing the challenge of a new curriculum
For years, teachers in SPS were working autonomously in the classroom. Without a district-wide curriculum in place, they used textbooks to guide their instruction and designed lesson plans around what they valued as important. In addition, grading was performed on a normative curve that compared a student’s performance against the performance of their peers rather than in relation to a mastery of content.
As other educators have discovered, the traditional approach to teaching may be effective for some students, but is inequitable overall when preparing all students for their next step, whether moving on to more complex material or preparing for the grade ahead. Kids were falling through the cracks, and existing opportunity gaps only began to grow.
SPS set out to help our students by instituting standards-referenced instruction at both the elementary and secondary levels, allowing us to better identify each child’s progress toward set learning standards and deliver immediate feedback and intervention services to keep them on the path toward success.
Take it slow and start with collaboration
From day one, school leaders understood the transition to the new curriculum needed to be intentional and collaborative.
Rather than demand immediate buy-in from teachers, administrators and the curriculum team dedicated the time to help them understand the value of a new learning process. Together, we took a deep dive into traditional education practices, identifying which set students up for success and which actually detoured their progress. Recognizing that everyone–teachers included–learns in different ways, administrators also provided educators with a wide range of resources, such as book studies, podcasts, and articles, to help them grow professionally.
In addition, SPS partnered with the Curriculum Leadership Institute (CLI) to align curriculum, instruction, and assessment practices across all content areas, schools, and grade levels. On-site CLI coaches worked directly with teachers to interpret standards and incorporate their unique teaching styles into new instructional strategies, helping to ensure the new curriculum translated seamlessly into daily classroom practice.
To bring standards-referenced curriculum to life with meaningful insights and reporting, SPS integrated the Otus platform into our Student Information System. By collecting and analyzing data in a concise manner, teachers could measure student performance against specific learning targets, determining if content needed to be re-taught to the whole class or if specific students required one-on-one guidance.
With the support of our teachers, SPS was able to launch the new curriculum and assessment writing process district-wide, reaching students in pre-K through 12th grade. However, standards-reference grading was a slower process, starting with one subject area at a time at the elementary level. Teachers who were initially uncomfortable with the new grading system were able to see the benefits firsthand, allowing them to ease into the transition rather than jump in headfirst.
Empowering educators, inspiring students
By uniting curriculum and data, SPS has set a stronger foundation of success for every student. Progress is no longer measured by compliance but by a true mastery of classroom concepts.
Teachers have become intentional with their lesson plans, ensuring that classroom content is directly linked to the curriculum. The framework also gives them actionable insights to better identify the skills students have mastered and the content areas where they need extra support. Teachers can adjust instruction as needed, better communicate with parents on their students’ progress, and connect struggling students to intervention services.
Principals also look at student progress from a building level, identifying commonalities across multiple grades. For instance, if different grade levels struggle with geometry concepts, we can revisit the curriculum to see where improvements should be made. Conversely, we can better determine if SPS needs to increase the rigor in one grade to better prepare students for the next grade level.
While the road toward standards-referenced curriculum had its challenges, the destination was worth the journey for everyone at SPS. By the end of the 2024-2025 school year, 84 percent of K-5 students were at or above the 41st percentile in math, and 79 percent were at or above the 41st percentile in reading based on NWEA MAP results. In addition, teachers now have a complete picture of every student to track individual progress toward academic standards, and students receive the feedback, support, and insights that inspire them to become active participants in their learning.
Tricia Kuhlmann and Jodi Fierstein, Superior Public Schools
Tricia Kuhlmann is the Curriculum Director and Jodi Fierstein is the Elementary Principal and Director of Special Services at Superior Public Schools in Superior, NE.
Latest posts by eSchool Media Contributors (see all)
UCAS itself, for instance, focuses on the new data on student residence intentions – 31 per cent of 18 year old applicants in 2025 intend to live at home (rising to 46 per cent in Scotland).
If we add in information on deprivation (IMD) and acceptance route, we learn that 50 per cent of the less advantaged quintile of students aged 18 intend to live at home while studying, compared to just 18 per cent of their peers in quintile 5.
And there are interesting regional variations – two thirds of the least advantaged 18 year old accepted applicants in Scotland intend to live at home (mouse over the map to see the regional breakdowns – and of course UK wide IMD isn’t a thing so treat that as indicative only).
Likewise, 75 per cent of the least advantaged group applying via main scheme Clearing will be living at home.
Higher tariff (what we once called “selective”) providers are recruiting more 18 year old students than ever before, a trend that has become more prominent since the end of pandemic restrictions. The chart above shows acceptance rates, demonstrating that – simply put – as an 18 year old you are now substantially more likely to end up at a high tariff provider if you apply there.
One of the commonly proposed explanations for this phenomenon is the way in which applicants are using the “decline my place” functionality (on the UCAS platform since 2019) to trade up to a more prestigious provider. But the data neatly disproves this – movement tends to be within rather than between tariff bands:
We also get data by tariff group and acceptance route in this release – and from that we can see some very interesting underlying trends. Here the thick bars are the proportions and the thin ones the raw numbers, with the colours showing acceptance routes.
Gradually higher tariff providers have been taking a lower proportion of their 18 year old students via firm acceptances, and a higher proportion from other main scheme choices (including clearing). But this shift needs to be set against enormous expansion in numbers across the board – high tariff providers took more 18 year olds overall this year than their entire 2019 intake, and more firm or insurance 18 year old applicants this year than their entire 2023 intake.
In contrast, proportions of 18 year olds by route have stayed broadly similar by proportion in medium and low providers, with medium tariff numbers staying steady and low tariff numbers slowly falling.
More data please?
So, even though high tariff providers have been slightly more active in clearing than in recent years (and even then, it is not outside of historic proportions) the growth comes simply from making offers to more applicants who apply to them, and then accepting them.
What I really wanted to know is on what terms. There’s already a fair amount of circumstantial evidence that high-tariff providers are making low tariff offers – and I was hoping that this release would give us the data we needed to be sure.
But UCAS has always been very coy about the association between tariff groups and the actual grades they accept. I can kind of understand the commercial in confidence arguments about detailed data at provider level (but the more I think about it the less I do…) – I cannot see any reason why we are not allowed to see grades by tariff group.
So I am taking a roundabout route using the data we have got, and we start by looking at the relationship between achieved A level points and POLAR4 quintiles. I’ve generally held the opinion that A levels are a fantastic way of telling how middle class an 18 year old applicant is so there are no surprises that people from better off background are more likely to apply, more likely to be accepted if they apply, and more likely to have better grades than their peers when they do – here’s that in graphical form.
Outside of the years of the examnishambles proportions remain pretty stable, even though numbers have increased in all cases. Roughly a third of POLAR quintile 5 (most advantaged) accepted applicants get AAA or above, roughly three in ten of POLAR quintile 1 (least advantaged) accepted applicants get CCC or below.
We run into another wrinkle in the UCAS data here: we don’t get tariff group acceptances by POLAR, though we do get it by IMD (and we don’t get A level points by IMD, but we do by POLAR). I’m pretty sure UCAS invented the multiple equality measure (MEMS) for precisely that reason, but we don’t appear to get that at all these days.
So here is a plot of acceptance applicants by IMD quintile (note that you can only really look at one home nation at a time due to differences in methodologies). And what is apparent is the familiar slow steady growth in less advantaged 18 year accepted applicants attributed to widening access initiatives.
Unfortunately this is a case of what we don’t see. There’s a potential happy ending where we learn that high tariff providers are massively expanding their recruitment of applicants from disadvantaged backgrounds, and that this explains both the rise in numbers and any decline in average offermaking. The growth in high tariff recruitment from low advantage quintiles is welcome, but not anything like huge enough to explain the growth in numbers.
We are left to conclude that the expansion is in all groups equally – and given that most of the best A level scores tend to go to the top of the league tables anyway, it is hard to dismiss the idea that tariffs are falling. Perhaps January’s provider level release will offer us more oblique ways to examine what should be a very straightforward question – and one (that given the influx of less academically experienced students into providers that have not historically supported students like that) may well attract regulatory interest.
Bonus charts
We randomly got a really lovely dataset showing entry rates by Westminster constituency – and I could hardly resist plotting it alongside the 2024 election results. There is a mild correspondence between a lower entry rate and a higher Reform UK vote.
The Priorities Survey for Online Learners (PSOL) is the instrument in the Satisfaction-Priorities Survey family that best reflects the unique experiences of students in online two-year and four-year programs, including at the graduate level. The Priorities Survey for Online Learners provides the perspectives of online students aside external national benchmarks to inform decision-making for 150 institutions across the country.
It is critical to understand the full experience of online students who may have limited interactions with the institution, and the Priorities Survey for Online Learners allows leadership to know what matters to their online students in both their academic and non-academic interactions. Students respond on items related to instructional, enrollment, academic and enrollment services along with their general perceptions of the institution. This broad view provides direction to campus leaders to be able to best serve what may be a growing population for the institution. Online students indicate a level of importance and satisfaction with just over two dozen items.
The combination of satisfaction and importance scores identifies strengths (areas of high importance and high satisfaction) to be celebrated and challenges (areas of high importance and low satisfaction) to be improved. Along with the external national comparison data specific to online students published annually, institutions can compare their students’ perceptions internally over time with annual or every-other-year administrations. In addition, the provided reporting gives institutions the opportunity to review their data for demographic subpopulations to focus initiatives appropriately.
All students enrolled in online programs, undergraduate and graduate alike, can be invited to complete the Priorities Survey for Online Learners. Like the Student Satisfaction Inventory and the Adult Student Priorities Survey (the other survey instruments in the Satisfaction-Priorities family), the data gathered by the survey can support multiple initiatives on campus including to inform student success efforts, to provide the student voice for strategic planning, to document priorities for accreditation purposes, and to highlight positive messaging for recruitment activities. Student satisfaction has been positively linked with higher individual student retention and higher institutional graduation rates, getting right to the heart of higher education student success.
“Having an independent organization with a well-known brand provide the student perspective is hugely important to us. The data is valued by our Board of directors and by our accrediting organizations. It shows how we are performing when it comes to institutions that are similar to us,” said Ada Uche, director of assessment and institutional effectiveness at Colorado Technical University (CO) about their regular administration of the Priorities Survey for Online Learners.
Ask for a complimentary consultation with our student success experts
What is your best approach to increasing student retention and completion? Our experts can help you identify roadblocks to student persistence and maximize student progression. Reach out to set up a time to talk.
Long-awaited details of the mooted levy on international students at English universities – due to take effect in 2028 – were released with Rachel Reeves’ Budget earlier this week to a largely negative reaction from international education stakeholders.
Instead of the expected 6% tax on international student income suggested in the immigration white paper, the Treasury is instead consulting on a £925-per-international-student flat fee.
However, under the proposals, each provider will receive an allowance covering their first 220 international students each year – meaning that many small or specialist institutions will be spared the tax.
But larger institutions with higher numbers of international students will bear the brunt of the levy.
HESA data from the 2023/24 academic year – the most recently available figures – gives an indication of which providers could be worst hit by the levy, although enrolment numbers may have changed since then and could shift dramatically before the policy finally comes into effect.
London is the region set to be most impacted by the levy, with England’s capital welcoming the most international students. Meanwhile, the North East had the fewest.
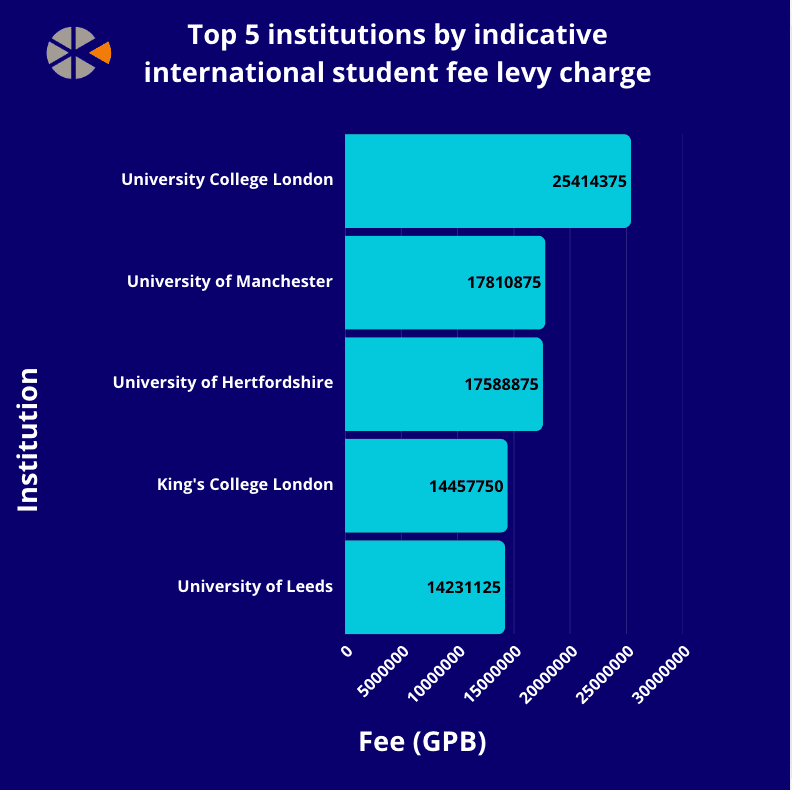
Here’s our round up of the top five institutions that risk losing out the most.
University College London (UCL)
Of the 614,000 international students at English institutions in the 2023/24 academic year, UCL was home to the largest amount, at 27,695.
Under the proposals, if UCL had the same number of international students under the levy, it would be liable to pay over £25 million.
The University of Manchester
Coming in second is the University of Manchester, which had 19,475 international students in 2023/24. This would mean it would have to pay almost £18m under the levy proposals.
The University of Hertfordshire
In third place is the University of Hertfordshire, with 19,235 international students in 2023/24 – a levy amount of just over £17.5m.
Kings College London
Up next is Kings College London, with 15,850 international students, meaning it would be taxed a little under £14.5m
The University of Leeds
Another large metropolitan university set to be hit hard by the levy is the University of Leeds, with 15,605 international students. If enrolments numbers stay the same into 2028, it could face costs of over £14.2m.
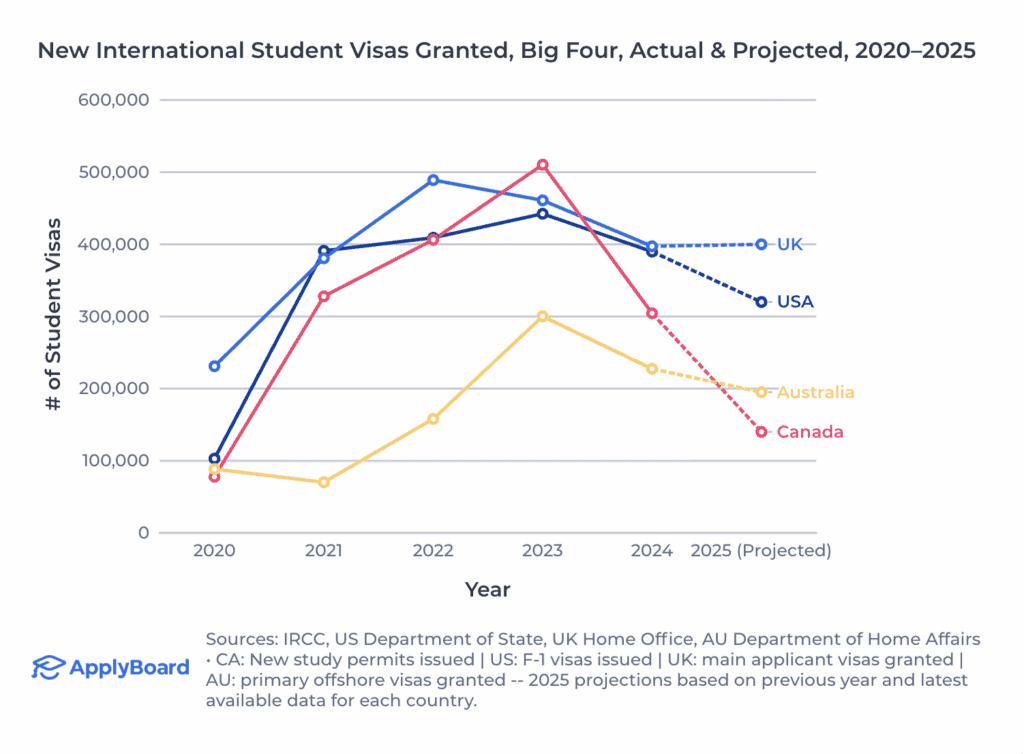
The study, conducted by ApplyBoard, highlighted the absence of consistent communication around policy shifts in Canada, the US, UK and Australia last year – a persistent issue that it said would likely drive subdued demand across the four in 2026.
Although a slowdown in Canada was widely expected, ApplyBoard CEO Meti Basiri said the projected 54% decline in new study permits this year was “stark”, setting Canada on track to issue the lowest total international study visas of the big four in 2025.
As per ApplyBoard estimates, Canada will see the sharpest drop in new international students, granting just 80,000 postsecondary study visas this year, while the US and Australia are set to see less dramatic drops.
The UK – the only ‘big four’ destination without a projected decline – is on track to maintain 2024 study visa issuance levels, in line new Home Office data showing a 7% increase in applications this year, though this could be slightly tempered by pending changes proposed by the immigration white paper.
Source: ApplyBoard.
Basiri said Canada’s projected 80,000 new study permits would mark the lowest number of post-secondary approvals for the past decade, including during the pandemic. Elsewhere, stakeholders have raised concerns about the country’s plummeting study visa approval rate, which dropped below 40% this year.
As the government pursues its goal of reducing Canada’s temporary resident population to below 5% by the end of 2027, the sector has been hit with two years of federal policy changes leading to lower application volumes, lower approval rates, and a higher proportion of onshore extensions.
At the same time, in a recent student survey, Canada scored highly on welcomeness – with roughly 71% of students viewing it as open, safe and welcoming – but it also had one of the highest levels of disagreement for this metric.
“That polarisation suggests that international students are picking up on the tension between Canada’s long-standing reputation, and the current reality of caps, more limited work rights, and public debate that often links international students to housing and affordability pressures,” said Basiri.
The report highlighted the impact of domestic political pressures around housing and net migration causing governments to tighten visa requirements, impose caps, reduce post-study work streams and raise compliance thresholds.
However, Basiri said the deciding factor for students increasingly came down to financial considerations, including the cost of study, cost of living and the ability to work during and after their studies.
“While political decisions set the rules of the game, affordability is often the filter through which students evaluate those rules – making it the more powerful force driving more students to consider more financially accessible destinations across Europe and the Asia-Pacific region,” he said.
“The speed at which alternative destinations are stepping up is remarkable,” Basiri added, highlighting the efforts of Germany, France, Spain, New Zealand, South Korea, and the UAE establishing clearer career pathways and expanding work rights, among other factors to boost internationalisation.
The speed at which alternative destinations are stepping up is remarkable
Meti Basiri, ApplyBoard
While traditional destinations are experiencing dips in demand, overall international student mobility continues to flourish, with more than 10 million students expected to study outside their home countries by the end of the decade, up from 6.9m in 2024.
The emergence of alternative destinations has not gone unnoticed, with another recent report tracking the rise of education “powerhouses” across Asia, fuelled by more English-taught programs, growing job opportunities and affordable study options.
Meanwhile, Europe is catching students’ attention, with European countries accounting for eight out of the top 10 destinations – outside the big four, Germany and Ireland – in ApplyBoard’s recent survey of student advisors.
Basiri identified Germany and Spain as the destinations poised for the most growth next year: “Each offers a strong combination of affordability, workforce alignment, and clear post-study pathways that align with student priorities … Together, they are helping to shape the next wave of student mobility,” he said.
The rise of Germany in recent years has been widely reported on across the sector, with international enrolments on track to surpass 400,000 last year. What’s more, two-thirds of Germany’s international students say they intend to stay and work in the country after graduating.
Meanwhile, this summer the Spanish government authorised a policy to fast-track international students impacted by US visa restrictions, alongside authorising part-time work for students this academic year.
Coupled with previous measures relaxing visa requirements and new work and dependents rights, Spain is becoming “one of the most student-friendly destinations in Europe” said Basiri, noting its heightened appeal among Latin American students due to language and cultural affinities, as well as streamlined routes into the workforce.
Colleges and universities sit on a large wealth of data, ranging from student attendance and interactions with learning management systems to employment and earnings data for graduates. But uniting legacy systems and having responsive data remains a wicked problem for many institutions.
This year, Central New Mexico Community College is deploying a new AI-powered predictive analytics tool, CampusLens, part of CampusWorks, to improve data visibility in student retention, early alerts and career outcomes.
In the latest episode of Voices of Student Success, host Ashley Mowreader speaks with Tracy Hartzler, president of Central New Mexico Community College, to discuss the risks with taking on new tools, the college’s approach to change management and the need for more responsive data.
An edited version of the podcast appears below.
Q: Can you introduce yourself, your role and your institution?
Tracy Hartzler, President of Central New Mexico Community College
A: My name is Tracy Hartzler. I’m president of Central New Mexico Community College. We’re located in Albuquerque, New Mexico. We serve three counties around us, and our population is about 900,000 residents in our area, so it’s about half the state of New Mexico who lives in our service area, but it’s an incredibly diverse area.
We have a significant population of Hispanic, Latino students. We have a large population of Indigenous students, as well. We are the largest undergraduate institution in the state, and that’s distinct because we only issue or grant certificates and associate degrees. We are not a bachelor’s degree–granting institution, so our focus really is on those students who are seeking entry into college—whether that’s our dual credit students who are still in high school—but also those who are returning for upskilling. They’ve already earned their bachelor’s degree or degrees, and they’re coming back for some hands-on or applied skills, or those who are getting back into education and training because they’re looking for greater financial stability.
Like so many other colleges, we know we want to learn from others, and so we’re really proud that we work with many of our other colleges across the state of New Mexico, but we certainly engage in conversations with leaders and schools who participate in American Association of Community Colleges who are part of the global community college leader network.
But we’re really pleased and we’ve been really pushed by our peers who are members of the Alliance for Innovation and Transformation—group of higher education institutions, there’s about 60 of us—with some other thought partners to really help us think how we can best leverage technology and change our processes and deliver better education and training for our students and better serve our employers.
We also are relying on lessons learned from those outside of higher education, so whether it’s in hospitality, healthcare, manufacturing and others. So while we know we have great work to do in New Mexico, and we are incredibly fortunate to work with strong partners who tell us what they want and how we can best serve them, we certainly look to other schools and other organizations to help us make those transitions faster so we can better serve our community.
Q: From my vantage point, it seems community colleges are often some of the most nimble when it comes to learning from other institutions.
A: Absolutely. You know, it’s great to be scrappy. I think we and here at CNM, we certainly punch above our weight. We are excited to take on new challenges. We are, frankly, fortunate to be able to move faster. So, if something doesn’t work, we can pivot away from it entirely or continue to revise it. And frankly, the urgency to do so is really placed on us by our employer partners, our community partners and our students. They really are pressing us to be responsive to them because they don’t have time to waste, and they certainly don’t have resources to waste. So, we really step in. And again, I don’t think CNM is unique in that we all respond to the need as quickly and as best we can.
Q: We’re talking today about a new AI-powered predictive analytics tool that you all implemented. Historically, what has been the college’s retention and persistence strategy? What are some of the challenges you have seen when supporting students?
A: Before the pandemic, we were able to and we were participating in a lot of futures work: What do students need? What do they need now? What do employers need in the future? Which, at that time, seemed so far off, and so we were already on a journey again, whether it was working with AFIT or others to help us better identify what we needed to do and how we needed to change to better meet our student and our employer needs.
We knew that that would include certainly technology and leveraging technology, but we also knew it would mean changing how we do things, how we schedule, how we use the data in our systems. And we also knew we have a tremendous amount of information. We have a lot of data, but like so many other places, it’s in seven legacy systems. And we have over 100 applications that help our data systems talk to each other, to generate reports that our staff use, and it’s incredibly challenging to wrangle this data in a way that is useful, that helps us drive and drive change again.
Most of the data is legacy data. It’s what happened last year, and how do we think that’s going to improve? What are we doing now to then improve performance a year ahead, and then we hope that what we do over the next year meets the need, but it takes us too long to really react.
So, we were looking for ways to take the assets we have—which includes our incredible faculty and a number of our leaders and our office of data strategy and some of our contractors, like CampusWorks and consultants—to help us wrangle this data in a way that helps us be data informed in a time-sensitive way.
We had a lot of processes in place that were helping us to do that. A lot of our steps were manual and creating reports, and it really slowed down what our frontline advisers and navigators and employment advisers really were able to do, because we were requiring them to do so much manipulation with the data then to be able to identify what they should do once they got this great report.
So, we were looking for ways to leverage technology. And again, the pandemic happens. We’re increasingly dependent on our systems, using them to greater degrees than we had before, including our learning management system. We are also undertaking a transition conversion from our old student information system to a new student information systemin Workday. We’re making all these changes and upgrading technology, and frankly, AI is coming along that’s really dramatically changing how we work, or could change how we work. We’re trying to figure out a better way to wrangle all these opportunities.
We were so excited to learn about CampusWorks and their product, CampusLens, because we think that tool will help us leapfrog, not only the tool but the experts that that CampusWorks brings to the table to help us to analyze data and develop tools that will help our frontline staff much more quickly and easily identify how they can help students. To register from class A to B, to help them identify all the predictors that say, if the student’s missing one assignment or they haven’t attended class, here are the automatic prompts for you as an adviser or navigator—or if you choose to automate that process you can. But really, how can we help individuals—our employees—still help and better connect with students to keep them on the track of success?
It certainly can also help us schedule, help our faculty and all of our associate deans who do incredible jobs trying to figure out ways to schedule our incredible programming to be most effective for students. Some of this information that we’ve had in different places, when it comes together in a product like CampusLens, will help us generate these tools so that we can we can more quickly assess our situation and better adapt, test, try and iterate ways to better, like I said, schedule classes, schedule our work-based experiences, help our employers predict the number of graduates who are going to come out of our programs at any given time.
When we have employers come to us with dramatic needs, you know, they need 1,000 technicians over three years, well, what do we need to do to scale and ramp up our programming to meet that need?
I’m excited that we have a tool that will help us do that, instead of the army of staff and technical staff that I would have to try to find to help us do that in an efficient way. That’s why a product and a team, a quality, curious and an innovative team at CampusWorks to help us work through some of these projects.
Q: How does the tool work logistically? What are you excited about when it comes to the capabilities of CampusWorks and CampusLens?
A: It helps us better, frankly, use staff time to keep students and others on the right track—on the track that they’ve chosen, by the way.
What is most exciting, at least for us with CampusLens, is their Career Lens. So all institutions, all community colleges, are focused on many phrases, but all go to the federal emphasis, or your statewide emphasis on return on investment. What is the value that a learner gets from your program that can be defined a lot of ways. It could be defined by wages, wages a year out, it could be defined for many years out from completing a certificate or degree. It looks at what’s your job in a particular program. We know the federal government, whether when they’re leading the rules around rule-making for Workforce Pell, we know that those regulations are going to help us require that we analyze our programs for results. Will these programs allow students to be eligible for federal assistance?
We know that we can use all of this data and CampusLens is going to be able to help us identify which programs are eligible for Workforce Pell, what are the wages? It’ll help us report out the successes of our programs, or, frankly, identify those programs where wages are not at the median level. What do we need to do, then, to repackage or reschedule or build up some of our programs to meet the wage requirements that we want individuals to accomplish, to achieve and earn, but also that will meet some of our federal standards?
So, I’m really excited about the workforce component of this, which is really what we’re all looking for. All of us [higher education leaders] want, I’d say, a silver bullet when it comes to unifying this data and being able to tell the story and being able to design programming is responsive and frankly to be able to tell our stakeholders, whether they’re legislators or federal government agencies giving us funding for workforce training, what are the outcomes? That’s so important that we’re able to show and tell the story with really valuable data? And I’m excited that CampusLens allows us to achieve that.
Q: How have you all been thinking about AI as a tool on campus, what are those conversation looking like with your staff and employees?
A: I want to start with our governing board. CNM is governed by a seven-member elected governing board, and our governing board represents geographic areas in our community. They are focused on how we are best serving our students, our employers and our community members and what does that mean for technology? Is the college investing in programming and the right tools? Are we getting the greatest benefit from the tools we’ve purchased? That also includes the question of, how are our faculty and staff using the tools to better help our learners?
We talked about retention and persistence and how we use data, but it takes training and professional development to be able to use the tools to the greatest advantage. And of course, this is all in service to our learners and our employers. So it starts with our leadership, and then it flows through.
I don’t think we’re any different than a lot of other colleges. We’ve looked at our policies, and we’ve built on our existing academic integrity policies around AI use, and we have faculty policies on how they describe and expect use, or have authorized use, if you will, approved use, embedded use of AI in their coursework, in their programs. We have policies in place.
We also have done some pilot work. We’ve created a fund for individuals to come to a group around data, frankly, out of our data governance team and our IT team to be able to pitch ideas for three-month sprints or pilots, and they report back. What was the result? What did we learn? Is it something we should scale
I will say many of those pilots are both on the business side or the operation side of the college, but also on the student and teaching and learning side. So that’s really interesting. We look forward to some of those first official pilots coming forward in the next month or so.
What I’m most excited about, though, is the systemic use of AI across the institution. I appreciate the pilots get us excited and interested. It gets people familiar with tools as they evolve and change. But how do we embed AI into our systems work? That’s why I’m excited about CampusLens.
You can only have so many pilots and scale up pilots, and you can read how many articles that tell you and advice pieces from Gartner to McKinsey to whatever source you may choose that help you try to identify how to scale up pilots. But I wanted something that was going to help us leapfrog that, and frankly, CampusLens allows us to do that with a multi-year co-development opportunity to help us focus on the student journey, but really in a systemic way, look at all of our data sources and our use and all of even our new systems like Workday that help us to leverage a tool that sits above our data sources. We’ll learn the operational side of this as we go on. But I’m really focused on students, and this was the easiest way to take a risk at a systemic change with a trusted partner who has incredible expertise, as we’ve known for years, and our relationship with them to help us take that leap, to help us implement a system-wide approach to using AI and how that can change and enhance all the human work that we do with our students.
It’s not necessarily about eliminating the human touch to what we do. It’s about helping our advisers and our navigators and our faculty members and our intern placement officers, helping them do their work more successfully, always evaluated by student satisfaction, student placement, employer satisfaction and the like.
I appreciate pilots, there’s a great role for them. And I really appreciate that we are able to take a systemic swing at this work.
Q: You used the work risk earlier applied to taking on this system, what do you consider the risks or challenges of this process?
A: There’s always a risk in the investment you’re making initially and the ongoing risk. The risk is not only the contract for the service, hiring the expertise and hiring a partner who’s been affiliated and connected to higher education for decades, who understands students, understands institutional requirements and for compliance and integrity and data governance and permissible uses. Working with a partner that has that basic understanding is critical. That mitigates your risk immediately.
The financial risk is always: Are we chasing AI attachments to every system we have, or are we helping to right size those to be able to leverage a holistic or a system-wide, comprehensive AI-aided business analytics or business intelligence tool? That’s a very different approach then again, enhancing all of the six legacy systems I have, plus using one system or one tool to be able to do that intelligence work. That’s a risk, and that’s something different that we’ve had to navigate.
I don’t underestimate the time and challenge and excitement of staff in using technology, that can be seen as a risk. There’s a real temptation, and I see it almost daily, to just lift what we do currently in our old systems and shift it to a new system and just be satisfied with going faster or generating a nicer looking report. It’s not what we wanted and that is so not what we can do in higher ed. We are called to be more innovative and to really use our information differently. And this tool will allow us to do that in terms of really getting to the intelligence side of predictive analytics.
That’s always seen as almost a holy grail for us, and to see that it’s within reach now, that’s worth the risk for us. We’ll be able to see the analytics and the predictive analytics that we were at one time working on a project, and we thought we might get there in two or three years. The fact that I can probably do this by the end of this academic year is really important for us. And by the way, not just see some results at the end of this academic year, but know that it’s going to be iterative and evolve, so that we’re going to continue to see growth and change and adaptation and be a part of that shaping is really important to us.
I think I mean the risk is time, resources, and security, and we face those all the time. But I will dare say the risk is also not doing anything. If we aren’t moving in this direction, you are risking putting resources, and particularly too much money and technologies that you still have to reconcile in some way. You risk, frankly, burning out your staff by adding another dashboard they’ve got to learn instead of one that’s much more comprehensive. You’re still going to have them look at 10 different screens to come up with all the information they need to advise one student. So, you don’t want to burn out your staff. You actually need them to be more efficient and effective and spend time with the student in a different way.
The risks of not taking a step like this are substantial, because the world will continue. Students will still demand more, and they always demand more to make their work easier, which means our work can be a little bit harder, and employers are expecting us to be responsive. So if you don’t act and take certain risks, you’re either irrelevant or your students are unprepared for the world that they’re going to be entering, and we just don’t have time for that. That’s just not an option.
Q: I appreciated your comment on the risks of using a new tool to do the exact same thing. We know that faculty and staff are often crunched for time and ensuring that we’re creating new systems that are evolutionary and actually creating efficiencies for everyone involved is important.
A: Yeah, and that’s scary. It does mean that we will be changing how we work. It means we will be removing some of the guesswork of whether our efforts will work. We can see whether, if I move certain levers in a student journey, does this really make the difference? Does it really move the needle, not only for that student, but maybe very similarly situated students?
It’s really important. This will change how we work. We’ll be asking our employees, my colleagues, to think differently and do their work differently, because they’ll have more information available to them with suggestions on how to act, so they don’t have to always consider and frankly, reinvent the wheel. That’s really important, but I don’t underestimate what that change looks like, because when you have expertise in old systems or even evolving systems, and that expertise can be threatened or seem to be threatened, then we have to navigate that, and again, always make sure we’re serving our students and doing it the best way we can.
This technology, the tools, the guidance and the continued evolution will, I think, go a long way toward mitigating that fear. When I brought this option for CampusLens to my team, I made sure my team kicked the tires. This wasn’t a president’s folly. It was sincere, deliberate vetting by many individuals across the college to say, is this the right approach? What are our questions? What are our fears? What’s my role? Will it really better serve our students, and what does that look like with professional development? How do I use this team of experts that I’m not used to working with? How are they going to integrate and challenge us and help us do our work? So there were a number of challenges in the five or six months that it took us to ascertain whether this is the right approach for us, and I appreciate that it’s a collaborative effort, and that that is continuing as we talk about change management and the work that we have to test the tool and move it out in the college.
Q: Where are you all at in this change process? What are you looking forward to as the next step?
A: We’re still early in our stages of implementing CampusLens. Much of what we hope for centers arounds adoption and effectiveness and we really hope for a long-term operational integration. Again, my interest is not only in pilots, but in helping us make systemic change and better leveraging all the legacy data sources that we have.
What we are hoping to see in the next 12 months would be how we move from tracking legacy data and focusing on what has happened to helping us think about what is likely to happen based on the data we see. So again, shift in mindset from always reporting out past data, old data, lagging data to what do we think will happen? And then how do we change behavior to improve what we think will happen or change the trajectory, if that’s what we want to do? I think it’s really important for our community, for us to continue to test the model, the tool and the logic, so it’s going to continue to be refined. I know that as we go through over time, we will continue to improve, refine, revise the model so that it better reflects what our community here in Central New Mexico needs and what our students need.
We’re early in the stages. What I’ve seen so far is exciting, and it’s what we wanted to accomplish, and this tool is going to help us accomplish it, I think, sooner, and to be able to test our work sooner.
This audio is auto-generated. Please let us know if you have feedback.
Lessons In Leadership is an ongoing series in which K-12 principals and superintendents share their best practices as well as challenges overcome. For more installments, click here.
Umatilla School District — a 1,500-student school system in eastern Oregon with a 72% Latino student population, 54% English learners and a 45% student poverty rate — is setting the standard for effective, streamlined data management.
As an educator in the district since 2000 and superintendent since 2007, Superintendent Heidi Sipe has seen Umatilla’s data systems evolve from pivot tables and spreadsheets to a mix of digital platforms tracking myriad data points for each student.
Heidi Sipe
Permission granted by Heidi Sipe
Part of the key, she says, is ensuring that there’s a common platform that consolidates student data points from other tools being used. This allows educators to look for trends and actionable data so they can identify students who may be at risk or need intervention plans, Sipe said.
“We can check the efficacy of those supports and see if we need to make an adjustment or if we need to keep that going for that student to ensure their success,” Sipe told K-12 Dive.
We recently caught up with Sipe to learn more about how the district uses that data to organize interventions, manages data anxiety, and helps parents understand the numbers.
Editor’s Note: The following interview has been edited for brevity and clarity.
K-12 DIVE: For many people, the idea of using data and processing data can be kind of daunting. When you’re introducing any sort of data tool to educators or school leaders or even parents, how do you get them comfortable with the idea of working with that data if they have any sort of anxiety about it or are overwhelmed?
HEDI SIPE: I think part of the overwhelm is it’s kind of “Data, data everywhere, and not a drop to use.”
The data points we’re using every month in our data team meetings are attendance — we track historical and last 30 days — and we also track disciplinary incidents, whether it be referrals or in-school suspension, out-of-school suspension, detentions.
We also track grades in students’ core classes, as well as overall GPA and course pass rate. And then we track our MAP data in English reading, Spanish reading, mathematics, and English language usage. We track DIBELS at the elementary level — K-3 — for progress monitoring of students in their literacy development. We use a dyslexia screener through DIBELS, and then we also have some of our intervention programs that again are supplying more data.
So when we have all of those various pieces at play, it can be really hard for a teacher to go platform to platform to platform to check the status of a student. But when all of that’s consolidated into one place, it goes from a situation of overwhelm to a quick snapshot based off of all those various pieces, which helps us make better-informed decisions for students.
Let’s say you’re the classroom educator or the school principal, and you see in your data tools that a student is chronically absent or disengaged or their test scores are slipping, what are the first steps that you then take to put that data into action and figure out how to help that student?
SIPE: We have a color-coded intervention list. So, anything that’s green, a teacher team can assign a student without any admin approval. If they’ve tried at least a few green interventions and they have monitored those for at least a couple of months, then they can move up and assign an orange level intervention, again without any admin approval.
If that’s not working, they can assign a red intervention, and that would require admin approval. And then we also have various interventions where the admin can add it, and those are gray in our category. That’s things like an attendance letter to parents, a home visit an admin has done, etc., so the staff knows, “OK, here’s what the admin’s already doing for the student.”
There may be nursing services and things like that which are happening, and they can also refer students for those types of things. If they notice a student is, perhaps, chronically absent, but it’s a student who keeps having ear infections or earaches, we have a partnership with a local doctor. If the parents are participating in that partnership, we can actually run the student to the doctor during school hours, with the parents’ permission, and make sure the kids are getting to those appointments and that we’re able to work with parents as partners in supporting that student and getting the medical attention they need so they can stay in school.
Those types of partnerships happen because we can see that data. Those types of partnerships happen because families and teachers know these are the interventions available, and they can either request them from us or we can assign them. That’s really a helpful tool.
It’s also really empowering to staff to be able to make those decisions. They’re working with the kids every day. They know what’s up.
When staff — whether it’s school and district leaders or the classroom educators — are working with parents to help them make sense of their children’s data, what are some of the most effective ways they can help them do that?
SIPE: So, my children are grown now. However, when they were younger, whatever they were experiencing seemed normal to me at the time, and wherever they were at seemed normal to me, because I wasn’t in any way comparing them to another child.
But it’s another thing to realize, “Oh, goodness. My child’s really behind in this,” because they can see that comparative data.
That helped me get more onboard when one of my children needed some interventions. And then it was very helpful for me to see those interventions work and see that child really take off as a really strong reader after those interventions. The teachers were able to show me, “Hang on, this is different than peers,” and then, “Here’s what we’re going to do about it.”
That really helped me build trust in the teachers who were supporting my child.
You mentioned your district is primarily immigrant students. When it comes to working with data and helping parents make use of that data, are there particular steps you’ve found useful for communicating data to parents whose home language might not be English?
SIPE: Graphs and charts are universal. It’s really helpful to show a family the picture of the growth trajectory, to show them the growth line of other students in that grade level in that school versus the national average versus their own student.
It’s really helpful to drive home the point of “Look how much they’ve grown” or “Wait a minute. We have real concerns.” It just really backs up what the translators are explaining to parents in those meetings. Especially when we can see those positive growth trajectories, that’s just really comforting to parents to see that their child is on track.
And even if they’re not where they need to be for achievement yet, if they’re growing at or above their peers, we know they’re going to hit that growth trajectory or that growth target, and they’re on the right trajectory. That’s good for parents to hear.
When I first stepped into my role overseeing student data for the Campbell County School District, it was clear we were working against a system that no longer served us.
At the time, we were using an outdated platform riddled with data silos and manual processes. Creating school calendars and managing student records meant starting from scratch every year. Grade management was clunky, time-consuming, and far from efficient. We knew we needed more than a patchwork fix–we needed a unified student information system that could scale with our district’s needs and adapt to evolving state-level compliance requirements.
Over the past several years, we have made a full transition to digitizing our most critical student services, and the impact has been transformational. As districts across the country navigate growing compliance demands and increasingly complex student needs, the case for going digital has never been stronger. We now operate with greater consistency, transparency, and equity across all 12 of our schools.
Here are four ways this shift has improved how we support students–and why I believe it is a step every district should consider:
How centralized student data improves support across K-12 schools
One of the most powerful benefits of digitizing critical student services is the ability to centralize data and ensure seamless support across campuses. In our district, this has been a game-changer–especially for students who move between schools. Before digitization, transferring student records meant tracking down paper files, making copies, and hoping nothing was lost in the shuffle. It was inefficient and risky, especially for students who required health interventions or academic support.
Now, every plan, history, and record lives in a single, secure system that follows the student wherever they go. Whether a student changes schools mid-year or needs immediate care from a nurse at a new campus, that information is accessible in real-time. This level of continuity has improved both our efficiency and the quality of support we provide. For districts serving mobile or vulnerable populations, centralized digital systems aren’t just convenient–they’re essential.
Building digital workflows for student health, attendance, and graduation readiness
Digitizing student services also enables districts to create customized digital workflows that significantly enhance responsiveness and efficiency. In Campbell County, we have built tools tailored to our most urgent needs–from health care to attendance to graduation readiness. One of our most impactful changes was developing unified, digital Individualized Health Plans (IHPs) for school nurses. Now, care plans are easily accessible across campuses, with alerts built right into student records, enabling timely interventions for chronic conditions like diabetes or asthma. We also created a digital Attendance Intervention Management (AIM) tool that tracks intervention tiers, stores contracts and communications, and helps social workers and truancy officers make informed decisions quickly.
These tools don’t just check boxes–they help us act faster, reduce staff workload, and ensure no student falls through the cracks.
Digitization supports equitable and proactive student services
By moving our student services to digital platforms, we have become far more proactive in how we support students–leading to a significant impact on equity across our district. With digital dashboards, alerts, and real-time data, educators and support staff can identify students who may be at risk academically, socially, or emotionally before the situation becomes critical.
These tools ensure that no matter which school a student attends–or how often they move between schools–they receive the same level of timely, informed support. By shifting from a reactive to a proactive model, digitization has helped us reduce disparities, catch issues early, and make sure that every student gets what they need to thrive. That’s not just good data management–it’s a more equitable way to serve kids.
Why digital student services scale better than outdated platforms
One of the most important advantages of digitizing critical student services is building a system that can grow and evolve with the district’s needs. Unlike outdated platforms that require costly and time-consuming overhauls, flexible digital systems are designed to adapt as demands change. Whether it’s integrating new tools to support remote learning, responding to updated state compliance requirements, or expanding services to meet a growing student population, a digitized infrastructure provides the scalability districts need.
This future-proofing means districts aren’t locked into rigid processes but can customize workflows and add modules without disrupting day-to-day operations. For districts like ours, this adaptability reduces long-term costs and supports continuous improvement. It ensures that as challenges evolve–whether demographic shifts, policy changes, or new educational priorities–our technology remains a reliable foundation that empowers educators and administrators to meet the moment without missing a beat.
Digitizing critical student services is more than a technical upgrade–it’s a commitment to equity, efficiency, and future readiness. By centralizing data, customizing workflows, enabling proactive support, and building scalable systems, districts can better serve every student today and adapt to whatever challenges tomorrow may bring.
Sara Douglas, Campbell County Schools
Sara Douglas is the District Data Leader for Campbell County Schools in Jacksboro, Tennessee.
Latest posts by eSchool Media Contributors (see all)
Two institutions, The College of New Jersey (TCNJ) and SUNY Morrisville, shared their experiences implementing the College Student Inventory (CSI) during a webinar I hosted. Both institutions found the CSI valuable for identifying at-risk students, gauging their willingness to accept help, and connecting students with relevant campus resources. The CSI’s value lies in its ability to identify students at risk, gauge their receptivity to assistance, and facilitate immediate connections to campus resources.
The College of New Jersey (TCNJ)
Jamel T. Johnson, director of the office of mentoring, retention, and success programs, spearheaded a campuswide implementation of the CSI in 2025, building on their previous use within the Educational Opportunity Fund program. Johnson aimed to increase completion rates from approximately 70% to 100%. They achieved a remarkable 93.7% completion rate and are now analyzing the data to inform targeted interventions and partnerships across campus. Johnson’sfocus is on understanding the data gleaned from the CSI to inform broader campus initiatives, signaling an ongoing process of implementation and refinement. As Johnson stated, “We’re excited about what we have seen, and we’re excited about where we’re going to be going with the assessment.”
The CSI’s Overall Risk Index showed Johnson that there was concern with commuter students. He was able to get this data in front of a team within their student affairs division whose core task is to support commuter students. “We’ve met with them and now they’re deploying different efforts to meet the needs based upon what we have seen.” Johnson is set to administer the Mid-Year Student Assessment (MYSA) and will use the data to help further their efforts for their commuter students.
When asked, “What types of early intervention strategies have you found to be most effective when guided by?” Johnson used two words “conversation versus correction”. Again, emphasizing that the CSI is not an aptitude test. Johnson did not want correction and score talk to be the first interaction his students had with his staff.
Johnson emphasized the importance of stakeholders seeing themselves reflected in the data when discussing campus collaboration. When a campus fosters collaboration and effectively utilizes its data, the positive impact on students becomes evident.
SUNY Morrisville
Brenda Oursler-White, director of assessment and accreditation and interim dean for the School of Liberal Arts, Science, and Society, implemented the CSI in fall 2023 to improve first-time, full-time student retention rates. There was a significant increase in completion rates, rising from 73% in fall 2024 to 85.3% in fall 2025. Oursler-White attributes this success to student engagement, clear messaging about the benefits of the assessment, and connecting students to resources based on their results.
SUNY Morrisville’s success was partly driven by showcasing the tangible benefits of completing the CSI, specifically the increased likelihood of returning for the spring semester compared to those who didn’t participate. Oursler-White stated, “The College Student Inventory isn’t like magic wand, meaning if you complete it, you’re going to be successful. They still have to put in the work.” With a target to improve first-time, full-time student retention rates, she expressed that a key challenge was securing buy-in from faculty, staff, administration, and students.
When asked, “What types of early intervention strategies have you found to be most effective?” Oursler-White’s response was similar to Johnson’s. She put an emphasis on using the word ranking rather than score and working with the student to interpret their results. The student saw 65% and thought of it as a letter grade. When in reality they were above the national norm and at the 65th percentile. It was important to have clear communication and to allow the student to learn more about themselves while building a relationship and a sense of belonging. Oursler-White took it upon herself to hand out over 600 student reports, meeting within the classroom to work with students hand-in-hand with their results and next steps.
Boost student success through motivational assessment
We are grateful to these two campuses for sharing their experiences to assist others with understanding how the data can best be utilized on campus. If you are interested in learning more, download the webinar recording.
To explore next steps and discover how the College Student Inventory (CSI) can impact retention and student success efforts, ask for a walkthrough or please reach out to me via email.
A Conversation With West Virginia University Foundation’s Kristen Shipp
Special thanks:It’s a privilege to support West Virginia University (WVU) Foundation’s annual giving outreach and big tent Giving Day Initiative. For almost 10 years, the WVU Day of Giving has relied on the ScaleFunder platform to power its campaign, leading to record-breaking success and a huge positive impact throughout the WVU community. The Foundation has also used the RNL360 report to establish a starting point for the strategic planning, link their wide-reaching fundraising efforts to major donations, and identify actions that can be implemented right away to boost the performance of their annual giving program.
Our work in the advancement and nonprofit space feels pretty unsettled these days. There’s no shortage of uncertainty and daily headlines that often add to the confusion and concern. Navigating the distractions is hard and can be exhausting.
What helps cut through the noise and keeps us focused on the work at hand? Our answer is data. Specifically, our RNL360 analytics report has proven to be an invaluable resource. Maybe it’s strange to think of data as a friend, but it can be a source of comfort, creating a little calm and providing clarity and guidance as we do our best to deliver for the people and communities we serve.
We developed the RNL360 to illustrate historic and current giving trends. The report highlights metrics you would expect, including donor retention, consistency, path to major giving, and behaviors by generation. It offers important context for leaders and stakeholders, especially those new to or outside the advancement field. Insights from the analysis help shape our work with client partners. Whether it’s development of the fiscal year plan, segmentation, revisiting ask arrays or identifying priority donors for higher touch outreach. The “readout” also brings colleagues from across campus together for a better understanding of the general fundraising landscape and relevant, institution-specific trends.
Focus on what’s actionable
Kristin Shipp
At a time when resources are stretched and the stakes are high, RNL360 is used to inform both strategic planning and practical execution—it’s designed to provide specific takeaways and identify donors who should be prioritized.
We just wrapped up a report with our partners at West Virginia University Foundation (WVUF). We learned a lot, and asked Kristen Shipp, the Foundation’s executive director of annual giving, to weigh in and share her valuable perspective.
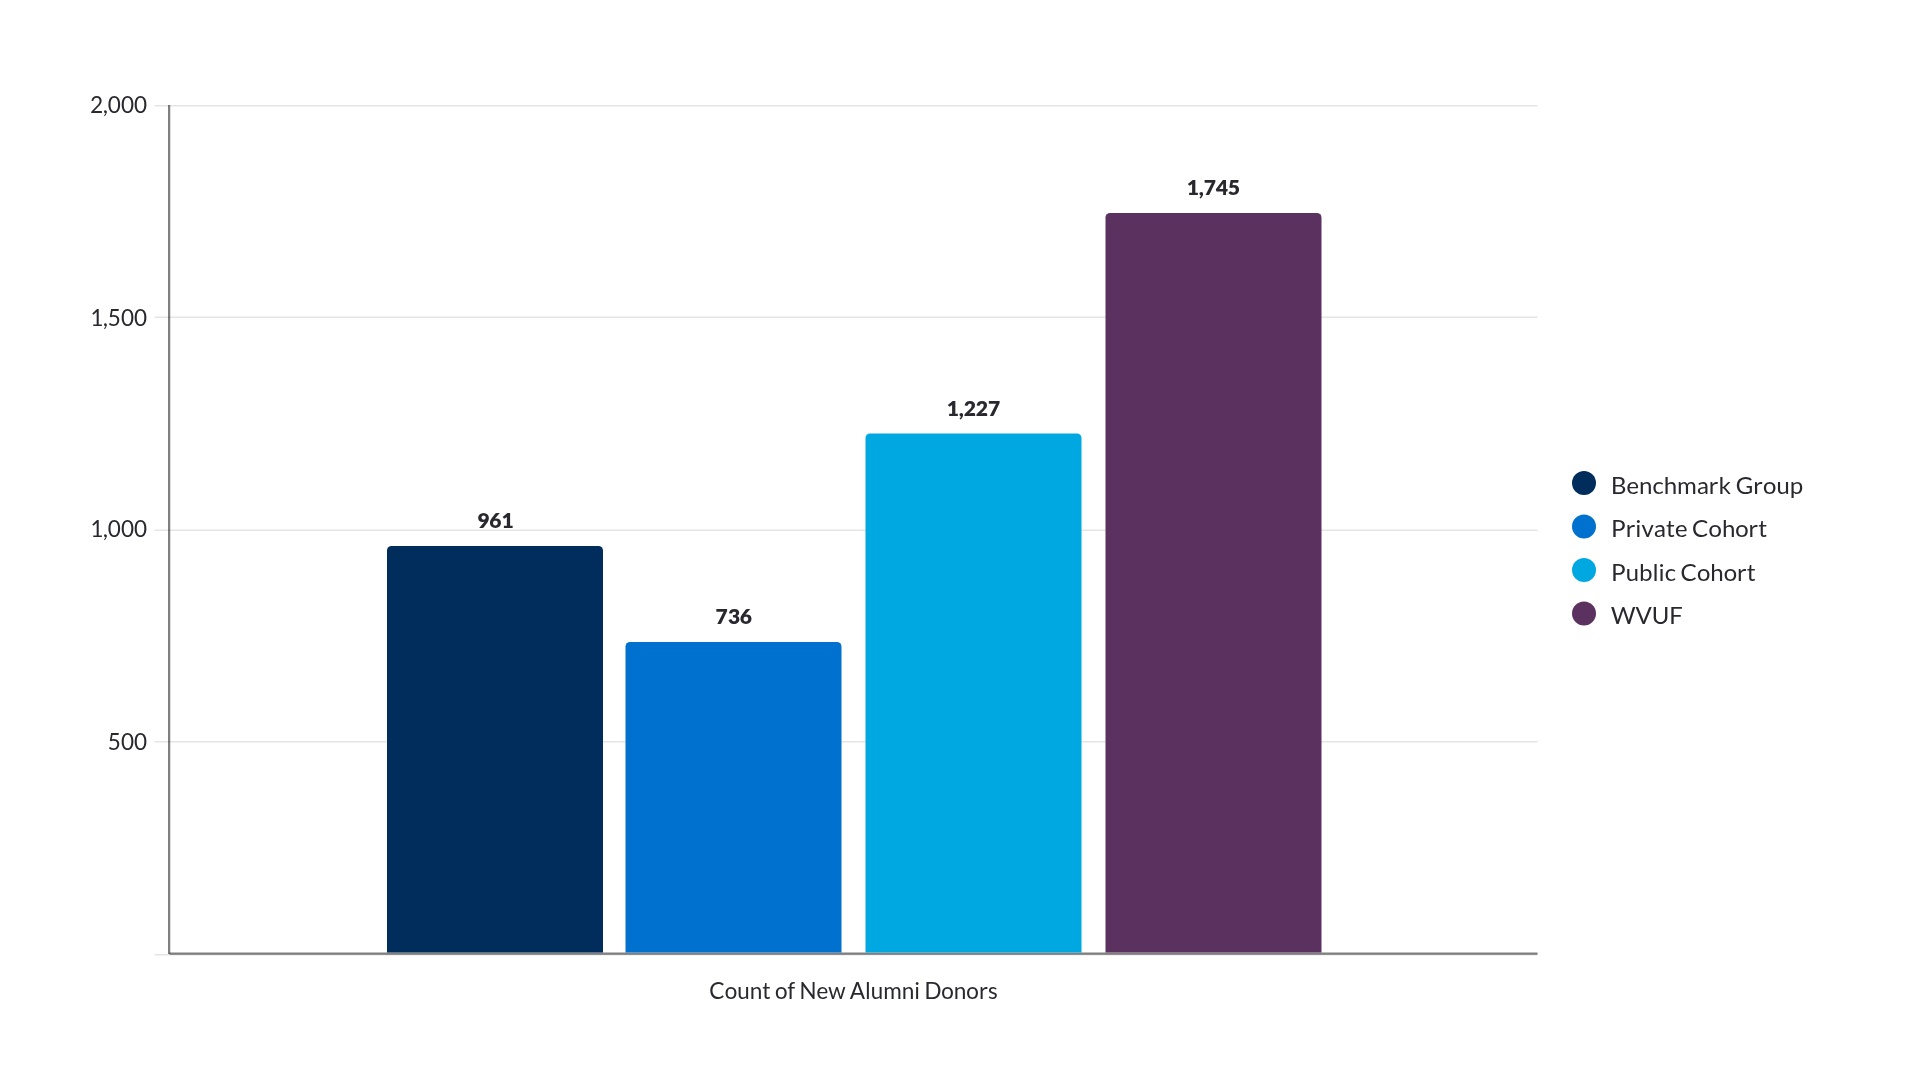
Success in bringing (and keeping) new donors on board
WVUF’s count of 1,745 new alumni donors last fiscal year was well ahead of the benchmark group and the Foundation also received first-time gifts from an impressive count of more than 5,000 family and friends.
Q: As you think about acquisition, what’s working for you? What are the campaigns or messages that actually convert?
Kristen Shipp: WVU Day of Giving has been one of the key drivers in acquiring new donors. Each participating group is highly engaged on social media and takes full advantage of the challenges to inspire alumni and friends to give. Another effective strategy is peer-to-peer fundraising, which allows individuals to promote specific initiatives within their own networks, creating a more personal and powerful connection to the cause.
Q: How are you approaching stewardship with new donors?
KS: Our donor engagement team leads first-time donor stewardship by sending personalized messages through ThankView. This has been an effective stewardship strategy that has helped us strengthen donor retention. Overall rates have improved since our last RNL360, and retention among new alumni donors is up more than ten points.
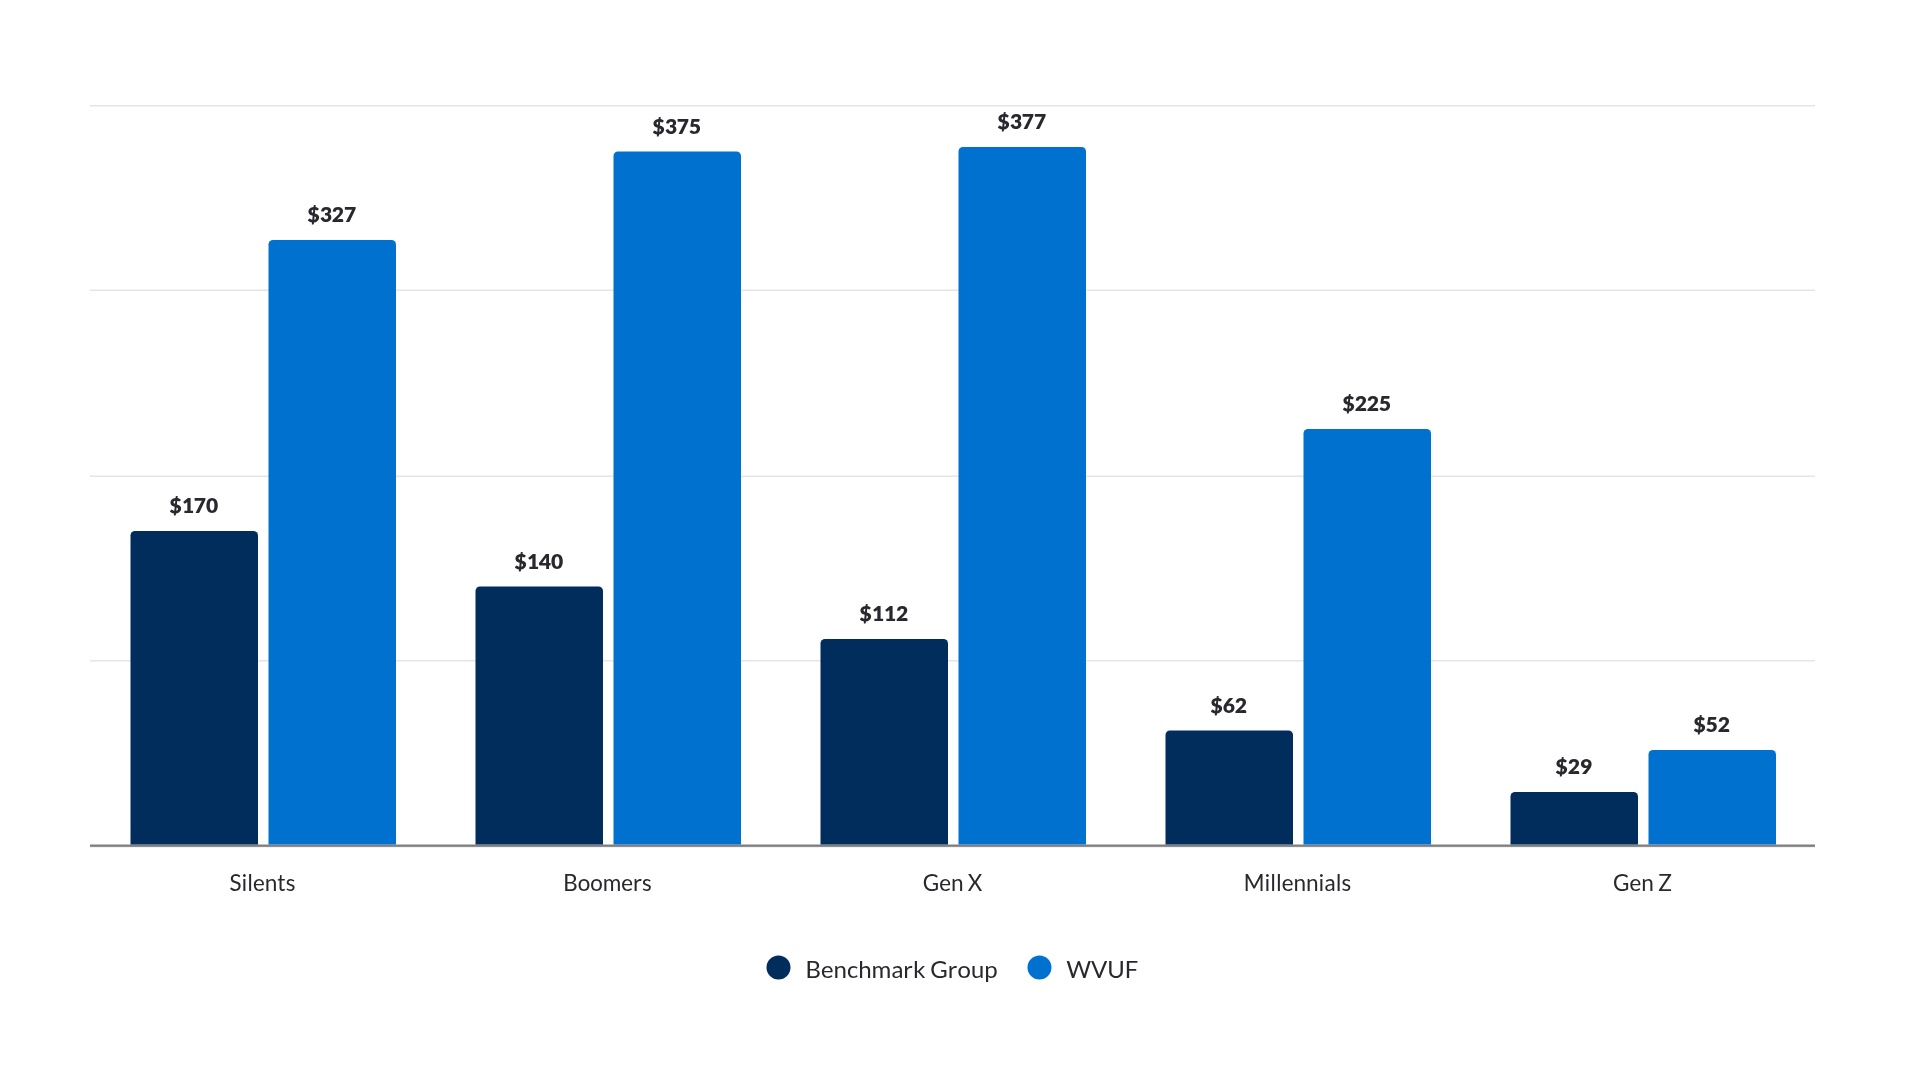
Median gifts on the rise
We know that while younger generations are philanthropic, and many have capacity to make bigger gifts, most are directing their philanthropy elsewhere—giving to other causes and charities. WVUF has increased median gift amounts across all generations.
Q: Are there one or two strategies you’ve found successful in driving movement with gift amounts? Any that are especially effective with younger generations?
KS: While the area of greatest need will always remain a priority, we also strive to provide opportunities throughout the year for alumni and donors to give to areas that align with their personal interests. Through our recent alumni survey, fielded by RNL, we learned that many are particularly interested in supporting mental health services, the student emergency fund, and initiatives that assist first-generation students. These priorities are featured in WVU Day of Giving, and we also leverage crowdfunding and peer-to-peer fundraising to raise awareness and support for these important areas.
Practical, real-world application
Loyal donors = At least five years of consecutive giving. New donors = No gift history or no giving in the last decade.
Q: Can you share a couple of specific ways that you are using the RNL360 outputs? Is the data helpful across teams and departments?
KS: Through RNL360, we learned that in FY25, 44% of our individual donors were alumni. This reinforces the importance of developing audience-focused strategies for our annual giving campaigns to ensure our messaging resonates with both alumni and non-alumni donors. Another helpful insight was the number of new alumni donors—only 30% were graduates from the last decade. This highlights the need to better connect recent graduates with causes they’re passionate about and to engage them through the communication channels they prefer.
Keeping the faith and focus
Q: Circling back to the unsettling times…you’ve experienced a lot of change at WVU and the Foundation. What helps you reduce the noise and stay focused? Anything professionally or personally that helps keep you positive and motivated?
KS: There have been many changes at WVU and the WVU Foundation, but with change comes new opportunity. I feel incredibly fortunate to be expanding the Annual Giving team by welcoming new staff members. It’s exciting to build a team that shares the same vision, drive, and passion—and to have fun together along the way. I like to keep things light and engaging, so whenever the moment allows, you’ll probably catch me sharing a funny movie quote or GIF with my teammates.
Ready to increase engagement with your donors?
Reach out to us today, and we’ll set up a time to discuss your best fundraising strategies. Our strategists can discuss how to optimize your fundraising strategies with the right data, how you can have a great Giving Day, and much more.