Bryce Loo, Associate Director of Higher Education Research
Part 1: Understanding the Types of Sources and Their Differences
There has perhaps never been more of a need for data on globally mobile students than now. In 2024, there were about 6.9 million international students studying outside their home countries, a record high, and the number is projected to grow to more than 10 million by 2030. Nations all around the world count on global student mobility for a number of reasons: Sending nations benefit by sending some of their young people abroad for education, particularly when there is less capacity at home to absorb all demand. Many of those young people return to the benefit of the local job market with new skills and knowledge and with global experience, while others remain abroad and are able to contribute in other ways, including sending remittances. Host nations benefit in numerous ways, from the economic contributions of international students (in everything from tuition payments to spending in the local economy) to social and political benefits, including building soft power.
At the same time, economic, political, and social trends worldwide challenge the current ecosystem of global educational mobility. Many top destinations of international students, including Canada and the United States, have developed heavily restrictive policies toward such students and toward migrants overall. The COVID-19 pandemic demonstrated that one global challenge can upend international education, even if temporarily.
Data plays a key role in helping those who work in or touch upon international education. All players in the space—from institutional officials and service providers to policymakers and researchers—can use global and national data sources to see trends in student flows, as well as potential changes and disruptions.
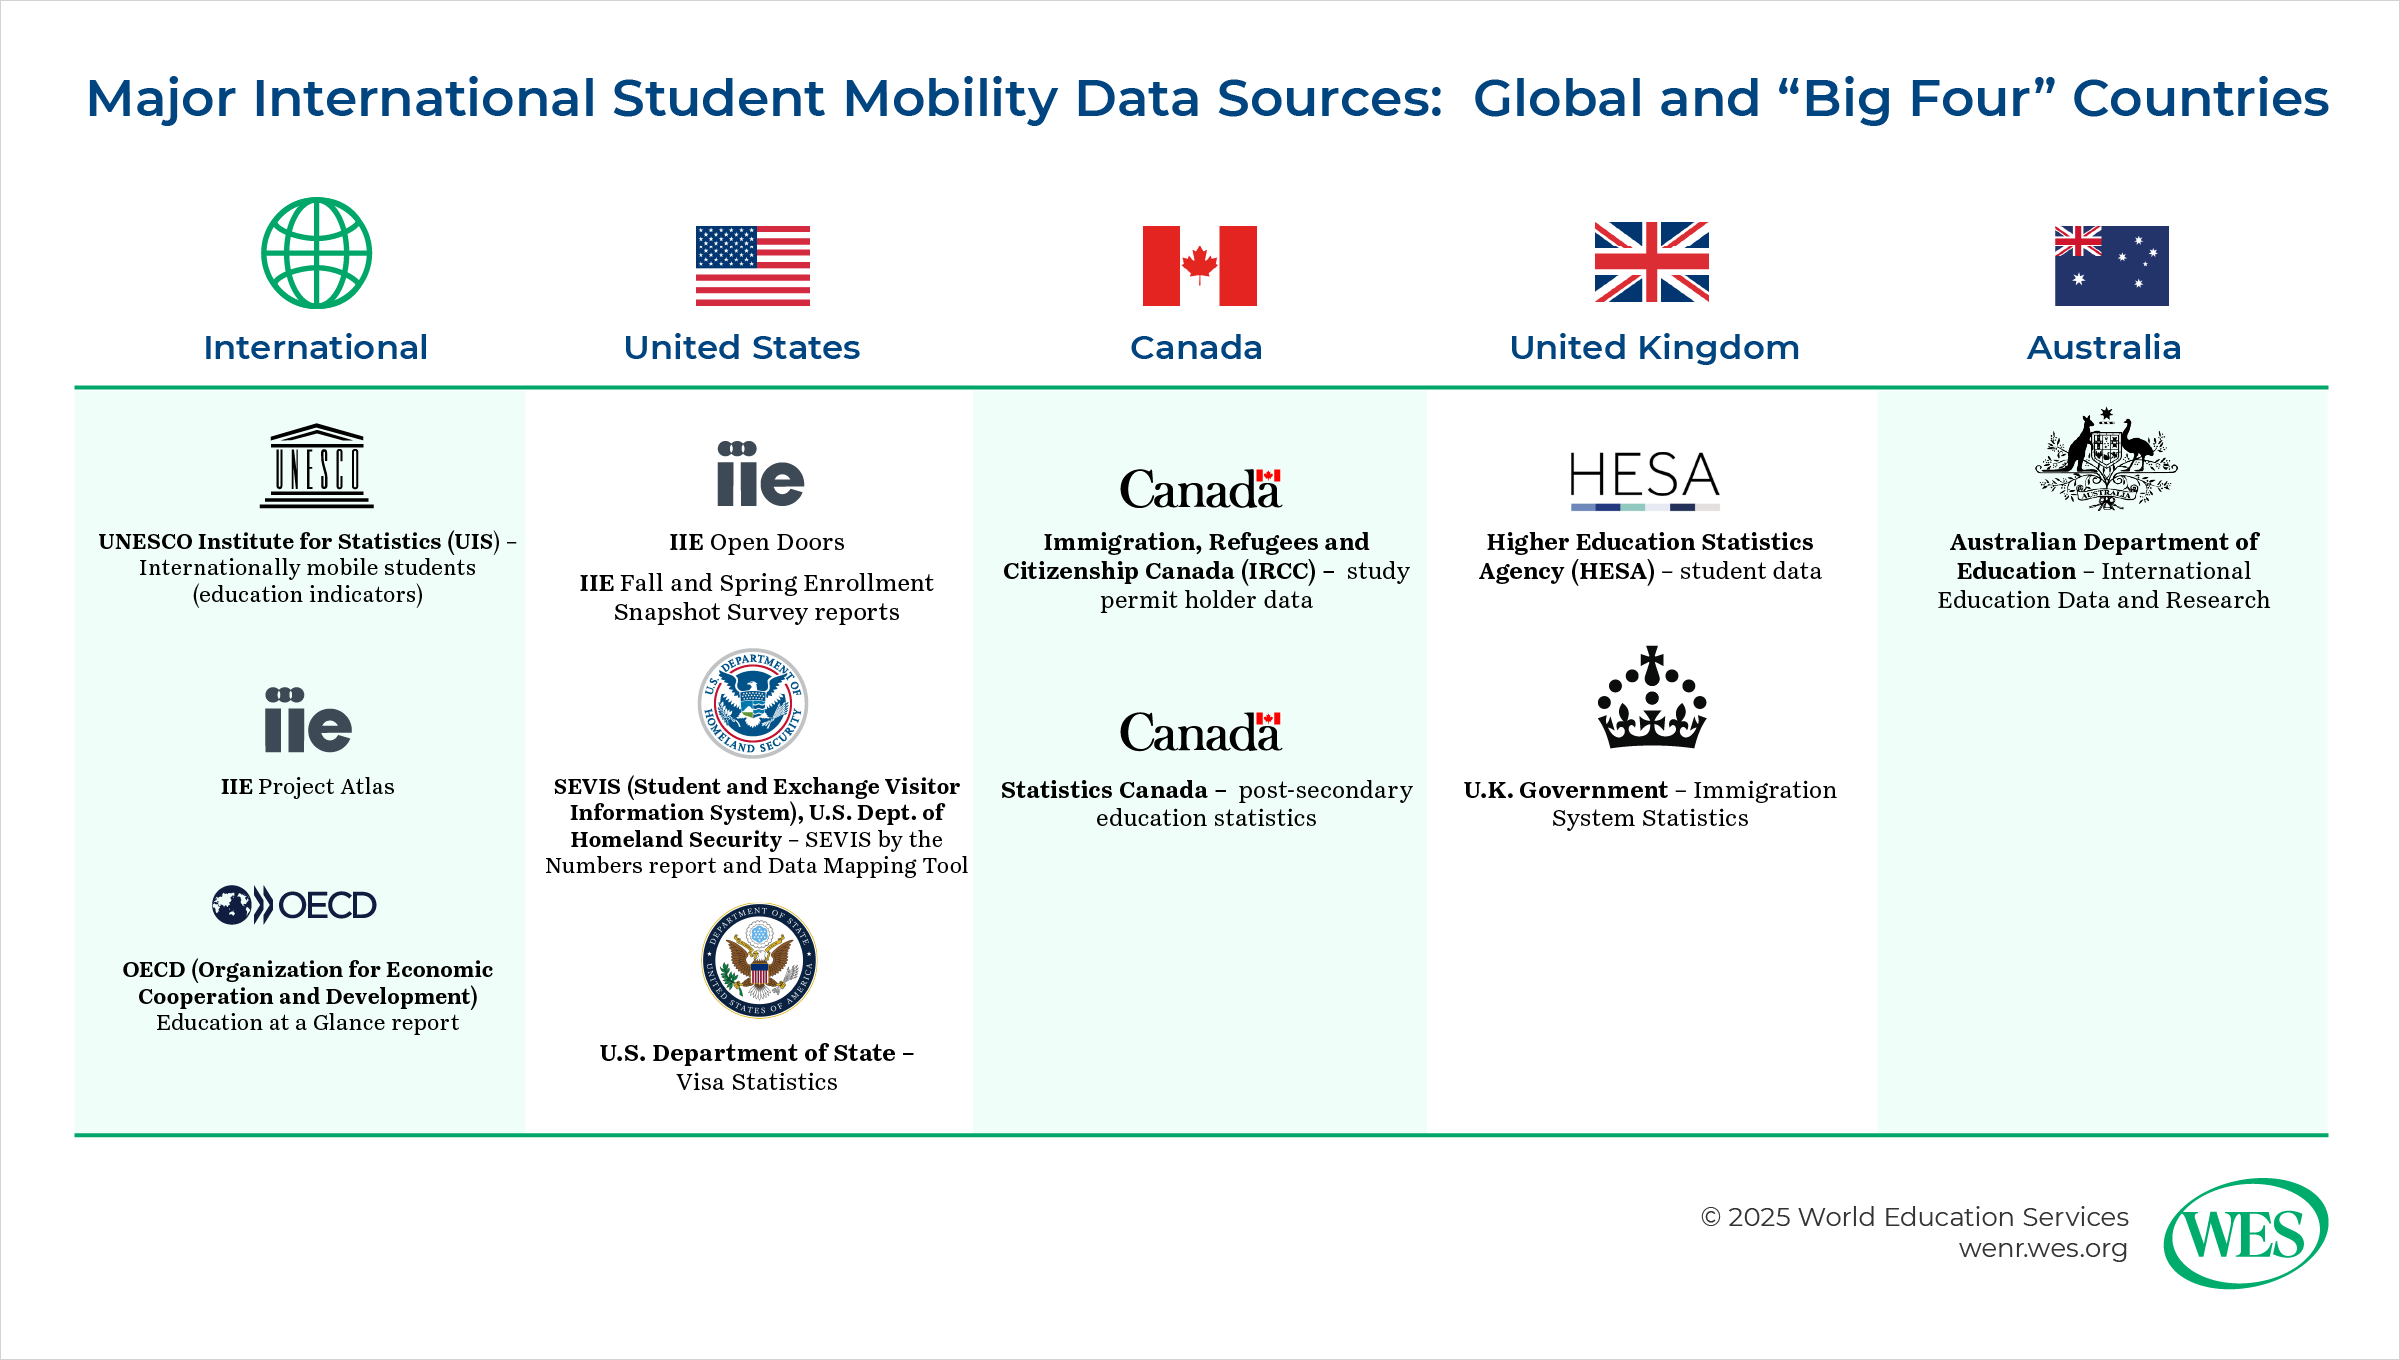
This article is the first in a two-part series exploring global student mobility data. In this first article, I will delve into considerations that apply in examining any international student data source. In the second, forthcoming article, we will examine some of the major data sources in global student mobility, both global and national, with the latter focused on the “Big Four” host countries: the United States, Canada, the United Kingdom, and Australia.
In utilizing any global student mobility data source, it is crucial to understand some basics about each source. Here are some key questions to ask about any source and how to understand what each provides.
Who collects the data?
There are three main types of entities that collect student mobility data at a national level:
- Government ministries or agencies: These entities are generally mandated by law or statute to collect international student data for specific purposes. Depending on the entity’s purview, such data could include student visa or permit applications and issuances, students arriving at ports of entry (such as an airport or border crossing), enrollment in an educational institution, or students registered as working during or after completing coursework.
- Non-governmental organizations (NGOs): Non-profit entities focused on international education or related fields such as higher education or immigration may collect international student data, sometimes with funding or support from relevant government ministries. One good example is the Institute of International Education (IIE) in the U.S., which has collected data on international students and scholars since 1948, much of that time with funding and support from the U.S. Department of State.
- Individual institutions: Of course, individual universities and colleges usually collect data on all their students, usually with specific information on international students, sometimes by government mandate. In countries such as the U.S. and Canada, these institutions must report such data to governmental ministries. They may also choose to report to non-governmental agencies, such as IIE. Such data may or may not otherwise be publicly available.
At the international level, the main data sources are generally an aggregation of data from national sources. There are three main efforts:
How are the data collected?
The method in which mobility data are collected affects the level of accuracy of such data. The sources that collect data internationally or on multiple countries, such as UNESCO Institute for Statistics (UIS) and IIE’s Project Atlas, are primarily aggregators. They collect the data from national sources, either government ministries or international education organizations, such as the British Council or the Canadian Bureau for International Education (CBIE).
For primary data collection, there are three main methods:
- Mandatory reporting: Certain government entities collect data by law or regulation. Data are naturally collected as part of processing and granting student visas or permits, as the S. State Department and Immigration, Refugees and Citizenship Canada (IRCC) do. In other cases, postsecondary institutions are required to track and report on their international students—from application to graduation and sometimes on to post-graduation work programs. This is the case in the U.S. through SEVIS (the Student and Exchange Visitor Information System), overseen by the U.S. Department of Homeland Security (DHS), through which deputized institutional officials track all international students. The data from this system are reported regularly by DHS. In other cases, data are collected annually, often through a survey form, as Statistics Canada does through its Postsecondary Student Information System (PSIS).
- Census: Some non-profit organizations attempt to have all postsecondary institutions report their data, often through an online questionnaire. This is the method by which IIE obtains data for its annual Open Doors Report, which tracks both international students in the U.S. and students enrolled in U.S. institutions studying abroad short-term in other countries.
- Survey: A survey gathers data from a sample, preferably representative, of the overall population—in this case, higher education institutions—to form inferences about the international student population. (This should not be confused with the “surveys” issued by government agencies, usually referring to a questionnaire form, typically online nowadays, through which institutions are required to report data.) This method is used in IIE’s snapshot surveys in the fall and spring of each year, intended to provide an up-to-date picture of international student enrollment as a complement to Open Doors, which reflects information on international students from the previous academic year.
When are the data collected and reported?
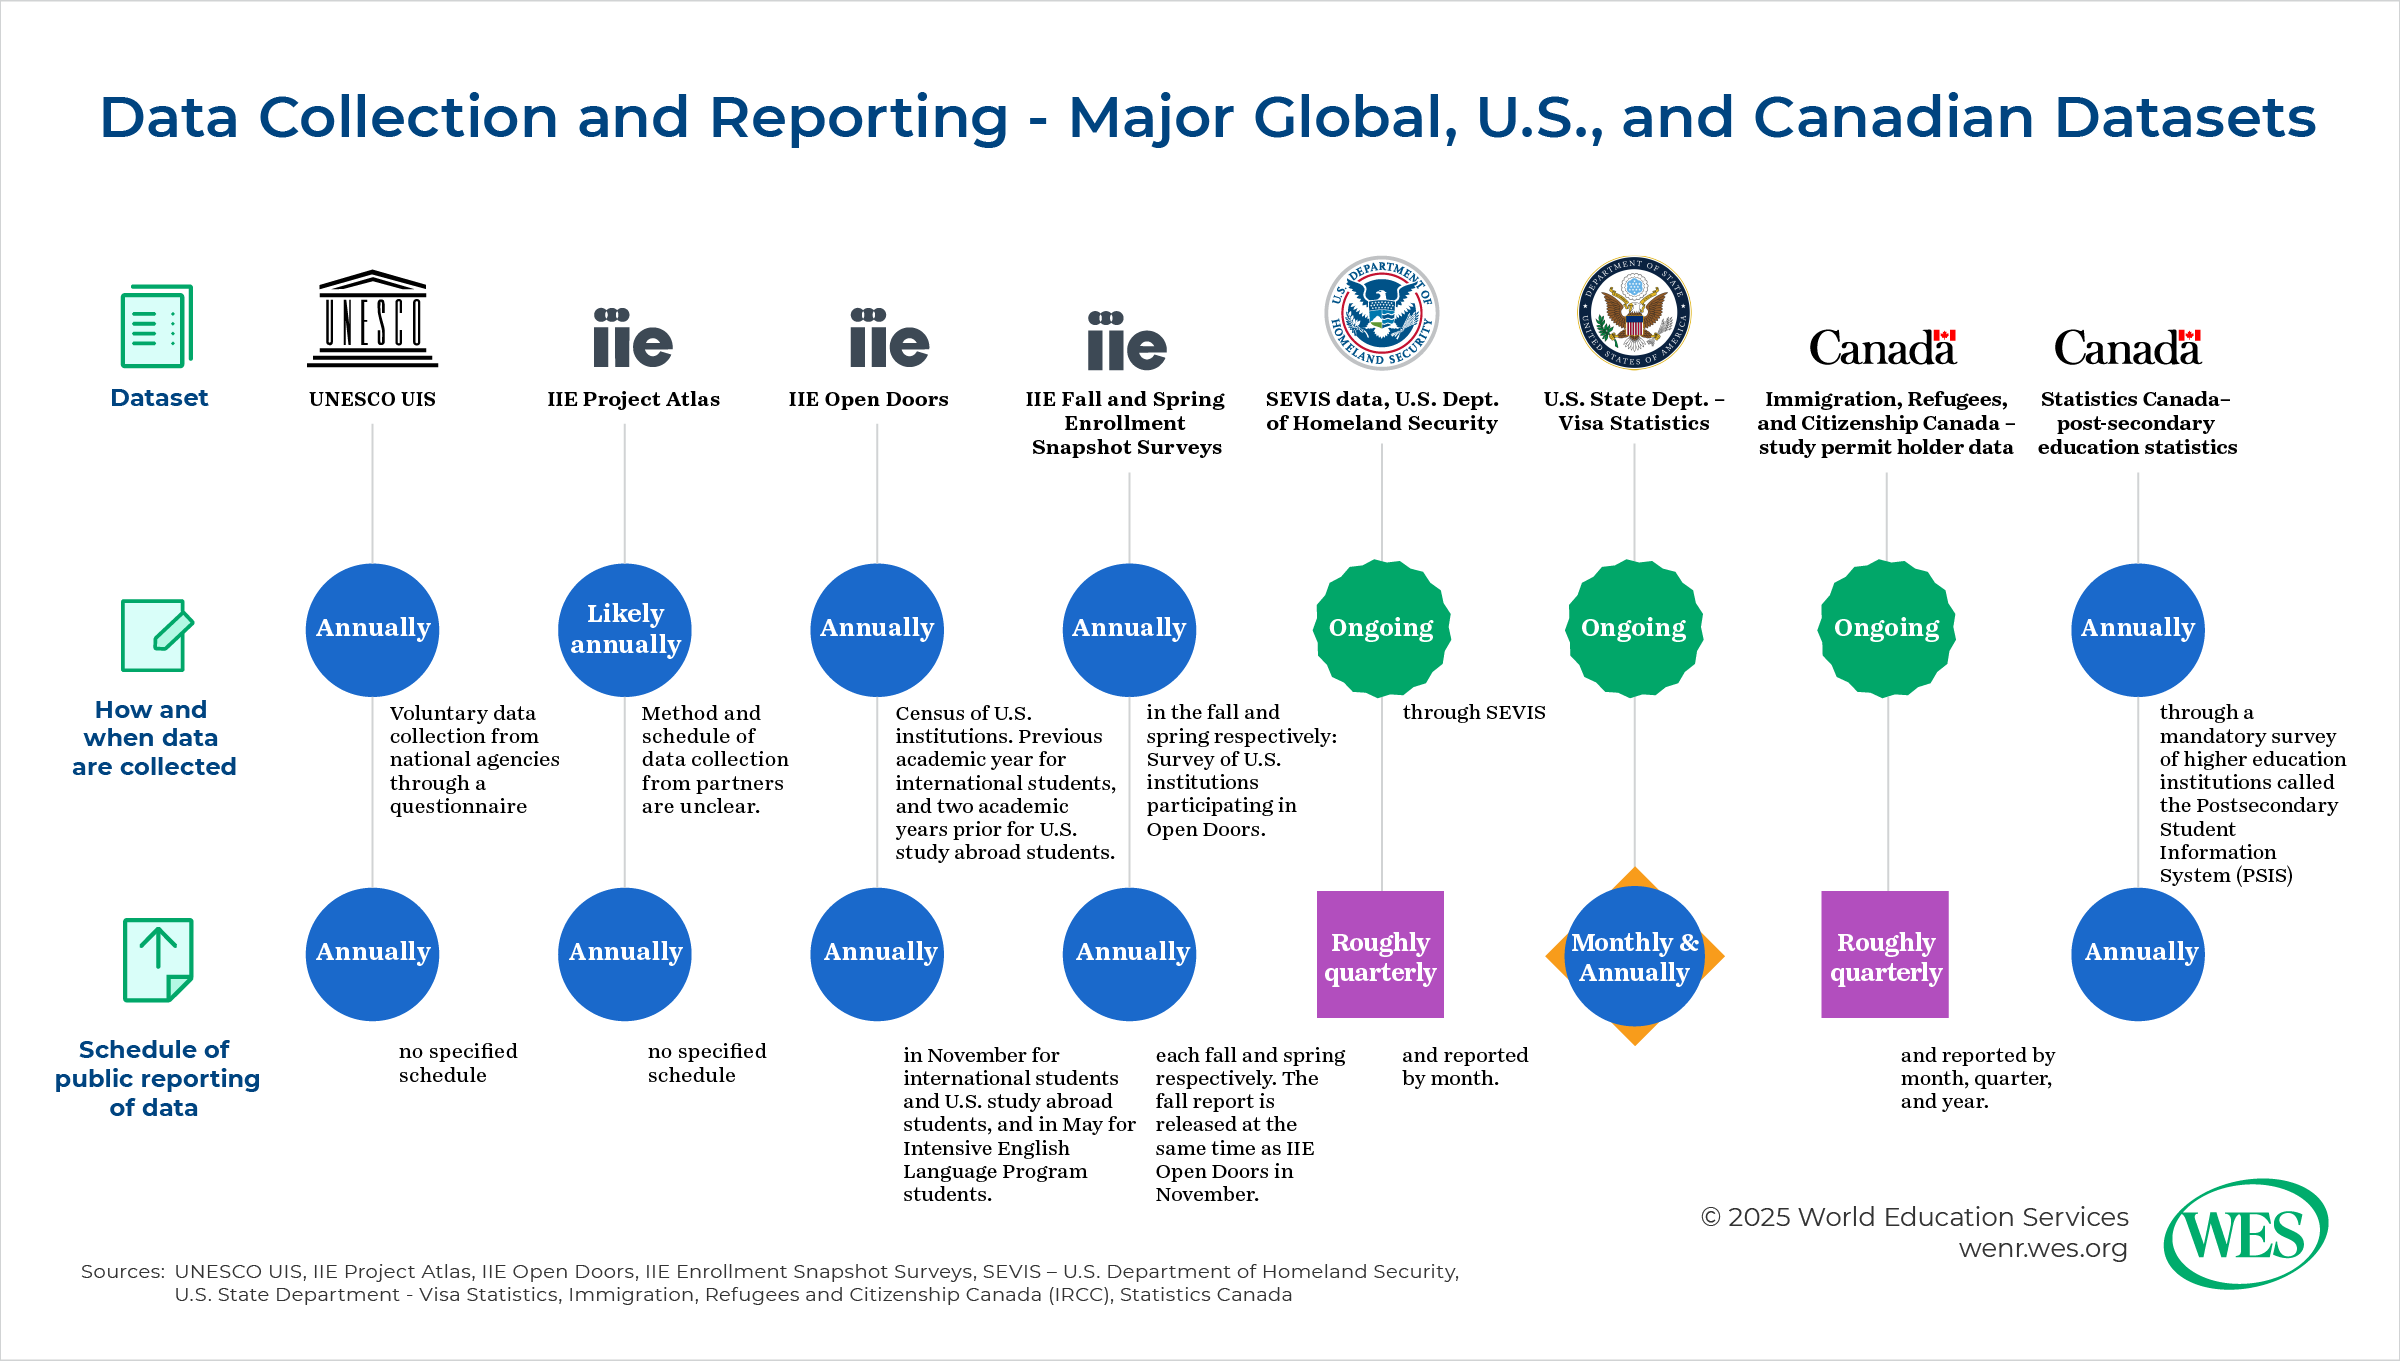
In considering data sources, it is important to know when the data were collected and what time periods they reflect. Government data sources are typically the most up-to-date due to their mandatory nature. Data are often collected continuously in real time, such as when a student visa is approved or when an international student officially starts a course of study. However, each ministry releases data at differing intervals. Australia’s Department of Education, for example, is well known for releasing new data almost every month. USCIS and IRCC tend to release data roughly quarterly, though both provide monthly breakdowns of their data in some cases.
Non-governmental entities generally do not collect data continuously. Instead, they may collect data annually, semiannually, or even less frequently. IIE’s Open Doors collects data annually for the previous academic year on international students and two years prior on U.S. study abroad students. The results for both are released every November.
The international aggregated sources receive data from national sources at widely varying times. As a result, there can be gaps in data, making comparison between or among countries challenging. Some countries don’t send data at all, often due to lack of resources for doing so. Even major host countries, notably China, send little if any data to UNESCO.
What type of student mobility data are included in the source?
Sources collect different types of student mobility data. One such breakdown is between inbound and outbound students—that is, those whom a country hosts versus those who leave the country to go study in other countries. Most government sources, such as IRCC, focus solely on inbound students—the international students hosted within the country— due to the organizations’ mandate and ability to collect data. Non-governmental organizations, such as IIE, often attempt to capture information on outbound (or “study abroad”) students. Many international sources, such as UNESCO UIS, capture both.
Another important breakdown addresses whether the data included degree-seekers, students studying abroad for credit back home, or those going abroad not explicitly for study but for a related purpose, such as research or internships:
- Degree mobility: captures data on students coming into a country or going abroad for pursuit of a full degree.
- Credit mobility: captures information on those abroad studying short-term for academic credit with their home institution, an arrangement often called “study abroad” (particularly in the U.S. and Canada) or “educational exchange.” The length of the study abroad opportunity typically can last anywhere from one year to as little as one week. Short-duration programs, such as faculty-led study tours, have become an increasingly popular option among students looking for an international experience. In most cases, the home institution is in the student’s country of origin, but that is not always the case. For example, a Vietnamese international student might be studying for a full degree in the U.S. but as part of the coursework studies in Costa Rica for one semester.
- Non-credit mobility: captures information on those who go abroad not for credit-earning coursework but for something highly related to a degree program, such as research, fieldwork, non-credit language study, an internship, or a volunteer opportunity. This may or may not be organized through the student’s education institution, and the parameters around this type of mobility can be blurry.
It’s important to know what each data source includes. Most governmental data sources will include both degree and credit mobility—students coming to study for a full degree or only as part of a short-term educational exchange. The dataset may or may not distinguish between these students, which is important to know if the distinction between such students is important for the data user’s purposes.
For outbound (“study abroad”) mobility, it’s easier for organizations to track credit mobility rather than degree mobility. IIE’s Open Doors, for example, examines only credit mobility for outbound students because it collects data through U.S. institutions, which track their outbound study abroad students and help them receive appropriate credits for their work abroad once they return. There is not a similar mechanism for U.S. degree-seekers going to other countries. That said, organizations such as IIE have attempted such research in the past, even if it is not an ongoing effort. Typically, the best way to find numbers on students from a particular country seeking full degrees abroad is to use UNESCO and sort the full global data by country of origin. UNESCO can also be used to find the numbers in a specific host country, or, in some cases, it may be better to go directly to the country’s national data source if available.
Non-credit mobility has been the least studied form of student mobility, largely because it is difficult to capture due to its amorphous nature. Nevertheless, some organizations, like IIE, have made one-off or periodic attempts to capture it.
Who is captured in the data source? How is “international student” defined?
Each data source may define the type of globally mobile student within the dataset differently. Chiefly, it’s important to recognize whether the source captures only data on international students in the strictest sense (based on that specific legal status) or on others who are not citizens of the host country. The latter could include permanent immigrants (such as permanent residents), temporary workers, and refugees or asylum seekers. The terms used can vary, from “foreign student” to a “nonresident” (sometimes “nonresident alien”), as some U.S. government sources use. It’s important to check the specific definition of the students for whom information is captured.
Most of the major student mobility data sources capture only data on international students as strictly defined by the host country. Here are the definitions of “international student” for the Big Four:
- United States: A non-immigrant resident holding an F-1, M-1, or certain types of J-1 (The J-1 visa is an exchange visa that includes but is not limited to students and can include individuals working in youth summer programs or working as au pairs, for example.)
- Canada: A temporary resident holding a study permit from a designated learning institution (DLI)
- United Kingdom: An individual on a Student visa
- Australia: An individual who is not an Australian citizen or permanent resident or who is not a citizen of New Zealand, studying in Australia on a temporary visa
Some countries make a distinction between international students enrolled in academic programs, such as at a university, versus those studying a trade or in a vocational school; there might also be distinct categorization for those attending language training. For example, in the U.S., M-1 visas are for international students studying in vocational education programs and may not be captured in some data sources, notably Open Doors.
Understanding the terminology used for international students helps in obtaining the right type of data. For example, one of the primary methods of obtaining data on international students in Canada is through IRCC data held on the Government of Canada’s Open Government Portal. But you won’t find any such dataset on “international students.” Instead, you need to search for “study permit holders.”
Does the data source include students studying online or at a branch campus abroad, or who are otherwise physically residing outside the host country?
Some universities and colleges have robust online programs that include significant numbers of students studying physically in other countries. (This was also true for many institutions during the pandemic. As a result, in the U.S., IIE temporarily included non-U.S. students studying at a U.S. institution online from elsewhere.) Other institutions have branch campuses or other such transnational programs that blur the line between international and domestic students. So, it’s important to ask: Does the data source include those not physically present in the institution’s country? The terminology for each country can vary. For example, in Australia, where such practices are very prominent, the term usually used to refer to students studying in Australian institutions but not physically in Australia is “offshore students.”
What levels of study are included in the dataset?
The focus of this article is postsecondary education, but some data sources do include primary and secondary students (“K-12 students” in the U.S. and Canada). IRCC’s study permit holder data includes students at all levels, including K-12 students. The ministry does provide some data broken down by level of study and other variables, such as country of citizenship and province or territory.
What about data on international students who are working?
Many host countries collect data and report on international students who are employed or participating in paid or unpaid internships during or immediately after their coursework. The specifics vary from country to country depending on how such opportunities for international students are structured and which government agencies are charged with overseeing such efforts. For example, in the U.S., the main work opportunities for most international students both during study (under Curricular Practical Training, or CPT) and after study (usually under Optional Practical Training, or OPT) are overseen by the student’s institution and reported via SEVIS. IIE’s Open Doors tracks students specifically for OPT but not CPT. By contrast, the main opportunity for international students to work in Canada after graduating from a Canadian institution is through the post-graduation work permit (PGWP). Students transfer to a new legal status in Canada, in contrast with U.S.-based international students under OPT, who remain on their student visa until their work opportunity ends. As a result, IRCC reports separate data on graduate students working under the PGWP, though data are relatively scant.
At some point, students who are able to and make the choice to stay and work beyond such opportunities in their new country transition to new legal statuses, such as the H-1B visa (a specialty-occupation temporary work visa) in the U.S., or directly to permanent residency in many countries. The data required to examine these individuals varies.
What about data beyond demographics?
While most international student datasets focus on numbers and demographic breakdowns, some datasets and other related research focus on such topics as the contributions of international students to national and local economies. For example, NAFSA: Association of International Educators, the main professional association for international educators in the U.S., maintains the International Student Economic Value Tool, which quantifies the dollar amounts that international students contribute to the U.S. at large, individual states, and congressional districts. Part of the intention behind this is to provide a tool for policy advocacy in Washington, D.C., and in state and local governments.
How can I contextualize international student numbers within the broader higher education context of a country?
Many countries collect and publish higher education data and other research. Each country assigns this function to different ministries or agencies. For example, in Canada, most such data are collected and published by Statistics Canada (StatCan), which is charged with data collection and research broadly for the country. In the U.S., this function falls under the Department of Education’s National Center for Education Statistics (NCES), which runs a major higher education data bank known as IPEDS, the Integrated Postsecondary Education Data System. StatCan does provide some data on international students, while IPEDS in the U.S. reports numbers of “nonresident” students, defined as “a person who is not a citizen or national of the United States and who is in this country on a visa or temporary basis and does not have the right to remain indefinitely.” This term likely encompasses mostly those on international student visas.
I will discuss some of these higher education data sources in Part 2 of this series.
How do I learn what I need to know about each individual dataset?
Each major data source typically provides a glossary, methodology section, and/or appendix that helps users understand the dataset. In Part 2 of this series, we will examine some of the major international and national data sources, including where to locate further such information for each.
It’s critical for users of student mobility data sources to understand these nuances in order to accurately and appropriately utilize the data. In the second part of this series, we will examine several prominent data sources.