by Jon Marcus, The Hechinger Report
January 20, 2026
WATERTOWN, Mass. — Amanda Leef remembers thinking for the first time about becoming a veterinarian when she was 4 and found a garter snake in her Michigan backyard.
“I think every girl goes through a phase of wanting to be a vet,” Leef said.
For her, it wasn’t just a phase. Now, at 48, she co-owns her own bustling veterinary practice, Heal Veterinary Clinic, in this Boston suburb.
All seven veterinarians here are women. So is the large team of vet techs, and the entire rest of the 22-member medical staff.
“In really broad generalities, I think women are more interested in the emotional and empathetic side of things than men are,” Leef said, sitting on the floor of an examination room with one of her patients, an affectionate, white-furred golden retriever named Cypress.
For that and other reasons, women studying veterinary medicine now outnumber men by four to one.
It’s not just veterinary school. The number of women has surpassed the number of men in law school, medical school, pharmacy school, optometry school and dental school.
Women in the United States now earn 40 percent more doctoral degrees overall, and nearly twice as many master’s degrees, as men, according to the U.S. Department of Education — a trend transforming high-end work.
This is no longer some distant statistical abstraction. Americans can see it when they take their pets to the vet or their kids to the dentist, need a lawyer or an eye exam, see a therapist or pick up a prescription.
The dramatic shift in who is being trained for these fields is partly because more women are going into them. But it’s also the result of a steady slide in the number of men enrolling in graduate and professional schools. And while that may be elevating women, it’s affecting the nation’s economic competitiveness and even the point at which people get married and have children.
“Having all students represented and engaged in graduate study ensures that we have healthy communities and families and a vital economy,” said Chevelle Newsome, president of the Council of Graduate Schools.
Related: Interested in innovations in higher education? Subscribe to our free biweekly higher education newsletter.
Graduate schools — including the 460 Newsome represents — have their own motive for wanting more men to enroll. They’re facing new threats from declining international enrollment, impending federal borrowing limits for graduate study and a public backlash against the high cost and uneven returns of graduate degrees.
The main reason women have overtaken men in graduate school, however, is that more women than men are earning the undergraduate degrees required to go on to advanced study.
“Women certainly still see education in terms of upward mobility,” said Lisa Greenhill, chief organizational health officer at the American Association of Veterinary Medical Colleges, whose job includes trying to diversify veterinary medicine. “Men have a lot more options. They feel like they don’t have to go to a four-year program or a graduate program.”
The number of men enrolled as undergraduates in college nationwide has dropped by nearly a quarter of a million, or 4 percent, just since 2020, the National Student Clearinghouse Research Center reports.
Women now account for about 60 percent of undergraduate enrollment. Nearly half of women aged 25 to 34 have bachelor’s degrees, compared to 37 percent of men, according to the Pew Research Center.
“Men aren’t seeing higher education as valuable,” said Newsome. Many go into the trades or take other jobs straight out of high school to begin immediately earning a wage, forgoing the need to spend time in or money on college. Even men who do get undergraduate degrees may not see the value in continuing beyond them, she said.
The effects of this have been stark and swift.
The number of women earning law degrees passed the number of men in 2019, figures from the American Bar Association, or ABA, show; while only four of the law schools ranked among the 20 most prestigious by U.S. News & World Report had more women than men in 2016, women now outnumber men at 18 of them, according to the nonprofit law student news site JURIST.
Related: Trump’s attacks on DEI may hurt men in college admission
That’s already having a real-world impact. By 2020, the ABA says, the majority of general lawyers working for the federal government were women, and by 2023, the majority of associates at law firms were.
In medical schools, the number of women also overtook the number of men in 2019. Today, 55 percent of future doctors are women, up from 48 percent in 2015, according to the Association of American Medical Colleges, or AAMC.
Women already make up significantly larger proportions of residents in specialties including endocrinology, pediatrics, obstetrics and gynecology, family medicine and psychiatry.
Women also outnumber men by three to one in doctoral programs in psychology, and by nearly four to one in master’s programs, the American Psychological Association reports. They make up 55 percent of graduates of dental schools, and 72 percent in pediatric dentistry, according to the American Dental Association.
More than seven out of 10 students in schools of optometry are women, the Association of Schools and Colleges of Optometry says. And at pharmacy schools, women constitute two-thirds of students working toward master’s degrees and 56 percent of those seeking doctorates, statistics from the American Association of Colleges of Pharmacy show.
There are still more men than women in doctoral and master’s degree programs in business, engineering, math and the physical sciences. But women make up substantial majorities of graduate enrollment in health sciences, public administration, education, social and behavioral sciences and biological and agricultural sciences, according to the Council of Graduate Schools.
While this represents impressive progress for women, the declining number of men enrolling in graduate programs is bad news for universities and colleges that offer them, for some patients in the health care system and for the economy.
That’s because the growing number of women going to graduate and professional schools can’t continue forever to outpace the decline in the number of men. Total graduate enrollment at private, nonprofit colleges and universities was already down this fall, the Clearinghouse reports.
Related: Football fantasy: Colleges add sports to bring men, but it doesn’t always work
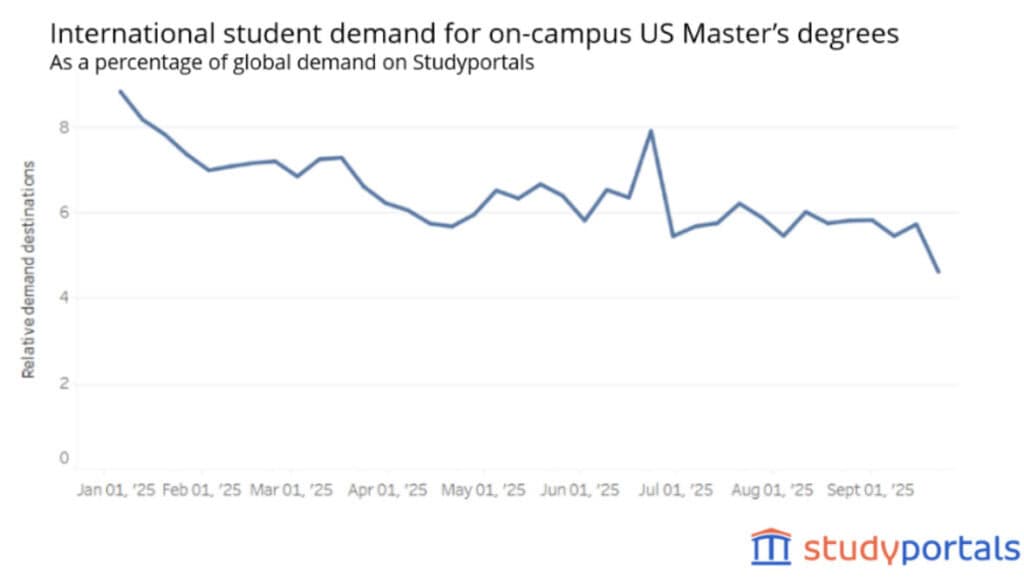
That’s a problem made worse by visa restrictions and cuts to federal research funding, which have helped reduce the number of international students coming to the United States for graduate study by 12 percent, according to the Institute of International Education.
New federal loan limits scheduled to take effect next year are widely expected to further eat into graduate school enrollment. The changes will cap borrowing at $100,000 for graduate students and $200,000 for those in professional programs. That’s much less than the $408,150 the AAMC says it costs to get a medical degree from a private, nonprofit university or the $297,745 from a public one. The association of medical colleges projects a national shortage of as many as 124,000 physicians by 2034.
The price of getting a graduate degree has more than tripled since 2000, according to the Georgetown University Center on Education and the Workforce. Graduate degrees have become a critical revenue source for universities, which take in about $20 billion a year from master’s programs alone, a separate analysis, by the right-leaning think tank the American Enterprise Institute, calculates.
Students of all genders are increasingly questioning the return on that investment. Nearly 40 percent of prospective graduate students say graduate programs that cost more than $10,000 a year are too expensive, a new survey by the enrollment management consulting firm EAB finds. Payoffs vary widely, making some graduate degrees “a potentially high-risk investment,” the Georgetown Center on Education and the Workforce has concluded.
The proportion of Americans 25 and older with master’s degrees or higher has fallen since 2000, from first in the world to 24th, according to the World Bank, while the percentage of those with doctoral degrees has dropped during that period from first to seventh.
“That is a huge concern, when you think about where economies are going,” said Claudia Buchmann, an Ohio State University sociologist who studies this issue and is coauthor of the book “The Rise of Women.” “If we’re trying to compete on a global level, the fact that men’s college-going rates are so stagnant means we can’t fix this problem until we get more men.”
Related: Even as women outpace men in graduating from college, their earnings remain stuck
Men are, after all, half the nation’s labor force. And while some graduate degrees may not pay off, many of them do, substantially. People with advanced degrees are also much less likely to be unemployed.
“When you think about global economic competitiveness for the United States — despite the skepticism that’s out there — education and training are still the keys to good jobs,” Buchmann said. Falling behind by that measure “is doing damage to men in this country.”
But experts worry that the gender shift is self-perpetuating. Men may be put off by what they see as the “feminization” of professions in which they now are the minority, research by the veterinary medical colleges association concluded.
“I’m not seeing a national effort to say we need to change this,” Buchmann said. “If anything, the opposite is true.”
Graduate school leaders say the most effective efforts at reversing this trend are at the undergraduate level. “A lot of the effort from the graduate community has been to reach down and support those projects,” said Newsome, who was formerly dean of graduate studies at California State University, Sacramento. Universities also are encouraging employers to sponsor graduate education for male employees, she said.
The effects of this widening gender divide are not just economic. New studies show that growing gender disparities in education can affect relationships. Marriage rates have fallen as levels of education rise, according to research from Iowa State University; each additional year of schooling reduces by about 4 percentage points the likelihood that someone between 25 and 34 is married. The proportion of Americans in that age bracket who are married has declined from 80 percent in 1970 to 38 percent today.
Related: Universities and colleges search for ways to reverse the decline in the ranks of male students
“When folks are looking for partners, there’s a desire to find someone economically comparable,” said Greenhill, of the veterinary medical colleges association. Added Buchmann, at Ohio State: “A lot of masculine norms are about being the breadwinner of the family. If the woman is the principal breadwinner, that presents not just economic challenges, but challenges to make marriages work.”
More-educated women are also more likely to delay or forgo having children, according to separate research from the Wharton School of Business at the University of Pennsylvania.
Back at her veterinary clinic, Amanda Leef makes the rounds, checking in on a dog getting his teeth cleaned and a pair of kittens waiting to be adopted.
Only one male veterinarian has ever applied to work there, Leef said. He was hired, but eventually left to go into research.
“It does change the personality of a clinic” to be made up of only women, she said. “A staff that’s diverse is more accessible to a broader range of people. I just think the world is better with greater gender diversity.”
Contact writer Jon Marcus at 212-678-7556, [email protected] or jpm.82 on Signal.
This story about higher education and men was produced by The Hechinger Report, a nonprofit, independent news organization focused on inequality and innovation in education. Sign up for our higher education newsletter. Listen to our higher education podcast.
This <a target=”_blank” href=”https://hechingerreport.org/women-far-outnumber-men-in-law-school-med-school-vet-school-and-other-professional-programs/”>article</a> first appeared on <a target=”_blank” href=”https://hechingerreport.org”>The Hechinger Report</a> and is republished here under a <a target=”_blank” href=”https://creativecommons.org/licenses/by-nc-nd/4.0/”>Creative Commons Attribution-NonCommercial-NoDerivatives 4.0 International License</a>.<img src=”https://i0.wp.com/hechingerreport.org/wp-content/uploads/2018/06/cropped-favicon.jpg?fit=150%2C150&ssl=1″ style=”width:1em;height:1em;margin-left:10px;”>
<img id=”republication-tracker-tool-source” src=”https://hechingerreport.org/?republication-pixel=true&post=114073&ga4=G-03KPHXDF3H” style=”width:1px;height:1px;”><script> PARSELY = { autotrack: false, onload: function() { PARSELY.beacon.trackPageView({ url: “https://hechingerreport.org/women-far-outnumber-men-in-law-school-med-school-vet-school-and-other-professional-programs/”, urlref: window.location.href }); } } </script> <script id=”parsely-cfg” src=”//cdn.parsely.com/keys/hechingerreport.org/p.js”></script>