On his website, antizionist.net, Ramsi Woodcock asks fellow legal scholars to sign a “Petition for Military Action Against Israel.” He says Israel is a colony and war is needed to decolonize, and he calls for the war to continue until “Israel has submitted permanently and unconditionally to the government of Palestine everywhere from the Jordan River to the Mediterranean Sea.”
In his lawsuit, filed Thursday in U.S. District Court for the Eastern District of Kentucky, Woodcock asks a judge to order the university and top officials to restore his normal teaching and other duties, allow him back into the College of Law building, end the university’s investigation of him, and pay monetary damages. But he also asks the judge to order Education Secretary Linda McMahon to “refrain from requiring or using” the controversial International Holocaust Remembrance Alliance definition of antisemitism when enforcing Title VI of the Civil Rights Act of 1964.
The IHRA says antisemitism “might include the targeting of the state of Israel,” “comparisons of contemporary Israeli policy to that of the Nazis” or claims “that the existence of a State of Israel is a racist endeavor.” Earlier this year, Kentucky state lawmakers ordered public universities to use the IHRA definition in their policies combating antisemitism. Woodcock is also asking the judge to declare that that order violates the First Amendment.
His lawsuit alleges the state and federal actions are related to his “suspension,” saying the university’s tolerance of his speech “ended in summer 2025” after the federal government threatenedto withdraw funding from universities and moved to enforce the IHRA definition. He also cited the passage of thestate legislation that “enabled and pressured administrators to suppress speech critical of Israel and Zionism.”
The Education Department didn’t respond to requests for comment Friday. A university spokesperson said Woodcock hasn’t been suspended but was “reassigned pending the outcome of an investigation,” adding that the university will be “limited in our comments while that investigation is ongoing.”
In an email to Inside Higher Ed, Woodcock responded, “Israel is a colonization project that practices apartheid and is currently exterminating two million Palestinians in Gaza. The scandal is not that I am calling for immediate military action to end Israel but that the university is willing to violate our nation’s constitution in order to preserve Israel. Every American scholar has a First Amendment right to oppose Israel and I look forward to holding the university accountable for breaking the law.”
In polls and focus groups across the country, Reform voters have been singing from the same hymn sheet. They share a deep sense of national and local decline. They view the country through a lens of crumbling high streets, strained public services, and an economy seemingly trapped in a doom loop.
In this environment, they have developed a corrosive scepticism towards the modern university model, judging it a failed investment that saddles their children with debt for a degree that is only good for getting through graduate recruiters’ first sift of CVs. They demand contraction, utility, and accountability for a system they believe serves neither the student nor the economy.
To delve into these views, Public First conducted focus groups with those who currently intend to vote Reform UK in university towns in England. This revealed a surprising chink of light in an otherwise very gloomy outlook on universities: focus group participants were broadly very positive about international students.
Foreign subsidy as necessary evil
This needs to come with a heavy caveat: when we polled Reform voters, we found that 63 per cent agree that the UK government should restrict international student numbers in order to cut net migration. Cutting net migration remains a top priority for these voters, and for many, it appears that this should be done by any means necessary.
However, when confronted with the economics, Reform voters we have spoken to reveal a sophisticated and transactional view of international student recruitment. For them, students from overseas are not a problem to be solved, but a “great business.”
They see international recruitment as a clear, contained, and mutually beneficial transaction: the UK offers a world-class education (a product) and, in return, receives a higher rate of tuition fee (a profitable revenue stream). The students come to study, they contribute economically, and then – the crucial expectation – they either contribute to the UK economy or they leave.
This isn’t merely tolerance; it’s a qualified acceptance rooted in financial necessity. In these voters’ minds, these lucrative international fees act as the foreign subsidy that keeps the entire system afloat. As one participant noted, “If universities can’t stay open because they haven’t got any foreign students, then that is a detriment to UK students.” The implication is clear: to maintain a domestic higher education offering, the international revenue stream must be protected.
The conditions for goodwill
This surprising goodwill, however, is fragile and rests on extremely strict conditions. Voters grant the sector a licence to recruit internationally only as long as two core boundaries are strictly maintained.
No back doors: The arrangement must remain a transactional exchange, not a migration loophole. Support instantly evaporates when student visas are perceived as a “back door” into the country, particularly when students bring dependents or “disappear” into the country during the degree programme, or after graduation. The transaction is valid only if the purpose is learning, not permanent residency. “If you’re coming to learn, then you come to learn. You don’t bring your family, your dog, your cat and your goldfish,” argued one voter.
No crowding out: Crucially, if voters feel that their children are being denied places in favour of higher-paying overseas customers, the economic argument collapses under the weight of perceived injustice.
Despite the conditional acceptance of international fees, the core challenge for universities remains their perceived lack of utility to their students, and in their local communities. While Reform voters are pragmatic about international revenue streams, they are profoundly sceptical about the value of many domestic degrees that this income subsidises, and they see very little economic spillover in their towns: “…the areas outside of the city centre, I can’t see what benefit [universities] have.”
The sector cannot win over these key voters – and thus cannot escape the threat of cuts from political parties who want their support – by simply defending the status quo. Making the case to this influential group of voters requires clearly showing how international students are paying for local resources and subsidising domestic places, while demonstrating robust checks that ensure the system is not abused.
More widely, universities need to move beyond abstract civic rhetoric and show tangible value, taking concerted action to ensure and evidence that all degree courses benefit the student, the community and/or the country at large.
The support for international students presents a unique opportunity. It is the one pillar of the current HE model that Reform voters’ economic logic allows them to broadly accept, even if this acceptance is currently secondary to the desire to cut net migration.
The sector must leverage this pragmatic lifeline to pave the way to a secure future, while not telling but showing voters that their domestic offering is part of the solution to the UK’s economic doom loop.
Declining trust in institutions is a defining trend of our times. Universities are certainly not immune to it, with the idea of the deteriorating “social licence to operate” of the university now a common item of discussion.
Some point to the negative press coverage universities have faced in recent years. However, our recent report by UCL Policy Lab and More in Common highlights that something more fundamental is going on in our politics that universities must grapple with: the political centre of gravity has moved towards voters who are more sceptical of universities.
Since 2016 it is well understood that political attention has shifted towards working class or “left-behind” voters (depending on your preferred characterisation) and to seats in the Midlands and northern England. These voters tend to be non-graduates and are now more commonly those seeing Reform as a potential answer to their frustrations. What our analysis found was a striking gap between how they view universities compared to the remainder of the country.
Gap analysis
Graduates are overwhelmingly positive about universities – 81 per cent say universities have a positive impact on the nation. Among non-graduates, that figure drops to just 55 per cent. This is reflected in the wider set of concerns non-graduates have about higher education. Non-graduates are more likely to believe universities only benefit those who attend them and that the system is rigged in favour of the rich and powerful. They are also less convinced that universities have become more accessible to working-class students over the past 30 years.
It is their concerns that are driving the fact that a majority of voters emphasise the importance of vocational education over degrees and are worried about there being too many “Mickey Mouse” courses (although even graduates agree on that later point). Fewer than half are even fully aware that universities conduct research.
The graduate gap is in part what creates the more direct political challenge universities face. Reform voters are markedly more sceptical of universities than any other voter group. Less than half believe universities are good for the country. More than a third think they only benefit attendees, and nearly one in ten believe they benefit no one at all. Reform voters overwhelmingly did not go to university. If a key battleground of British politics over the next four years is to be Labour vs Reform, universities will need to engage with these voters’ concerns if they going to find their place in the conversation.
Reaching the sceptics
This challenge is not insurmountable. There is as much to be positive about as concerned. Our polling showed the clear majority, 61 per cent, see universities as a positive influence, both nationally and locally and the cynicism regarding some aspects of what universities are delivering is not as dire as that faced by many other institutions. Despite their relative scepticism, 45 per cent of Reform voters still see universities as benefiting the country.
Those we spoke to in focus groups were not unpersuadable. We found some scepticism, but not hostility. Another recent report by More in Common and the UCL Policy Lab ranked universities as “medium-high” in terms of how trusted they are by voters. In the turbulent times we are in, that is not a bad position.
As well as outlining where the challenges lie, our report shows how universities might go about maintaining trust and reaching more sceptical voters. Three lessons stood out.
The first is addressing the sense that universities are not supporting the skills needs of the country. The biggest concern we found about universities is the declining perception of the value of a degree. Focus groups bore out what this meant – degrees not resulting in a good job. There are two arguments which played out in focus groups that might help convince sceptics. Either that more degrees have a clear path, like those for teachers, lawyers and doctors, or by explaining the value of a degree in broadening minds and “opening doors” – that is, leading to a good job that may not relate to the content studied. Regardless, the public want confidence that universities are training the next generation of skilled professionals.
The second is by demonstrating the value of research, and the innovation and civic engagement it allows, to those who do not attend university. On this point there is much potential. When asked, the public are highly supportive of universities’ role in R&D and see it as a core purpose. In focus group discussions, a sense emerged of the benefits of university research – seen as carried out with a long term and neutral perspective. Yet few raise research unprompted, and less than half of non-graduates in our poll were even fully aware that universities do research. Articulating this role and how it benefits lives is a clear imperative.
Third is the local role. We found many see universities as a source of local pride, with the idea that universities support local business – and make their areas more vibrant – resonating. At the same time there are concerns, for example around housing and anti-social behaviour. A focus on enhancing the former and acting as a good neighbour on the latter would therefore be advisable.
All this sits in a wider context of how the public sees universities, which was at the core of what we found. In the public imagination, universities are national institutions with clear responsibilities. Indeed, Reform voters are the most likely to say that universities should focus on their national responsibilities as opposed to their international connections. Showing how these responsibilities are being met – for the whole country, not just those who study for a degree – is how the sector can maintain public trust, and meet the political challenge it faces.
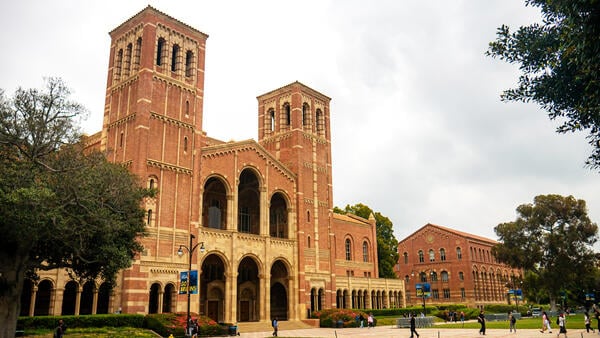
A judge ordered federal agencies Friday to end their “blanket policy of denying any future grants” to the University of California, Los Angeles, and further ruled that the Trump administration can’t seek payouts from any UC campus “in connection with any civil rights investigation” under Titles VI or IX of federal law.
The ruling also prohibits the Department of Justice and federal funding agencies from withholding funds, “or threatening to do so, to coerce the UC in violation of the First Amendment or Tenth Amendment.” In all, the order, if not overturned on appeal, stops the administration’s attempt to pressure UCLA to pay $1.2 billion and make multiple other concessions, including to stop enrolling “foreign students likely to engage in anti-Western, anti-American, or antisemitic disruptions or harassment” and stop “performing hormonal interventions and ‘transgender’ surgeries” on anyone under 18 at its medical school and affiliated hospitals.
The administration’s targeting of the UC system came to the fore on July 29. That’s when the DOJ said its months-long investigations across the system had so far concluded that UCLA violated the equal protection clause of the 14th Amendment and Title VI of the Civil Rights Act of 1964 in its response to alleged antisemitism at a spring 2024 pro-Palestinian protest encampment.
Federal agencies—including the National Institutes of Health, National Science Foundation and Department of Energy—quickly began freezing funding; UC estimated it lost $584 million. But UC researchers sued and, even before Friday’s ruling, U.S. District Court judge Rita F. Lin of the Northern District of California ordered the restoration of almost all of the frozen funding.
Friday’s ruling came in a case filed this fall by the American Association of University Professors, the affiliated American Federation of Teachers and other unions. Lin again was the judge.
“Defendants did not engage in the required notice and hearing processes under Title VI for cutting off funds for alleged discrimination,” she wrote.
“With every day that passes, UCLA continues to be denied the chance to win new grants, ratchetting [sic] up Defendants’ pressure campaign,” she wrote. “And numerous UC faculty and staff have submitted declarations describing how Defendants’ actions have already chilled speech throughout the UC system. They describe how they have stopped teaching or researching topics they are afraid are too ‘left’ or ‘woke,’ in order to avoid triggering further funding cancellations by Defendants. They also give examples of projects the UC has stopped due to fear of the same reprisals. These are classic, predictable First Amendment harms, and exactly what Defendants publicly said that they intended.”
Former University of Virginia president Jim Ryan has broken his silence concerning his abrupt resignation, accusing the Board of Visitors of dishonesty and complicity in his ouster, which came amid federal government scrutiny over the university’s diversity, equity and inclusion practices.
In a 12-page letter to the UVA Faculty Senate on Friday, Ryan wrote that he was “stunned and angry” over the board’s lack of honesty as it faced pressure from the federal government to force him out due to an alleged failure to dismantle DEI initiatives. Ryan also wrote that recent letters by UVA rector Rachel Sheridan and Governor Glenn Youngkin do not “present an accurate accounting of my resignation,” which prompted him to release his own statement.
Inside Higher Ed has uploaded Ryan’s full letter below.
Ryan’s letter follows a message Sheridan sent to the UVA Faculty Senate on Thursday. In that letter, Sheridan downplayed the pressure from the federal government to force Ryan out. While she acknowledged that the Department of Justice “lacked confidence in President Ryan to make the changes that the Trump Administration believed were necessary to ensure compliance,” she disputed the notion that his resignation was part of the agreement that the university recently reached with the federal government to pause investigations into DEI practices.
The full text of that letter is available below.
Also on Thursday, Youngkin sent a letter related to Ryan’s departure to Governor-elect Abigail Spanberger, who has called for UVA to halt its ongoing presidential search until her board picks are in place. The Republican governor pushed back on his Democratic successor’s claims that Ryan was ousted as a result of federal overreach and accused her of interfering in the search. Youngkin also accused Ryan of “not being committed to following federal law.”
That letter has been uploaded in full below.
This is a breaking news story and will be updated.
AI is now at the center of almost every conversation in education technology. It is reshaping how we create content, build assessments, and support learners. The opportunities are enormous. But one quiet risk keeps growing in the background: losing our habit of critical thinking.
I see this risk not as a theory but as something I have felt myself.
The moment I almost outsourced my judgment
A few months ago, I was working on a complex proposal for a client. Pressed for time, I asked an AI tool to draft an analysis of their competitive landscape. The output looked polished and convincing. It was tempting to accept it and move on.
Then I forced myself to pause. I began questioning the sources behind the statements and found a key market shift the model had missed entirely. If I had skipped that short pause, the proposal would have gone out with a blind spot that mattered to the client.
That moment reminded me that AI is fast and useful, but the responsibility for real thinking is still mine. It also showed me how easily convenience can chip away at judgment.
AI as a thinking partner
The most powerful way to use AI is to treat it as a partner that widens the field of ideas while leaving the final call to us. AI can collect data in seconds, sketch multiple paths forward, and expose us to perspectives we might never consider on our own.
In my own work at Magic EdTech, for example, our teams have used AI to quickly analyze thousands of pages of curriculum to flag accessibility issues. The model surfaces patterns and anomalies that would take a human team weeks to find. Yet the real insight comes when we bring educators and designers together to ask why those patterns matter and how they affect real classrooms. AI sets the table, but we still cook the meal.
There is a subtle but critical difference between using AI to replace thinking and using it to stretch thinking. Replacement narrows our skills over time. Stretching builds new mental flexibility. The partner model forces us to ask better questions, weigh trade-offs, and make calls that only human judgment can resolve.
Habits to keep your edge
Protecting critical thinking is not about avoiding AI. It is about building habits that keep our minds active when AI is everywhere.
Here are three I find valuable:
1. Name the fragile assumption Each time you receive AI output, ask: What is one assumption here that could be wrong? Spend a few minutes digging into that. It forces you to reenter the problem space instead of just editing machine text.
2. Run the reverse test Before you adopt an AI-generated idea, imagine the opposite. If the model suggests that adaptive learning is the key to engagement, ask: What if it is not? Exploring the counter-argument often reveals gaps and deeper insights.
3. Slow the first draft It is tempting to let AI draft emails, reports, or code and just sign off. Instead, start with a rough human outline first. Even if it is just bullet points, you anchor the work in your own reasoning and use the model to enrich–not originate–your thinking.
These small practices keep the human at the center of the process and turn AI into a gym for the mind rather than a crutch.
Why this matters for education
For those of us in education technology, the stakes are unusually high. The tools we build help shape how students learn and how teachers teach. If we let critical thinking atrophy inside our companies, we risk passing that weakness to the very people we serve.
Students will increasingly use AI for research, writing, and even tutoring. If the adults designing their digital classrooms accept machine answers without question, we send the message that surface-level synthesis is enough. We would be teaching efficiency at the cost of depth.
By contrast, if we model careful reasoning and thoughtful use of AI, we can help the next generation see these tools for what they are: accelerators of understanding, not replacements for it. AI can help us scale accessibility, personalize instruction, and analyze learning data in ways that were impossible before. But its highest value appears only when it meets human curiosity and judgment.
Building a culture of shared judgment
This is not just an individual challenge. Teams need to build rituals that honor slow thinking in a fast AI environment. Another practice is rotating the role of “critical friend” in meetings. One person’s task is to challenge the group’s AI-assisted conclusions and ask what could go wrong. This simple habit trains everyone to keep their reasoning sharp.
Next time you lean on AI for a key piece of work, pause before you accept the answer. Write down two decisions in that task that only a human can make. It might be about context, ethics, or simple gut judgment. Then share those reflections with your team. Over time this will create a culture where AI supports wisdom rather than diluting it.
The real promise of AI is not that it will think for us, but that it will free us to think at a higher level.
The danger is that we may forget to climb.
The future of education and the integrity of our own work depend on remaining climbers. Let the machines speed the climb, but never let them choose the summit.
Laura Ascione is the Editorial Director at eSchool Media. She is a graduate of the University of Maryland’s prestigious Philip Merrill College of Journalism.
When I first began teaching Islam, there was no road map. In 2001, I was a visiting assistant professor of Islamic and Middle Eastern studies at the University of Iowa—the first full-time professor of Islam in the history of the state. I was in my 20s, still finishing my dissertation, when the attacks of Sept. 11 unfolded. Suddenly, I found myself trying to explain a 1,400-year-old religion to students who had watched the Twin Towers fall on live television.
Teaching Islam in American universities has never been more widespread, more diverse or more embattled. That is the story of the past two decades: a field that has grown dramatically, transformed in terms of who teaches it, and now finds itself under intensifying political scrutiny.
That experience in Iowa shaped everything that came after. I discovered that my task was not only to introduce students to the theological, historical and cultural breadth of Islam but also to help them unlearn the simplistic caricatures they had absorbed from media and politics. Islam was not a monolith. It was not synonymous with terror. It was, like Christianity or Judaism, a faith defined by argument, diversity and adaptation.
Those class lectures eventually became the foundation for No god but God: The Origins, Evolution and Future of Islam, first published in 2005. I hoped the book would serve both general readers and university classrooms. To my surprise, it quickly became a popular text for teaching Islam in the United States and far beyond. It has been translated into dozens of languages, adopted in seminaries and world religion courses, and read in mosques, churches and synagogues.
Two decades later, the landscape of Islamic studies in American universities looks profoundly different. In 2001, very few institutions offered dedicated courses on Islam outside of theology departments. Today, there are hundreds of such courses, spanning history, political science, gender studies and literature. The proliferation has been remarkable—though uneven. Some courses are rigorous, rooted in language and text, while others are more ad hoc, responding to student demand and global events.
Another profound shift has been in who is teaching Islam. For most of the modern history of religious studies in America, Christian professors taught Christianity, Jewish professors taught Judaism—but it was rare to find Muslim professors teaching Islam. In nearly two decades of studying the subject, I had only one Muslim professor. That has changed dramatically. Today, Muslim scholars occupy faculty positions across the country, and new professional associations—such as the International Quranic Studies Association, of which I am a member—are fostering networks of Muslim academics who bring both scholarly expertise and lived experience into the classroom. This diversification has expanded the kinds of questions and perspectives that shape the field, though it has also forced universities to confront new debates over authority, representation and bias.
Meanwhile, the teaching of Islam—like so many fields in the humanities—is now buffeted by unprecedented political pressure. Across the country, state governments have moved to limit what can and cannot be taught in universities and ban diversity, equity and inclusion programs. More recently, elite universities such as Columbia and Harvard have faced political scrutiny from the Trump administration and Congress into their Middle East studies programs, accused by some lawmakers of being biased. In today’s climate, teaching Islam can feel like an act of defiance. Professors often self-censor, conscious that a stray lecture note could trigger outside campaigns or even threats. The irony is that in a moment when greater understanding of Islam is needed more than ever, the very institutions best equipped to provide that education are being undermined.
Yet this is precisely why teaching Islam in universities matters more than ever. At a time when Islam has faded from the headlines but remains entangled in the debates that define our era—from authoritarianism to surveillance to religious pluralism—the classroom is one of the few places where the faith can be encountered on its own terms. The role of professors is not to sanitize or defend Islam, but to present it in all its richness, contradictions and ongoing transformations.
The fully updated 20th-anniversary edition of No god but God is my attempt to support that task for another generation of teachers and students. The new preface reflects on what has changed since 2005—the Arab Spring, the rise of digital Islam, the ebb of the “war on terror”—and what has not: Islam’s enduring struggle to reconcile tradition and modernity, authority and pluralism.
More than two decades of teaching have convinced me that education about Islam cannot be episodic, tied only to moments of crisis or headlines of violence. It must be sustained, interdisciplinary and grounded in serious scholarship. It must expand beyond political science courses on terrorism and foreign policy, and beyond theology seminars comparing sacred texts, into the wider humanities and social sciences. And it must center the lived experiences of Muslims themselves.
The classroom is not a mosque. But it is one of the few spaces where young people can confront their assumptions, wrestle with complexity, and imagine new ways of understanding the role of religion in the world. That was my conviction in 2001, when I walked into a lecture hall in Iowa just days after Sept. 11. It remains my conviction today.
The classroom may not be a mosque, but it remains one of the few places where Islam can be encountered in all its richness, contradictions and humanity.
Reza Aslan is a writer and scholar of religion. His books includeZealot: The Life and Times of Jesus of Nazareth and No god but God: The Origins, Evolution, and Future of Islam, now available in an updated 20th-anniversary edition from Random House. He is a professor of creative writing at the University of California, Riverside.
There was a 9 percent increase in enrollments from the pilot county as compared to the previous CSU freshman class.
Photo illustration by Justin Morrison/Inside Higher Ed | gemenacom, ghoststone, Jose Gonzalez Buenaposada and vi73777/iStock/Getty Images
The California State University system launched a direct admissions pilot last year, offering qualifying high school seniors at school districts in Riverside County admission to 10 of its institutions. The program turned out to be an unqualified success: The number of graduates from the district who enrolled at a CSU campus this fall jumped 9 percent.
Now the system is expanding the program, thanks to legislation signed last month that will allow CSU to extend offers to students in every school district in the state starting in the 2026–27 admission cycle. The offers will grant admission to 16 of the 22 CSU campuses; the six most selective institutions will not participate.
The program ties in with the system’s goal of creating access to higher education for all Californians, said April Grommo, CSU’s assistant vice chancellor of strategic enrollment management.
“Being able to proactively inform students that they are eligible for the CSU has provided a lot of positive results,” she said. “We had a lot of students and families that did not realize they were eligible to go to a four-year university.”
With this program, California joins a cohort of about 15 states that offer students some form of direct, guaranteed or simplified admissions. The intent is to streamline the admissions process and make students aware of institutions they may not have otherwise considered, as well as to bolster institutions’ enrollment. Such programs have proven broadly successful, according to Taylor Odle, a professor of education policy studies at the University of Wisconsin.
“My work, in partnership with states and national nonprofit organizations, shows that direct admissions programs can not only increase students’ early-college going behaviors but also subsequently raise their college enrollment outcomes,” Odle wrote in an email to Inside Higher Ed. “These benefits are particularly large for students of color, those who will be the first in their family to attend college, and those from lower-income communities. States who have implemented direct admissions also consistently report higher enrollment levels following implementation.”
While different states use the term “direct admissions” slightly differently, Odle defined a true direct admissions program as “guaranteed (students are admitted to college; not an invitation to apply), universal (all students can participate), proactive (students don’t need to do anything to receive a direct admissions offer), simplified (students don’t need to apply; simply ‘claim their spot’ via a streamlined process), and free (no cost).”
In CSU’s case, qualified students—those who meet the system’s requirements regarding the courses they took in high school and who have a minimum 2.5 grade point average—receive mailers informing them that they have been admitted to all 16 participating campuses.
In the Riverside County pilot program, about 17,400 graduating seniors received admission offers. The system saw a 15 percent year-over-year increase in students from the county who completed an application for a CSU institution—direct admits don’t complete the full application, just a truncated version of it in order to accept the offer of admission—and led to the subsequent bump in enrollees. The majority ended up at Cal State San Bernardino, the closest campus to Riverside County—across the state, most CSU students attend an institution within 50 miles of their home—but others traveled farther, in some cases to study in specialized programs.
Along with the direct admissions offers, the system also launched a series of events to expose Riverside County students to CSU’s different campuses and programs. Called Discover CSU Days, the events featured panels of current students from Riverside County.
“A lot of Riverside County students are first-generation and low-income, so we talked to them about why the CSU is a good option for them,” said Grommo.
Students could enroll that same day, with some campuses waiving housing and tuition deposits for those who did.
Odle said that with so many institutions reporting positive outcomes from their direct admissions programs, such initiatives may soon become the “new norm.”
“More states and systems of higher education should be in the business of identifying challenges, designing and implementing pilot programs to address them, rigorously studying them, and then making expansion decisions (like this) based on evidence,” he wrote. “Given CSU’s access and service mission to the state, it makes sense that it joins a variety of other systems nationally at implementing this evidence-based practice to raise enrollments and reduce gaps in access.”
These institutions are the backbone of American higher education. They serve the largest share of students by far, and state-supported colleges and universities play an outsize role in providing economic mobility for Americans of all backgrounds. I’ve spent my entire career working on behalf of public universities, most recently as president of the Association of Public and Land-grant Universities. I know the enormous good they do for their students and for society at large. We have the best publicly supported system of higher education in the world. We can and must continue to improve it.
I also understand why our public institutions will benefit from an accreditor that aligns with their mission and their public obligations. They need an accreditor that offers true peer review and a disciplined focus on improving student outcomes. They need an accreditor familiar with the mechanics of state oversight, able to promote academic quality while also being more efficient by eliminating redundant bureaucracy in the accreditation process.
The Commission for Public Higher Education was formed earlier this year to answer those needs. Established by a consortium of six public university systems—the State University System of Florida, the University System of Georgia, the University of North Carolina System, the University of South Carolina System, the University of Tennessee System and the Texas A&M University System—the aim of CPHE is to offer public universities across the country an alternative to the regional accreditors that have long dominated higher education, each claiming a geographical monopoly that lumped together for-profit schools, bespoke private colleges and open-access public institutions under the same set of rules and regulations.
I agreed to serve as chair of the Board of Directors for CPHE because I believe there’s a need for innovation in accreditation. We are seizing the opportunity to improve institutional accreditation by focusing on outcomes, as well as streamlining the process by taking advantage of the considerable oversight that public institutions are subject to at the state level. An accreditor purpose-built by public institutions, for public institutions, can promote academic quality while driving innovation in student success and eliminating unnecessary costs in the legacy model of accreditation.
There is clearly enthusiasm for the vision behind CPHE. Ten diverse institutions have already signed on to join CPHE’s initial cohort (full list below), and the commission is fielding additional inquiries from across the country. We’ve just issued a call for public university faculty and administrators to join our first group of peer-review teams, and we look forward to pioneering a new model of more straightforward and more transparent accreditation review.
CPHE Initial Cohort
Appalachian State University
Chipola College
Columbus State University
Florida Atlantic University
Florida Polytechnic University
North Carolina Central University
Texas A&M–Kingsville
Texas A&M–Texarkana
University of North Carolina at Charlotte
University of South Georgia
University leaders and state policymakers nationwide see the value in a streamlined approach to accreditation that shifts the focus from inputs and operational minutiae to meaningful outcomes for students and taxpayers.
The legacy approach to accreditation is plagued by the need for each accreditor to serve the huge diversity of institutional missions and governing structures that underlie the American system of higher education. Trying to impose the same set of criteria and procedures on every institution, from small private colleges to huge public flagships, has led to decades of ineffective oversight and wasted effort. There is little or no evidence that institutional accreditation has driven quality improvements across the sector, while it is abundantly clear that it has imposed arbitrary and opaque regulatory demands on institutions that already are subjected to multiple layers of oversight as public agencies.
Institutions like Georgia State University, where I served more than a decade as president, are closely scrutinized by their governing boards, by state regulators and legislative bodies, by auditors and bond ratings agencies. They have public disclosure and consumer protection requirements above and beyond what is demanded of private and for-profit colleges. I have firsthand experience with how costly and cumbersome accreditation reviews divert institutional resources that would be better spent supporting student success, and I am confident a public-focused accreditor can streamline reporting and compliance costs without compromising oversight.
An accreditor attuned to the nuances of public oversight can add value by focusing on academic quality and student success, using a process of peer review to promote continuous improvement through the dissemination of best practices and innovations. That’s why CPHE’s accreditation standards are tailored toward public purpose and academic excellence, with provisions for measuring student learning, promoting academic freedom and intellectual diversity, and driving continuous improvement of student outcomes.
At core, the purpose of accreditation is to reassure students and taxpayers that universities are delivering on their promise to provide a quality education that leaves students better off. An accreditor tightly focused on that public mission can go a long way in shoring up the trust that higher education needs to thrive.
Mark Becker is the chair of the Board of Directors of the Commission for Public Higher Education. He formerly served as president of the Association of Public and Land-grant Universities from 2022 to 2025, and before that he was president of Georgia State University from 2009 to 2021.
Since 2022, there’s been a surge in the number and types of applications using generative AI, but not all tools are the same. So how can faculty, staff and students learn to identify the differences and determine when it’s appropriate to leverage these tools?
Colby College developed a platform, called Mule Chat, that allows users to explore several large language models, including ChatGPT, Gemini, Claude and LLaMA. The platform provides a safe on-ramp into generative AI usage and relies on student tutors to disseminate information to peers.
In the latest episode of Voices of Student Success, host Ashley Mowreader speaks with David Watts, the director of Colby College’s Davis Institute for Artificial Intelligence, and Michael Yankoski, Davis AI research and teaching scientist, to learn about the college’s AI institute and how Mule Chat works.
An edited version of the podcast appears below.
Inside Higher Ed: Can we start the conversation by talking a bit about what AI at Colby College looks like? What is the landscape you’re working with and how are you thinking about AI when it comes to teaching and learning?
David Watts: I am new to Davis AI, as we call it at Colby, but the [Davis AI] Institute has actually been around since before ChatGPT, so Colby kind of had a pioneering approach.
David Watts, director of the Davis Institute for AI at Colby College
Colby is a small liberal arts college, and they had the vision that this was going to be around for a while. And rather than, as most institutions were doing, sort of keep it at bay or ban it from campus, Colby dove in and wanted to engage with it and understand how it is going to impact education.
I spent most of my career in industry, mostly in research and development, and so I when I wanted to make the jump over to academia, I wasn’t expecting to find that small liberal arts colleges had done this, and when I saw what Colby had done, I was really drawn to it and came over. So I’ve really loved what has been going on and what continues to go on at Colby with the Davis Institute for Artificial Intelligence.
Inside Higher Ed: Michael, your role puts you directly in connection with faculty when it comes to integrating AI into their classrooms or into their programs. Can you talk about what that looks like and how maybe that looks different at a liberal arts institution?
Michael Yankoski, research and teaching scientist, Davis Institute for AI at Colby College
Michael Yankoski: One of the most amazing aspects of the Davis Institute for Artificial Intelligence here at a place like Colby is the liberal arts approach that the institution as a whole is able to engage with.
That means that we’re able to facilitate conversations from a multiplicity of different disciplines and bring faculty together from different approaches across the divisions in the college—from the STEM fields to the humanities to the social sciences. And have really productive, very generative conversations around ways to engage with artificial intelligence and the shared learning and shared knowledge of people who have been really pioneering in the area. To able to say, “How can I integrate generative artificial intelligence with my pedagogy? How can I help think with students about how to engage these technologies in a way that is beneficial for their education, help empower students in their education and then on the research side?”
Many faculty with whom we work at the Davis Institute are exploring ways to integrate artificial intelligence in their research program, and to say, “Is there a way that artificial intelligence can help me accelerate my research or take my research in new directions?” The opportunity to bring people together to discuss that and to facilitate those conversations across the disciplines is one of the best aspects of the liberal arts approach to artificial intelligence.
Inside Higher Ed: Does Colby have an institutional policy for AI use, or what appropriate AI use looks like?
Watts: It’s a moving target. Anyone who tells you they have it all figured out is probably embellishing. It is a moving target, but one of the things we did was make sure we engage faculty, and in fact, we started with faculty, then we engaged administrators, we engaged students and we engaged general counsel, and evaluated what the challenges are, what the downsides are. And we made sure that we built what we call guidelines rather than policy.
The guidelines talk through the dos and don’ts but also leave enough flexibility for our faculty to think through how they want to engage with AI, especially since AI is a moving target, too. As we grow and learn with our faculty, we adapt and adjust our guidelines and so they’re out there for everyone to see, and we will continue to evolve them as we move forward.
Inside Higher Ed: Can you introduce our listeners to Mule Chat? What is it and how does it work on campus?
Watts: Michael has been here and was one of the originators of creating Mule Chat on campus. And so he can tell you a lot of the details and how it’s been working.
But what I loved about what Michael and the team did, and it was a collaborative effort, was to create, I’ll call it an on-ramp. We were working towards moving the needle from banning AI, as one extreme, to engaging with AI and creating a tool that allowed faculty, students and staff to all easily engage with multiple tools through Mule Chat.
It lowered the activation barrier to entry to AI and allowed us to have an on-ramp for people to come in and start seeing what the possibilities are, and it has worked brilliantly.
Yankoski: The idea behind Mule Chat originally was to provide a place for students, faculty and staff to begin to get experience with and understanding around generative AI. To provide a space where folks could come and understand a bit more about, what are these tools? How do they work? What are they capable of? What are some of the areas we need to be aware of, the risks and the best practices, and how can we provide this on-ramp, as David described, for people to be able to engage with generative artificial intelligence?
This is about student success, empowering students to understand what these technologies are, what they’re good at, what they’re not good at. And then also, one of the key principles here was equity of access. We wanted to ensure that anybody on Colby’s campus, regardless of whether they could afford one of the premium subscription services, was able to get access to these frontier models and to understand how to then do the prompt engineering work, and to then compare the kinds of outputs and capabilities of some of the frontier models. And so really, the core sort of genesis and driving desire for the creation of Mule Chat was to provide this on-ramp that would empower student success, allow equity of access, and also would provide a safe and secure place for people to be able to engage these technologies and to learn.
Inside Higher Ed: Can you describe the functionality of Mule Chat? For someone who has never experimented with LLMs, what does it look like or feel like to engage with Mule Chat?
Watts: You touched on something really great there, because that was part of the idea. We introduced multiple models into Mule Chat so that people could compare and get an idea of what it’s capable of and what it’s not capable of.
I’ll give an example of a faculty member who we are working with right now who started with Mule Chat, engaged with it in their preparation—this is a professor of East Asian studies—how they prepare their classes, realized what the capabilities were, started doing more with it, with their students. The students then brought interesting ideas about what else we can do and pushed beyond even the limits of Mule Chat. And then Davis AI can go help them bring in, for example, they were looking at—not only just looking at old archives and using that in their teaching of East Asian studies, but also bringing in video capability, for example, and in fact, even creating new videos or some of the research that they’re doing now, bringing in more capabilities above and beyond Mule Chat. So it is exactly what Michael was saying, an on-ramp that then opens up the possibilities of what we can do with AI in higher education.
Yankoski: I think the real value of the Mule Chat interface is that it allows people to compare the different models.
Folks can use prompt engineering to compare the outputs of one model and then put that alongside the outputs of another model and be able to observe the way that different models might reason or might do their inference in different kinds of ways.
That side-by-side comparison is a really powerful opportunity for people to engage with the different models and to experience the different kinds of outputs that they create. To build on what David was saying, the ability to then put other tools [like videos] inside of the Mule Chat platform, that allows for deeper research into particular areas. For example, we have a tool that we built, which is called Echo Bot.
The Colby student newspaper is called the Colby Echo, so we’ve been able to bring all the archives of the Echo into a tool that allows students and faculty researchers to engage with those archives and chat with the entire archive of the Colby Echo. We’ve been working closely—and this goes back to the liberal arts approach—with different faculty across campus, as well as the college libraries, to bring this tool online and make it available within the Mule Chat system.
Inside Higher Ed: Let me know if you can build me an IHE bot, because I can never find anything in our archives. I could really benefit from something.
Watts: We can brainstorm on that.
Inside Higher Ed: Great, we’ll talk about licensing later.
I wanted to ask, it seems there’s a new AI tool that pops every other day. So when you’re talking about comparing different tools and thinking about what might be most relevant for students, how often are you scouting out the landscape to understand what’s out there and relevant?
Watts: That’s a great question, and actually extremely important that we do that.
Not only are we reaching out and finding, reading, learning, attending conferences, helping to create conferences ourselves that bring in people and experts who are different perspectives, but we also then have lots of people on campus who have their own ideas. People come to us regularly with, “Oh, look at this cool tool. We should use it for this thing on campus.”
And that’s when we use that for educating people about some of the potential pitfalls that we have to watch out for, talking about guardrails and when you’re bringing in new capability, just like you had to think about when you’re bringing in new software. But I think it’s even more imperative that we’re very careful about what AI tools we bring into campus. You’re absolutely right that there are tons of them that all have different capabilities. But one of the things we try to teach is that there’s a full spectrum: the great, the good, the bad and the ugly. You have to think about that entire spectrum. And that’s one of the beauties of what I loved about coming to a liberal arts college was that you have multiple perspectives, and coming from all forms of disciplines in the humanities, the arts, the natural sciences, the social sciences, and all are engaged and can be engaged across AI.
Yankoski: I think that’s what’s so unique and really powerful about the Davis Institute for Artificial Intelligence approach. When we work with faculty and students and really, if some faculty member or student has an idea that they want to explore, we have structures that allow for technology grants, for faculty to be able to come and to propose the use of a new tool, or to advance their teaching or to advance their research.
Then that’s a great opportunity to engage with that faculty member and perhaps their research assistants, and work with those students and that faculty member to explore the possibility of using that tool. Each faculty member knows their domain so much better than we do. As the core Davis AI team, we’re able to work with that faculty and those students to better understand the use case, better understand the tools that they want to engage, and then work with them to consult and to create a pathway forward. That’s an incredible opportunity as well for the students to understand, how do we think about the security of the data? How do we think about the processing pipeline? How do we think about the best practices with regards to utilizing artificial intelligence in this particular domain?
Really that’s about student empowerment and student success as they get ready to transition out of college into an economy where increasingly expectations around knowledge and the ability to utilize and to vet artificial intelligence are only going to increase.
Inside Higher Ed: How are students engaged in this work?
Yankoski: One the most intriguing aspects of Mule Chat has been that students have been really leading in teaching and empowering other students to utilize the tool and to understand the quantum engineering aspects and to understand the different models.
The student leaders have been working with Mule Chat and then actually teaching other students, teaching faculty and helping lead the sessions, as well as working on their own projects within Google Chat. So it’s been a really strong and quite incredible platform for student engagement and student empowerment as students learn from one another and then are able to learn how to teach about these tools to their peers.
Watts: That’s absolutely a huge part of what we did, and I mentioned that, even though students come first, we started working to move the needle with faculty first on purpose, with students in mind. And then we branched out into, now we can engage the students. Once you have enough buy-in from faculty, start engaging the students, and we’ve been doing a lot of that.
Then what’s beautiful, the magic happens when the students start coming up with thoughts and ideas that grow in ways that faculty haven’t thought of. Because remember that a lot of this is new to faculty as well.
So we actually then will identify key students that we have been working with and actually hire them on board as Davis AI research associates that then help us continue to move the needle, because there’s nothing better for students than to hear from other students about what’s possible. And the same goes for faculty, by the way. So, you know, Michael was mentioning a little bit about our strategy with faculty and how we engage them. But a part of what we do is faculty sessions. We give them creative names like “Bagels and bots,” and we include food and then we have those sessions where faculty talk to faculty. We do the same with the students, so students can talk to students. And it’s just wonderful to see the magic that happens when that begins to grow organically.
Inside Higher Ed: What has the reception been to Mule Chat?
Watts: Most people were skeptical [of AI] early on; most were in the mode of “push it away.” I think that drove some interesting behaviors in faculty and students.
So a big part of what we’ve been trying to do is essentially drive towards AI literacy for all. And when I say all, it’s an interdisciplinary approach. We’re looking across the entire campus, and so all students in all departments are what we’re driving towards. Now, you correctly point out that there will always be skeptics. I will strive for 100 percent, but if we asymptotically approach that into the future, I’ll live with that.
The goal is to prepare students, and that’s who we need to make sure that we’re preparing for the life they’re going to go into that’s been transformed by AI, that touches everybody. One of the cool things is we’re giving out grants to faculty to engage with AI and come up with ideas, and we’re doing that on multiple levels, and those faculty are now coming from all. We have art professors. We have writing professors. We have East Asian studies. We have professors from government, we have all of them engaging and so we’ve been able to, therefore, move the needle quite a bit so that a lot more people are a lot more receptive and open to it on campus, which is great.
Inside Higher Ed: You mentioned that Colby has a faculty-led approach, but sometimes that means that students from specific majors or disciplines might be less exposed to AI than others, depending on who their faculty are. It seems like you all are taking a balanced approach, not only encouraging enthusiastic AI entrepreneurs but also working with the skeptics.
Watts: It’s absolutely critical that we work on both ends of that spectrum, if that makes sense. We’re driving great innovation, and there’s great examples of research right here on campus that are doing wonderful things in an interdisciplinary way.
We just won an NSF grant for ARIA, an NSF institute looking at AI assistance in mental health, because that’s one of the most challenging spaces for how the models interact with people with mental and behavioral health challenges. It’s a perfect example of our interdisciplinary approach, with a professor from psychology working with a professor from computer science to go tackle these challenging areas. And I think that’s one of the things that Colby has done well, is to take that broader, interdisciplinary approach. Many people say that word now, but I think the liberal arts are primed for leading the charge on what that’s going to look like, because AI, by its nature, is interdisciplinary.
Inside Higher Ed: What’s next on campus? Is there any area that you’re all exploring or looking to do some more research in, or new tools and initiatives that our listeners should know about for the future?
Watts: We’re consistently evaluating that and bringing them in. What we’re trying to do is let it grow based on need as people explore and come up with ideas.
I mentioned the video; we’re now enabling video capability so we can do some of that research. It also opens up more multimodal approaches.
One of the approaches to the ARIA research, for example, is we want to be able to detect and therefore build context-aware assistance to have better results for everyone. So if we can solve the mental and behavioral health challenges, it’s probably one of the most difficult ones. It can also solve some of the other areas of underrepresented people who are left out or underrepresented groups who are left out of training, for example, which can lead to challenging behaviors.
I’m really excited about all of those possibilities and the areas that allow us to enable. We talked about access, we can also talk about accessibility.
We have on campus the Colby College Museum of Art; one of the faculty in computer science is exploring accessibility options using AI with a robotic seeing-eye dog. If someone wanted to visit the museum who was blind or visually impaired, they could interact with a seeing-eye dog that they’re used to, but this seeing-eye dog now might have more capability to communicate with people about what they’re seeing and in a museum setting, for example.
So really excited about that type of research: how do we really benefit humanity with these types of tools.
Inside Higher Ed: One thing I wanted to ask about is resources allocated from the university to be able to access all these tools. What investment is the college making to ensure that students are able to stay on the cutting edge of AI initiatives?
Watts: That’s absolutely critical. We want to make it no cost to our students and accessible to our students, but it still costs. So [it’s vital to] make sure that we have funding.
We were very lucky that we got a Davis endowment that enabled us to build the Davis Institute. That was huge because, and you can think about some of the challenges with federal funding and all of that stuff, but to have an endowment that allowed us to draw on that and really build strong capabilities at Colby College was critical. But you’re touching on the fact that we’re going to need to continue to do that. And that’s where, for example, the NSF grant and other grants that we will continue to explore will help us with how we continue to grow our impact and grow our value as we head into the future.