With public school enrollment declining nationwide, districts are facing the budget constraints that come with losses in per-pupil funding.
Enrollment has dropped at state and district levels in recent years — due primarily to declining birthrates, but also to increased competition for students brought on by an expansion of school choice laws. Some districts, including the Los Angeles Unified School District, have also cited heightened federal immigration enforcement under the Trump administration as a factor draining enrollment.
These enrollment declines and the resulting budget pressures are forcing more districts to consider — and approve — school closure and consolidation plans. And with researchers projecting continued enrollment woes in the near future, additional closures and consolidations are likely to follow.
As school districts grapple with this financial challenge, K-12 Dive is tracking key district-approved school closures and consolidations. If you know of other such developments we should include, contact us here.
Online enrollment now happens in a national, search-driven market where visibility, clarity, and trust determine which programs students consider. This article explains how search, AI-driven discovery, and brand clarity shape how students find online programs—and what institutions must do to compete.
Why “Build It and They Will Come” No Longer Works
Online learners aren’t discovering programs by chance. They’re searching, comparing, and shortlisting in a national marketplace—and higher education institutions that rely on legacy enrollment assumptions are being left out of the conversation.
If it feels like launching new online programs used to be easier, you’re not imagining it.
For years, online growth was driven by access and availability. Institutions moved programs online because learners couldn’t get what they needed locally. Demand outpaced supply. If you built something credible and made it available, enrollment followed.
That era is over.
Today’s online market is crowded, sophisticated, and national by default. Learners have more choices than at any point in the history of higher education. And they’re not discovering online programs by accident.
Scarcity is gone. Choice defines the market.This is the mindset shift many institutions haven’t fully made yet. Online enrollment no longer rewards availability. It rewards visibility, clarity, and trust.
The National Online Market Is Coming to You—Whether You’re Planning for it or Not
Online Programs Compete Nationally, Not Regionally
One of the most common disconnects I see with higher ed enrollment leaders is how competition is defined.
We still talk about “peer institutions,” “regional competitors,” or “schools we usually go up against.” That framing made sense when geography mattered.
Online learning changes that completely.
Online removes physical boundaries for learners. Institutions are no longer compared only to nearby or familiar schools—they’re compared to whoever shows up and feels credible in the moment of search.
Search and AI Collapse the Market Into a Single Comparison Set
Search engines, paid ads, review platforms, and now AI tools collapse the entire online market into a single results page.
From the learner’s perspective, everything sits side by side.
They’re not just asking, Who’s nearby? Or who they already know? They’re asking, Who looks credible? Who fits me? Who’s going to help me achieve my goals?
Whether institutions plan for it or not, they’re competing nationally—not just with similar schools, but with whoever shows up first and feels trustworthy in the moment of search.
That’s the reality. Ignoring it doesn’t protect you from it.
AI is Redefining How Students Are Discovering Online Programs
Search as the Virtual Campus Visit
For years, search and institutional websites have functioned as the virtual campus visit for online learners.
They’ve been where legitimacy is established. Where perceived risk is reduced. Where prospective students quietly decide whether an institution feels credible, relevant, and worth further consideration.
That hasn’t changed.
AI Systems as the New Gatekeepers
What’s changing now isn’t whether that evaluation happens digitally—it’s how it happens.
AI-powered search and large language models (LLMs) are reshaping how students discover online programs. Learners are no longer just comparing lists of results or clicking through multiple websites.
Increasingly, they’re asking questions directly to AI systems and receiving synthesized answers that compress research, comparison, and judgment into a single moment.
In that environment, higher ed institutions don’t just compete for clicks, they compete to be understood, recommended, and trusted by systems that summarize the online market on the learner’s behalf.
That raises the stakes for clarity, credibility, and differentiation. Search visibility still matters, but so does how clearly your programs, outcomes, and value proposition are articulated across your site and content ecosystem. AI models draw from what they can easily interpret. Generic language, outdated messaging, or unclear positioning makes it harder for an institution to surface meaningfully, even if the program itself is strong.
Institutions that adapt by tightening messaging, strengthening authority signals, and aligning their digital presence with how modern search works, give themselves a chance to compete. Those that don’t risk being filtered out before a learner ever reaches a form, a conversation, or an application.
The Shortlist Problem: Where Online Enrollment Is Actually Won or Lost
Here’s the part that often gets missed.
Learners don’t compare dozens of institutions in depth. They narrow quickly.
Why Brand Clarity Determines the Shortlist
They build a shortlist of online programs that feel safe, credible, and aligned with what they’re trying to accomplish. Everything else falls away.
That shortlist is where enrollment is actually won or lost.
And brand clarity is what helps learners navigate the complexity. Not flashy marketing. Not volume. Clarity.
Learners consistently associate “top online institutions” with recognizable brands and clear program identities—not necessarily the biggest schools or the ones with the most programs.
You Don’t Need to Win Nationally—You Need to Compete for Attention
This is an important reframe for leaders:
You don’t need to win nationally. You do need to compete nationally for attention.
The goal isn’t to be everything to everyone. The goal is to be unmistakably relevant to the right learners when they’re searching.
Where “Build It and They Will Come” Still Shows Up
None of this is about blame. The constraints are real.
Budgets are flat. Teams are stretched. Expectations keep rising.
The Gap Between Priority and Investment
But when you look at how institutions are investing—or not investing—in online enrollment strategy, a pattern emerges.
Only about 42% of leaders say strengthening brand is an online priority. Nearly three-quarters don’t use a dedicated online enrollment marketing partner. Close to 60% rely on general university marketing budgets to support online growth. And only about a quarter believe their staffing and budgets for online marketing are actually adequate.
At the same time, more than 80% of leaders say online enrollment growth is a moderate or high priority. Nearly half say it’s a top institutional priority.
That’s the contradiction.
Online enrollment is strategically important, but investment hasn’t shifted to match how learners actually choose.
In practice, many institutions are still operating with an implicit belief that strong online programs will eventually find an audience. That’s “build it and they will come”—just wearing modern clothes.
What Competing in a National Online Market Actually Requires
The good news is this: competing in a national, search-driven market doesn’t require unlimited budgets or national-scale ambition.
It requires focus.
Here’s what I’d do first.
Compete on relevance, not reach.
You don’t need to outspend national brands. You need to out-clarify them for specific learners. Relevance beats volume every time.
Be explicit about who your online programs are for.
If everyone is your audience, no one is. Clarity reduces friction for learners and improves performance across search, ads, and conversion.
Align search, ads, and web strategies around learner and personalization.
Marketing and enrollment can’t operate in silos here. What online learners search for, what they see in ads, and what they experience on your site all need to tell the same story.
Treat brand clarity as enrollment infrastructure.
Brand isn’t a “nice to have.” It’s what makes demand convert. If learners can’t quickly understand who you are and why you’re credible, efficiency breaks down across the funnel.
National competition doesn’t require national ambition. It requires strategic focus.
The New Reality of Online Enrollment
Let’s be honest about what’s changed.
The market has changed. Learners have changed. And online enrollment strategies have to change with them.
Online growth used to be driven by access. Now it’s driven by discoverability and trust. Higher education institutions don’t get chosen because they exist. They get chosen because online learners can find them, understand them, and feel confident moving forward.
You don’t have to do everything. But you do need an integrated plan that reflects how the online market actually works today.
Because the era of “build it and they will come” is over. In a national, search-driven market, visibility and clarity aren’t marketing tactics. They’re enrollment fundamentals.
If online enrollment growth is a priority, clarity has to start with how the market actually behaves. The Online Learner/Leader Analysis compares how prospective online learners search, evaluate, and shortlist programs with how institutional leaders are planning and investing today—revealing where alignment exists and where opportunity is being missed.
Explore the analysis to see how your assumptions stack up against learner reality.
Frequently Asked Questions About Online Enrollment Strategy
How do students find online programs today?
Students primarily discover online programs through search engines, paid ads, review platforms, and increasingly through AI-powered tools that summarize and compare options. Discovery happens nationally, not locally, and programs compete based on visibility, clarity, and credibility.
What is an online enrollment strategy?
An online enrollment strategy aligns search visibility, digital marketing, web experience, and brand clarity to help institutions compete for online learners in a national market. It focuses on helping the right students find, understand, and trust an institution’s programs.
Why is visibility so important for online enrollment?
Strong programs don’t succeed if learners can’t find or understand them. Visibility ensures institutions are present at the moment of search, while clarity and trust determine whether they make the learner’s shortlist.
How is AI changing online enrollment marketing?
AI-powered search tools are changing how learners research online programs by delivering synthesized answers instead of lists of results. Institutions now compete to be accurately understood and recommended by AI systems.
How does Carnegie help institutions compete for online enrollment?
Carnegie helps institutions compete by aligning enrollment strategy, brand clarity, search and digital marketing, and web experience—improving discoverability, credibility, and conversion across the online enrollment funnel.
This story was originally published by CalMatters. Sign up for their newsletters.
For years, California schools have pushed to change the way the state pays for K-12 education: by basing funding on enrollment, instead of attendance. That’s the way 45 other states do it, and it would mean an extra $6 billion annually in school coffers.
But such a move might cause more harm than good in the long run, because linking funding to enrollment means schools have little incentive to lure students to class every day, according to a report released Tuesday by the nonpartisan Legislative Analyst’s Office. Without that incentive, attendance would drop, and students would suffer.
If the Legislature wants to boost school funding, analysts argued, it should use the existing attendance-based model and funnel more money to schools with high numbers of low-income students, students in foster care and English learners.
When it comes to attendance, money talks, the report noted. For more than a century, California has funded schools based on average daily attendance – how many students show up every day. In the 1980s and ’90s, the state started to look at alternatives. A pilot study from that time period showed that attendance at high schools rose 5.4% and attendance at elementary schools rose 3.1% when those schools had a financial incentive to boost attendance.
This is not the time to ease up on attendance matters, the report said. Although attendance has improved somewhat since campuses closed during the pandemic, it remains well below pre-COVID-19 levels. In 2019, nearly 96% of students showed up to school every day. The number dropped to about 90% during COVID-19, when most schools switched to remote learning, but still remains about 2 percentage points below its previous high.
Attendance is tied to a host of student success measurements. Students with strong attendance tend to have higher test scores, higher levels of reading proficiency and higher graduation rates.
“It’s a thoughtful analysis that weighs the pros and cons,” said Hedy Chang, president of the nonprofit research and advocacy organization Attendance Works. “For some districts there might be benefits to a funding switch, but it also helps when districts have a concrete incentive for encouraging kids to show up.”
True cost of educating kids
Schools have long asked the Legislature to change the funding formula, which they say doesn’t cover the actual costs of educating students, especially those with high needs. The issue came up repeatedly at a recent conference of the California School Boards Association, and there’s been at least one recent bill that addressed the issue.
The bill, by former Sen. Anthony Portantino, a Democrat from the La Cañada Flintridge area, initially called for a change to the funding formula, but the final version merely asked the Legislative Analyst’s Office to study the issue. The bill passed in 2024.
A 2022 report by Policy Analysis for California Education also noted the risks of removing schools’ financial incentive to prioritize attendance. But it also said that increasing school funding overall would give districts more stability.
Enrollment is a better funding metric because schools have to plan for the number of students who sign up, not the number who show up, said Troy Flint, spokesman for the California School Boards Association.
He also noted that schools with higher rates of absenteeism also tend to have higher numbers of students who need extra help, such as English learners, migrant students and low-income students. Tying funding to daily attendance — which in some districts is as low as 60% — brings less money to those schools, ultimately hurting the students who need the most assistance, he said.
“It just compounds the problem, creating a vicious cycle,” Flint said.
To really boost attendance, schools need extra funding to serve those students.
Switching to an enrollment-based funding model would increase K-12 funding by more than $6 billion, according to the Legislative Analyst’s Office. Currently, schools receive about $15,000 annually per student through the state’s main funding mechanism, the Local Control Funding Formula, with an additional $7,000 coming from the federal government, block grants, lottery money, special education funds and other sources. Overall, California spent more than $100 billion on schools last year, according to the Legislative Analyst.
Motivated by money?
Flint’s group also questioned whether schools are solely motivated by money to entice students to class.
“Most people in education desperately want kids in class every day,” Flint said. “These are some of the most dedicated, motivated people I’ve met, and they care greatly about students’ welfare.”
Josh Schultz, superintendent of the Napa County Office of Education, agreed. Napa schools that are funded through attendance actually have lower attendance than schools that are considered “basic aid,” and funded through local property taxes. Both types of schools have high numbers of English learners and migrant students.
“I can understand the logic (of the LAO’s assertion) but I don’t know if it bears out in reality, at least here,” Schultz said. “Both kinds of schools see great value in having kids show up to school every day.”
This audio is auto-generated. Please let us know if you have feedback.
Dive Brief:
Overall college enrollment ticked up 1% in fall 2025 compared to the previous year, a gain of 187,000 students, according to the latest data from the National Student Clearinghouse Research Center.
Undergraduate enrollment drove overall growth with a 1.2% year-over-year increase, as community colleges and four-year public institutions saw 3% and 1.4% bumps, respectively. In contrast, undergraduate enrollment declined 1.6% at private four-year nonprofits and 2% at four-year for-profits.
Other parts of the sector also dipped. Graduate enrollment sagged 0.3%,pushed by a 5.9% decline of international students in these programs, the clearinghouse found.
Dive Insight:
The higher education sector entered 2026 with a nervous eye on the international student pipeline, as the Trump administration continues to pursue policies limiting their ability to study at U.S. colleges.
The clearinghouse’s latest fall enrollment report aligns with those findings. In fall 2025, about 10,000 fewer international students enrolled in U.S. graduate programs compared to the prior year, it found.
The loss came after international enrollment experienced several years of strong growth, according to Matthew Holsapple, the clearinghouse’s senior director of research.
According to Holsapple, international enrollment has increased about 50% since fall 2020 — when the sector experienced a significant decline in these students amid the COVID-19 pandemic.
During a Wednesday call with reporters, Holsapple described this past fall’s downturn as “a pretty meaningful shift after that long period of expansion.”
Undergraduate international enrollment still grew in fall 2025 but at less than half the rate it did in fall 2024 — a 3.2% year-over-year increase compared to an 8.4% uptick.
Dual enrollment students are another key group for college leaders.
Of the fall enrollment increase at community colleges, 38.4% came from students age 17 years or younger, according to Sarah Karamarkovich, a research associate at the clearinghouse. The clearinghouse uses this age range as a proxy for dual enrollment students — those taking college classes in high school.
The bump translates to 66,000 more students under the age of 18 who took community college classes in the fall compared to the previous year, Karamarkovich told reporters.
Community college enrollment increased overall by about 173,000 students.
Among different types of academic programs, shorter-term offerings such as associate degrees and certificates continued to outpace the growth in four-year degrees.
Enrollment in associate degree programs rose 2.2% compared to fall 2024, while the number of students seeking undergraduate certificates increased 1.9%.
Bachelor’s degrees saw more modest year-over-year growth, of 0.9%.
The University of California, San Diego, pictured here, is one of 10 UC system institutions.
Laser1987/iStock/Getty Images
The University of California system reached record enrollment this fall, surpassing 301,000 students across its 10 campuses. About 200,000 of them come from California; the share of students who come from outside the state has decreased by two percentage points over the past four years.
University officials said in a news release that the decline represents the system’s commitment to serving California residents.
“These numbers reflect California’s commitment to academic excellence, access, and innovation, values that have made the University of California the world’s greatest research university,” said UC president James B. Milliken. “The value of a UC degree is abundantly clear. An investment in UC is the best investment in the future of our students, California’s workforce, and the state’s economy.”
The release noted that this enrollment success comes at a time when UC campuses are facing increased costs, federal funding cuts and other financial hardships. Four hundred federal research grants remain suspended or terminated across the system.
This audio is auto-generated. Please let us know if you have feedback.
Public school student enrollment across the U.S. dipped slightly by 0.3% to 49.3 million in the 2024-25 school year compared to the year before, according to data released in December by the U.S. Department of Education for the 50 states and the District of Columbia.
Meanwhile, the number of operating elementary and secondary public schools decreased by 0.2% — from 99,297 in 2023-24 to 99,073 in 2024-25.
The data release, part of the Education Department’s annual Common Core of Data collection, does not offer explanations for the trends, but it does mirror reported enrollment dips that are leading some school systems to consider school closures or consolidations.
Although many factors may contribute to each community’s school enrollment figures, nationally, some experts have said lower birthrates and increased school choice competition are having an adverse impact on public school enrollment.
On the other hand, some states are seeing year-over-year enrollment increases, including the District of Columbia (2%) and Arkansas (1.2%), according to an analysis of the federal data by Burbio, a business intelligence service that works with suppliers to K-12 education. The three states that lost the most students between the 2023-24 and 2024-25 school years were Louisiana (5.9%), Maine (3.5%), and West Virginia (1.9%).
Here are some other figures from the Education Department and from the Burbio’s analysis:
By the numbers
19,183
The number of operating public school districts nationwide in 2024-25.
-2.8%
The percent decrease in the number of public school students between 2019-2020 and 2024-25.
+2.6%
The percent increase in the number of public charter school students between 2023-24 and 2024-25. Charter school students make up 8% of all public school students.
1,859
The number of special education-specific public schools in 2024-25. That’s down 3.8% from 2019-2020.
+1.8%
The percent increase in number of students in the Philadelphia City school district between 2023-24 and 2024-25.
-0.9%
The percent decrease in the number of students in New York City Public Schools between 2023-24 and 2024-25.
-2.8%
The percent decrease in the number of students attending Los Angeles Unified School District between 2023-24 and 2024-25.
10.3-to-1
The student-teacher ratio in Vermont classrooms in 2024-25 — the lowest of all states and the District of Columbia.
21.7-to-1
The student-teacher ratio in California classrooms in 2024-25 — the highest nationwide.
For too long, institutions have operated under an enrollment model built for a market that no longer exists. That status quo persists because it benefits entrenched service providers who profit from preserving the illusion that yesterday’s playbook will solve tomorrow’s challenges. These models feel safe, but they quietly divert resources away from the work of real institutional evolution.
At EducationDynamics, we reject that approach. We refuse to manage a legacy of decline. We are actively dismantling the traditional enrollment playbook to meet a new reality defined by rapid AI advancement, fundamental shifts in student behavior and a growing demand for data-driven action.
The 2026 Marketing and Enrollment Management Benchmarks is more than a collection of data. It is a strategic blueprint for institutions willing to challenge convention. Traditional benchmarks act like a rearview mirror. These benchmarks define the road ahead, focusing on the forces now driving growth: brand authority, AI visibility, intent-rich audiences, operational speed and measurable value.
The Forces Defining Higher Ed in 2026
These trends are not incremental adjustments or cosmetic shifts. They represent a structural reset in how students discover institutions, how trust is earned and how enrollment engines generate growth. Together, they form the pillars of survival for institutions that intend to compete in the next decade, not merely endure it.
1. High-Value Branding
Winning institutions treat brand equity and transparency as primary drivers of top-of-funnel performance. In an era of automated information, trust is the only currency that matters. Reputation is the new SEO. If students don’t trust you, they never search for you.
By 2025, nearly 60% of online learners started their journey by searching for a specific institution—a 354% increase in brand-first searches since 2015. The funnel is no longer program-first. Your brand is the search term. If students don’t already believe in your value, you may never enter their consideration set.
Visibility is no longer earned by keywords alone; it is earned with reputation, authenticity and authority—especially in AI-driven environments:
Answer Engine Optimization (AEO): Provide concise, factual responses to zero-click queries so AI surfaces your brand as the answer.
AI Density: Measure how often your institution appears as a cited source within AI ecosystems, your new visibility metric in a Search Everywhere world.
The report introduces the AI Visibility Pyramid, a strategic framework that connects brand reputation, content, reviews and earned media into one system designed to make your institution the trusted answer inside AI ecosystems—not just another result if someone happens to click.
2. “Search Everywhere” Transformation
The traditional search results page is disappearing. It is being replaced by conversational AI and a multi-platform ecosystem where students demand answers, not links. Visibility is now a conversation, not a click.
An estimated 78% of education-related searches now return an AI Overview, and nearly 45% of Google searches end without a click. Students are building shortlists and making decisions from AI overviews, chatbots, social feeds and video long before your institution’s website loads. If your brand isn’t present in these AI-driven answers, you’ve lost the conversation before you see the prospect.
3.The Efficiency Imperative
Cost inflation is no longer a future concern. It is the operating reality for higher education marketing. In 2025, total digital media spend surpassed $2.77 billion, yet rising costs failed to produce proportional performance gains.
Efficiency across traditional acquisition channels has eroded. Non-brand paid search CPCs climbed 30.9% year over year, increasing the cost of competing on generic, high-intent keywords. That pressure is amplified by zero-click search behavior, which continues to weaken keyword-driven volume strategies.
In this environment, efficiency is not a budgeting exercise. It is a competitive advantage. Institutions outperforming the market are using AI-driven attribution models to understand how organic, paid, and brand touchpoints actually influence enrollment. The focus shifts from chasing clicks to identifying high-intent learners earlier and engaging them with precision.
The Efficiency Imperative is about where and how institutions invest. In 2026, growth will favor those who deploy capital intelligently, align messaging to intent, and reach the right learner at the decisive moment.
4. Value Outperforms Volume
Inquiry volume once signaled success. In 2026, it signals inefficiency. High volumes of low-intent leads inflate costs, overwhelm admissions teams, and obscure real demand.
Institutions can no longer rely on inquiry-driven attribution to understand the market. Many of today’s strongest prospects never raise their hand. Growth now depends on brand authority within AI ecosystems, content structured for conversational search, and predictive models that surface high-intent learners before a form is ever submitted.
The data confirms this shift. Career Changers and Leadership Track learners convert at 9.75% and 15.73%, far outperforming less motivated segments. These learners are decisive, outcome-driven, and ready to act when value and ROI are clear.
At the same time, stealth applicants now account for 9.7% of total applications, up from just 1% in 2020. They research independently, build their own shortlists, and apply when confident, often without entering a traditional funnel.
Institutions that prioritize motivation, fit, and outcomes over raw inquiry counts build smarter funnels that convert faster and operate more efficiently. In 2026, success is defined not by how many leads you generate, but by how many of the right students you enroll.
What this Means for Higher Ed Leaders 2026
Higher education has entered a new era, and the data leaves no room for debate. Modern Learners have rewritten how institutions are discovered, evaluated and chosen.
Institutions that prioritize scale over substance will fall behind in a market defined by AI-driven search, zero-click behavior and value-first decisions. Survival is not the goal. Growth is.
The strategic imperatives that follow are not recommendations. They are the minimum requirements for relevance in 2026 and beyond.
The Strategic Imperatives Higher Ed Leaders Must Prioritize
1. Mechanize Brand Authority for a Zero-Click World
Nearly half of searches now end without a click. Visibility no longer belongs to the best-ranked institutions. It belongs to the most trusted brands. In a zero-click world, institutions must optimize for AI Density, ensuring brand content, outcomes data and FAQs are cited inside AI Overviews, while actively defending brand authority across the decentralized platforms that shape AI answers.
2. Pivot from Lead Volume to Enrollment Value
The era of buying growth through lead volume is over. Rising CPIs have made mediocre leads an expensive distraction. More leads are not the objective. Enrolling the right students is. Success in 2026 requires abandoning vanity metrics and optimizing toward Cost per Application and Cost per Enrollment using first-party data and AI-driven optimization.
3. Engineer Velocity into the Funnel
Modern Learners move fast and reward speed. Most enroll at the first institution that admits them. Delay kills conversion. Institutions must design for velocity at every stage, using AI as a 24/7 admissions concierge to answer questions, engage stealth researchers, and eliminate friction across the funnel.
4. Move from Performative to Operational AI
In 2026, the greatest barrier to progress is not technology, but cultural paralysis. Institutions waiting for a “perfect plan” will end up optimizing a strategy the market has already outgrown. AI cannot live on the sidelines. Leadership must treat it as operational infrastructure, championing upskilling and cross-functional integration across marketing and enrollment. The advantage comes from using AI to drive real-time personalization and faster decisions, not from experimenting in isolation.
Budget cuts, staffing reductions and school consolidations are coming to Los Angeles Unified as the cash-strapped district works to balance its shrinking budget, a top school official said.
LAUSD’s chief financial officer in an interview last week said declining enrollments and the end of pandemic relief funds have forced the district to take cost-cutting measures.
Schools have already been notified of how much they will have to cut from their budgets. The cuts will go into effect starting in August.
LAUSD officials in June had predicted a $1.6 billion deficit for the 2027-28 school year. But an updated version of the budget approved by the board last week eliminates the deficit by using reserve funds plus cost-cutting measures over the next two years.
The planned cuts to school budgets will begin in the 2026-27 school year, with school consolidations and staffing reductions planned for the following school year, said LAUSD Chief Financial Officer Saman Bravo-Karimi.
“We have fewer students each year, and in LAUSD that’s been the case for over two decades,” Bravo-Karimi said. “That has a profound impact on our funding levels. Also, we had the expiration of those one-time COVID relief funds that were very substantial.”
The district recently contracted with the consulting firm Ernst and Young to create models for closing and consolidating schools. While school officials wouldn’t say which schools or how many would be closed, the district has clearly been shrinking.
Enrollment last year fell to 408,083, from a peak of 746,831 in 2002. Nearly half of the district’s zoned elementary schools are half-full or less, and 56 have seen rosters fall by 70% or more.
Bravo-Karimi said in the current school year the district will spend about $2 billion more than it took in from state, local and federal funding. The trend of overspending is expected to continue next year and the year after that, he said.
The district’s board in June approved a three-year budget plan that included a $18.8-billion budget for the current school year. The plan delayed layoffs until next year, and funded higher spending in part by reducing a fund for retirees’ health benefits.
$425 million by clawing back funds that went unused by schools each year
$300 million by reducing staffing and budgets at central offices
$299 million by cutting special funding for schools with high-needs students
$120 million by cutting unfilled school staffing positions
$30 million by consolidating schools
$16 million by cutting student transportation
Bravo-Karimi said the district gets virtually all of its money through per-pupil funding from the state. Since enrollment in the district has fallen steadily for decades, and then sharply since the pandemic, funding is down significantly, he said.
Most zoned L.A. elementary schools are almost half empty, and many are operating at less than 25% capacity. Thirty-four schools have fewer than 200 students enrolled; a dozen of those schools once had enrollment over 400.
Bravo-Karimi said the district would assess the needs of communities and the conditions at local schools before it makes any decisions about school closings or consolidations.
“That process needs to play out before any decisions are made about potential consolidation of school facilities,” he said.
Bravo-Karimi said other factors, including ongoing negotiations with labor unions, and changes to state funding, will further impact the district’s budget in the coming months.
Marguerite Roza, director of the Edunomics Lab and Research Professor at Georgetown University’s McCourt School of Public Policy, said the cuts planned for LAUSD are “relatively mild” compared to overall size of the district’s budget and cuts being considered at other districts around California and the rest of the country.
“I don’t think the people in the schools are going to notice that there’s a shrinking of the central office or that they’re using reserves,” said Roza. “Unless you’re one of the people who loses their transportation or if you’re in one of the schools that gets closed.”
But, Roza said, many of the cuts taken by LAUSD can only be made once, and the district still faces profound changes as enrollments continue to fall and downsizing becomes more and more necessary.
“This really should be a signal to families,” said Roza of the planned cuts in the district’s latest budget. “After several years of really being flush with cash, this is not the financial position that LA Unified is going to be in moving forward.”
LAUSD Board Member Tanya Ortiz-Franklin, who represents LAUSD’s District Seven, which includes neighborhoods such as South L.A., Watts and San Pedro, said the district will work to shield kids from the impact of budget cuts.
But, Ortiz-Franklin said, the district hired permanent staffers with one-time COVID funding, and now some of those staffers will have to be let go.
Still, LA Unified has made strong gains since the pandemic, she said, and the district must work hard to preserve its upward trajectory despite financial headwinds.
“We would love to share good news, especially this time of year,” said Ortiz-Franklin. “But the reality is, it is really tough.”
School leaders across LAUSD received preliminary budgets for the next year over the last few weeks, said Ortiz-Franklin. Some schools in her district are facing cuts of up to 15%, forcing them to make tough decisions on which staffers to keep and who to let go.
Several hundred additional layoffs will be announced in February, she said, when the district makes another assessment of staffing needs.
“We don’t know the total number yet, and we don’t know which positions yet,” said Ortiz-Franklin.
Did you use this article in your work?
We’d love to hear how The 74’s reporting is helping educators, researchers, and policymakers. Tell us how
In today’s highly competitive education landscape, schools at every level, from K–12 academies to public universities, must embrace modern, digital-first marketing strategies to attract and retain students. The era of relying solely on word-of-mouth or physical brochures is long gone. Today’s families and prospective students are browsing school websites, scrolling through social media, and watching virtual campus tours before they fill out an inquiry form or attend an open house.
To stay relevant and competitive in 2025 and beyond, schools need to meet their audiences where they are: online. That means showing up with targeted, compelling content and a clearly articulated value proposition. This is especially true for private and independent institutions, where high tuition fees and rising parental expectations demand a more persuasive, proactive approach to enrollment marketing.
So, how can your school stand out in an increasingly crowded space?
In this article, we break down 10 of the most effective marketing strategies for schools, with a strong emphasis on digital tactics. From strengthening your web presence to leveraging alumni stories and optimizing for SEO, these proven approaches help build awareness, trust, and engagement. Each strategy includes real-world examples from schools and colleges around the world to inspire your next campaign.
Whether you’re marketing a small language institute or a large university, these strategies are adaptable to your goals and designed to drive results.
Struggling with enrollment and retention?
Our innovative marketing strategies can help you generate more leads.
1. Understand Your Audience and Craft Your Message
A strong school marketing strategy begins with clarity: who exactly are you trying to reach, and what do they need to hear from you? Whether you’re a K–12 school or a higher ed institution, knowing your audience inside and out is essential. That means digging deeper than just age or location. Consider their priorities, concerns, motivations, and communication preferences.
Creating audience personas helps bring these insights to life. Is your ideal family looking for academic rigor, a supportive community, or flexible scheduling? Are your prospective students career changers seeking fast-track credentials, or teens drawn to innovation and student life? When you define who you’re speaking to, you can tailor your messaging to resonate and avoid generic outreach that falls flat.
Your next step is to articulate your school’s unique value proposition. What makes you different? Highlight that core message consistently across all channels. For some schools, it might be small class sizes and a nurturing environment. For others, it could be career outcomes, cutting-edge labs, or global learning opportunities.
Finally, data can deepen your understanding of your audience. Track behavior, segment leads, and personalize your outreach accordingly. The more relevant your message, the more likely it is to convert.
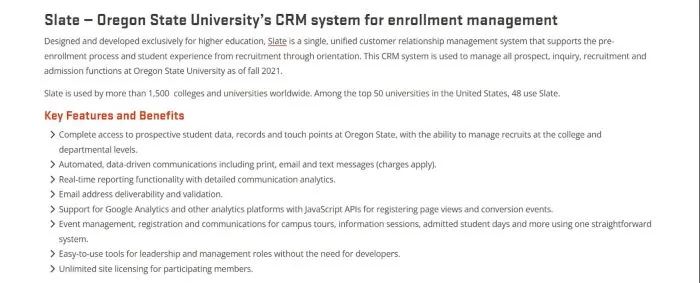
Example:Oregon State University (OSU). OSU’s enrollment team uses a CRM (Slate) to segment prospective students by factors like academic interests, intended majors, and geographic location. This lets OSU deliver tailored messages to each audience segment. For example, sharing engineering content with STEM-interested prospects or inviting nearby students to local events. By defining clear audience personas and emphasizing OSU’s unique offerings (like its “Beaver Nation” community and research opportunities) in communications, OSU ensures its outreach resonates more and converts better than one-size-fits-all marketing.
In a nutshell, how do you create a marketing strategy for a school? A strong school marketing strategy starts by defining your goals and audience, then clarifying your unique value proposition. Choose the right channels: website, SEO, social media, email, events, etc., all while keeping messaging consistent. Implement your plan, track performance with analytics, and adjust as needed to improve enrollment results.
2. Turn Your Website into a Top-Performing Recruiter
Your school’s website is more than just a digital brochure. It’s your hardest-working recruiter, available 24/7. In most cases, it’s the first real impression you make on prospective students and their families. If it’s outdated, hard to navigate, or slow to load, visitors may bounce before they ever reach your inquiry form. On the other hand, a fast, intuitive, and compelling site can drive real results: inquiries, campus visit bookings, and applications.
To make your website enrollment-friendly, focus on these key areas:
Navigation and user experience: Make it easy for visitors to find what matters most: admissions, tuition, programs, and deadlines, within one or two clicks. Prioritize clarity and mobile optimization, since the majority of users now browse on their phones.
Engaging content: Use vibrant photos, student stories, and program highlights to showcase your school’s personality and value. Don’t just state facts; tell stories that build emotional connection.
Clear CTAs: Every page should lead users to the next step, whether it’s “Book a Tour” or “Start Your Application.” Make buttons visible, and forms short and intuitive.
SEO and visibility: Build search-friendly content using keywords like “STEM high school Toronto” or “MBA in Montreal.” This boosts your visibility when families search online.
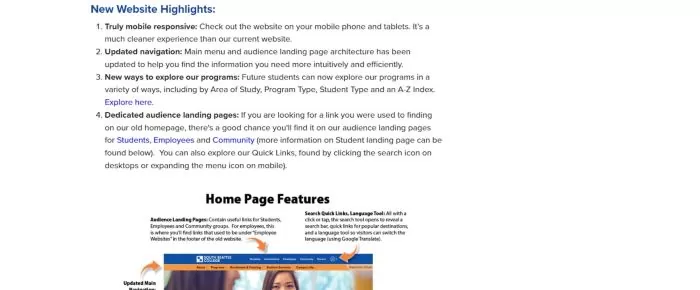
Example:South Seattle College. This college launched a fully redesigned, mobile-responsive website to serve as a “24/7 digital front door” for prospective students. The new site features simplified navigation (with intuitive menus and audience-specific landing pages), fast load times, and engaging content like student stories and virtual tour videos. Key information: admissions steps, programs, costs etc., is now accessible within one or two clicks. After the revamp, South Seattle College saw improved user engagement and more inquiries, validating that an optimized website can effectively guide visitors from interest to application.
3. Meet Students Where They Scroll: Social Media Engagement
If you’re wondering how to effectively reach today’s students, social media is your answer. Teenagers, young adults, and even their parents spend hours every day scrolling through platforms like Instagram, TikTok, Facebook, YouTube, and LinkedIn. That’s why a modern marketing strategy for schools must go beyond occasional polished posts. It also requires consistent, authentic, and engaging content that brings your school community to life online.
Social media allows prospective students to virtually experience your school before they set foot on campus. They can witness student life, explore your values, and interact with your team through comments and DMs. It’s a space where schools can showcase achievements, run virtual events, answer questions, and create lasting impressions, all within the platforms students already use. Social media engagement fosters emotional connection, builds trust, and nudges prospective students closer to applying.
Here are some proven tactics to strengthen your social media presence:
Student Takeovers: Give students the reins of your Instagram or TikTok for a day to showcase a “real life” perspective of your campus.
Interactive Campaigns: Launch challenges, quizzes, or hashtag contests to generate user content and boost engagement.
Alumni & Academic Outcomes: Share stories of success to inspire and build credibility with prospective students and their families.
Paid Targeted Ads: Reach niche audiences with specific messaging using Facebook, YouTube, or TikTok ad campaigns.
Responsive Community Management: Monitor comments and messages daily. Prompt, friendly responses go a long way in reinforcing your school’s reputation.
Above all, be authentic. Today’s students crave realness. A spontaneous student dorm tour recorded on a phone often outperforms a high-production video. Showcasing your campus culture in a way that’s natural and not overly scripted can drive stronger connections and higher conversions.
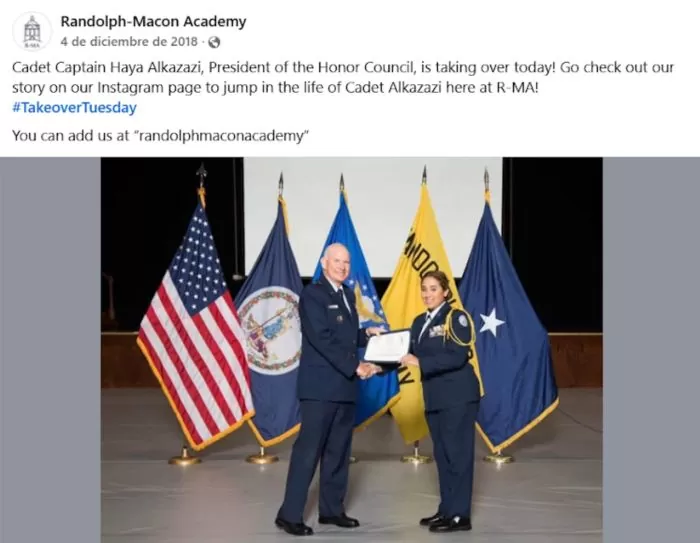
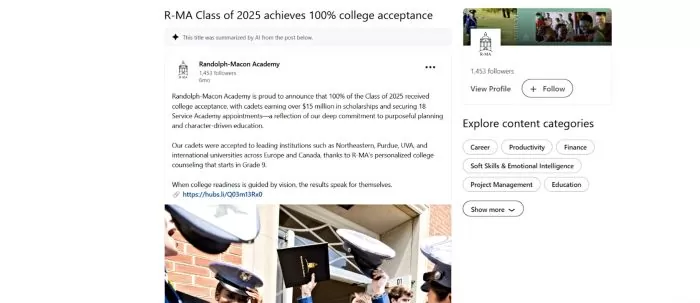
Example:Randolph-Macon Academy (R-MA). This college-prep boarding school brings campus life directly to student prospects through interactive social media campaigns. On Instagram, R-MA runs “Takeover Tuesday” events where a student cadet literally “takes over” the school’s Story for the day, posting candid glimpses of classes, dorm life, and activities. This unfiltered, student-eye view generates high engagement from peers. R-MA also leverages LinkedIn to celebrate outcomes with a recent post that 100% of its senior class earned college acceptances and over $15 million in scholarships. By showcasing real student experiences and achievements on the platforms teens (and their parents) already use, R-MA humanizes its brand and builds trust.
4. Bring Your Campus to Their Couch: Virtual Tours and Online Events
For many families, a campus visit is a pivotal moment in the school decision process. It’s their chance to imagine themselves in your hallways, dorms, and classrooms. But not every prospective student can visit in person, whether due to distance, cost, or scheduling. This is where virtual tours and online events come into play, offering an immersive, flexible way to connect with your audience.
Virtual campus tours can now offer interactive 360° experiences that let students “walk” the grounds from their laptop or phone. These tours help build familiarity and emotional connection, especially for international or out-of-state students who might otherwise never see your campus. To boost engagement, add clickable info points, video testimonials, or even voiceover guides.
Online events like virtual open houses or themed webinars allow families to meet admissions teams, ask questions, and hear directly from current students, all from home. They not only replicate key elements of in-person experiences but also allow for on-demand access after the event.
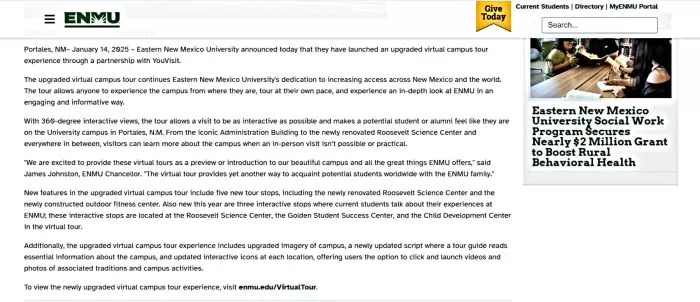
Example:Eastern New Mexico University (ENMU). ENMU launched an upgraded 360° virtual tour that lets prospective students explore the campus from anywhere in the world. This immersive tour includes interactive 360° views of key locations (from dorms to labs), pop-up info points with photos/videos of traditions, and even student-narrated segments sharing personal stories. A voiceover guide leads viewers through the experience, making it feel like an actual guided tour. ENMU’s chancellor noted the virtual tour “makes a potential student feel like they are on campus” and has become invaluable for out-of-state and international recruits. The tour’s engaging features (clickable videos, student testimonials embedded at certain stops) have driven higher web engagement and helped ENMU widen its reach beyond those able to visit in person.
5. Let Video Tell Your Story: Content Marketing That Connects
There’s a reason platforms like YouTube, Instagram Reels, and TikTok dominate attention spans. Video provides an immersive, emotional, and memorable experience. For schools trying to reach prospective students and families, video marketing is one of the most powerful tools available. Whether it’s showcasing campus energy, highlighting academic strengths, or sharing personal student journeys, video content brings your story to life in a way text and photos simply can’t.
To make the most of this format, consider these video types:
Campus Tour Highlights: Condense your full tour into a 2–3 minute walkthrough with student narration. Post it on your homepage and YouTube channel for first-time visitors.
Student Testimonials and Success Stories: Capture authentic, unscripted interviews with students or alumni. These peer voices create trust and make your school’s impact tangible.
Faculty and Program Spotlights: Let your passionate educators shine. A quick feature on a robotics project or an art studio session can attract students with similar interests.
Event Recaps: Turn school events into fast-paced highlight reels for Instagram and Facebook. It shows your community is vibrant and active.
Explainer Videos: Break down complex topics, like admissions or financial aid, into short, helpful animations or on-camera guides.
Authenticity beats polish. Videos filmed on smartphones by students or “vlog ambassadors” can feel more relatable than professional productions. Consistent content, especially when optimized with keywords on YouTube, also improves discoverability in search.
Example: Academy of Applied Pharmaceutical Sciences (AAPS, Canada). AAPS relies heavily on short-form video content to showcase student life and outcomes viscerally. The college regularly produces “Student Success Story” videos – for example, a 2-minute clip of an alum describing how AAPS training led to their new career in clinical research. It also shares behind-the-scenes footage of lab sessions and student projects on its YouTube channel and Instagram. These authentic clips (often featuring actual students and instructors) put a human face on AAPS’s programs and build credibility.
In short, video marketing allows your school to connect emotionally and visually with prospective students, meeting them where they already spend time. If you want to advertise in a way that engages and inspires, video is essential.
6. Be There 24/7 with Smart Chatbots and Live Chat
Imagine a student browsing your website at midnight, wondering, “Does this college offer scholarships for international students?” If no one’s there to answer, that potential lead might bounce and never return. This is where chatbots and live chat tools step in, transforming your website into a 24/7 support hub.
Modern AI-powered chatbots go far beyond basic FAQ responses. They’re now capable of delivering personalized answers based on user input, guiding visitors to the right pages, and capturing lead information in real time. In fact, some bots can handle up to 80% of standard inquiries, freeing your admissions team to focus on complex cases or high-touch prospects.
Schools use chatbots to address questions about tuition, program options, campus life, deadlines, and more. Better still, if a query goes beyond the bot’s programming, it can prompt a human follow-up, keeping the conversation going instead of losing the lead.
Live chat is another powerful layer. Having staff available during business hours to chat in real time, whether on your site or via Messenger, feels like having a front-desk greeter online. Quick answers build trust and reduce friction in the inquiry process.
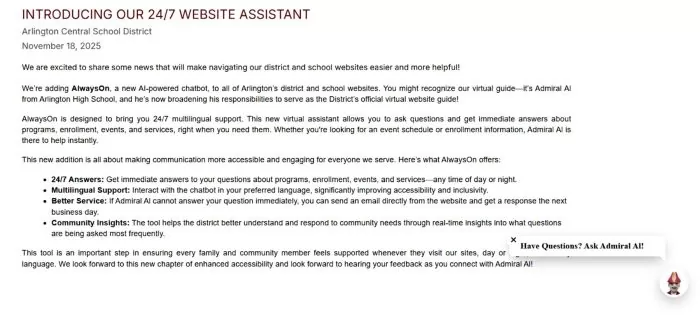
Example:Arlington Central School District (New York). This K–12 district rolled out an AI virtual assistant named “AlwaysOn – Admiral Al” across all its school websites to ensure families can get information anytime. The friendly chatbot (branded with the high school’s mascot) offers 24/7 multilingual support, answering common questions about programs, enrollment procedures, event schedules, and more in English or Spanish. If the question is too specific, “Admiral Al” even lets the user submit an email query right within the chat, guaranteeing a human follow-up by the next business day. The district implemented this tool to improve customer service for busy parents and saw immediate benefits – families could instantly find out, say, how to register a new student or the date of graduation, without calling the office.
To make your chatbot successful, keep it friendly and transparent (let users know it’s a virtual assistant), program it with up-to-date FAQs, and offer a handoff to a real person when needed. For international recruitment, consider a multilingual bot to expand your global accessibility.
Ultimately, integrating chatbot and live chat tools into your school’s marketing strategy ensures you never miss a lead because of timing. Today’s students expect immediate answers. With the right tools, your school can be ready.
7. Leverage Testimonials and Reviews (Let Your Community Do the Talking)
Word-of-mouth has long been a trusted marketing strategy for schools, and in today’s digital world, it has taken on new forms, testimonials, reviews, and social proof. These are powerful tools that lend credibility to your school’s messaging by showing that real families and students have had positive experiences.
Start by gathering testimonials from students and parents. A few genuine quotes or short videos can build trust quickly. Display these across your website, especially on admissions pages and brochures. A heartfelt statement like, “After enrolling here, my daughter blossomed academically and socially,” resonates more than polished ad copy.
In parallel, encourage online reviews on platforms like Google or Facebook. Higher ratings improve visibility and ease prospective families’ doubts. Politely prompt current families to share feedback after positive experiences, such as school events or parent meetings.
Social media also plays a role. Repost authentic student or alumni praise, and consider launching hashtags to gather testimonials organically.
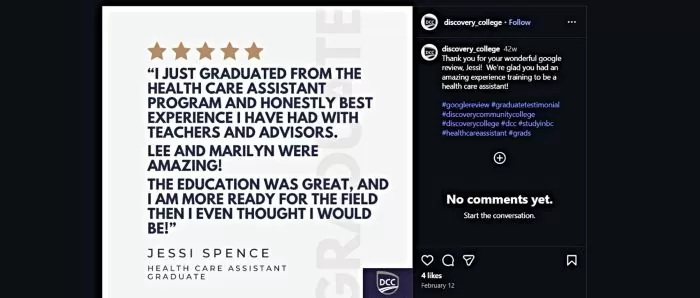
Example:Discovery Community College (Canada). This career college amplifies positive word-of-mouth by actively sharing student reviews on social media. For example, Discovery CC monitors its Google Reviews, and when a 5-star review comes in, the marketing team creates an Instagram post thanking the student by name and highlighting their feedback. One such post reads: “Thank you for your wonderful Google review, Jessi! We’re glad you had an amazing experience training to be a health care assistant!” – accompanied by a screenshot of the review. By publicly celebrating real student voices, the college not only boosts morale but also provides authentic social proof to prospective students scrolling by.
Letting your community advocate for you builds trust faster than any ad campaign, and it costs nothing.
8. Nurture Leads with Email Marketing and Personal Touches
What is the best marketing for independent schools? Independent schools succeed with targeted, budget-friendly inbound marketing. The best approach is a strong online presence: a content-rich, search-optimized website, active social media that highlights student life, and helpful emails or blogs that build trust. These tactics attract the right families and strengthen community engagement.
Once an inquiry is made, the follow-up becomes mission-critical. One of the most effective marketing strategies for schools includes consistent, personalized nurturing, especially through email and SMS.
Email remains a powerful tool when tailored. Instead of generic blasts, use segmentation to send relevant content. For instance, a prospect interested in Nursing should receive a series featuring faculty profiles, student success in healthcare, and clinical placement details. Someone focused on Athletics? Highlight sports facilities, team achievements, and balancing academics with sports.
Drip campaigns work best: Day 1, a welcome email; Day 3, value-focused content; Day 7, a testimonial or event invite. Marketing automation tools like HubSpot or Mailchimp make this scalable and adaptive based on user behavior.
Complement email with timely SMS reminders for events or deadlines. Use sparingly for impact.
Finally, add a personal touch. A call or handwritten note after a campus visit or audition can leave a lasting impression. These gestures build trust and demonstrate care, key ingredients in a family’s final decision. Effective nurturing turns interest into action and inquiries into enrollments.
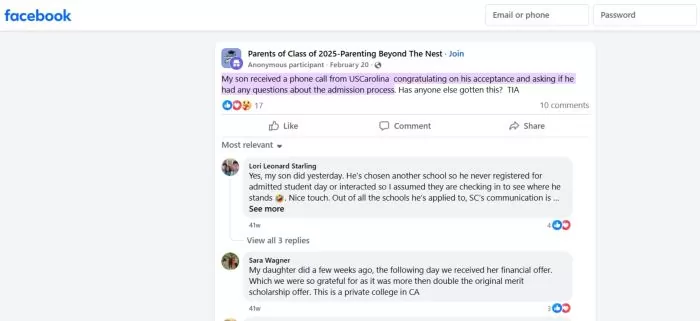
Example:University of South Carolina (USC). USC’s admissions team adds a decidedly personal touch to lead nurturing by picking up the phone to congratulate admitted students. These informal chats help admitted students feel valued and give them a chance to voice any concerns. USC also involves faculty and current students in the follow-up process; for instance, an admitted engineering major might get an email or call from an engineering professor or student ambassador.
9. Host Events (On-Campus and Virtual) That Educate and Inspire
Hosting well-crafted events is one of the most effective ways to turn interest into enrollment. On-campus events like open houses and shadow days allow families to experience your community firsthand. Keep them interactive, offer student-led tours, informal chats with faculty, and performances to showcase school spirit. These real-world interactions make your school more memorable.
Virtual events also carry weight, especially for international or out-of-town prospects. Live webinars, themed Q&A panels, and online workshops let families connect from anywhere. Consider sessions like “How to Write a Great Application Essay” or alumni panels sharing career outcomes.
Each event is also a content opportunity. Record webinars, collect quotes, and share visuals across your channels. Personalized follow-ups (“Thanks for attending, here’s what’s next”) help nurture those leads further.
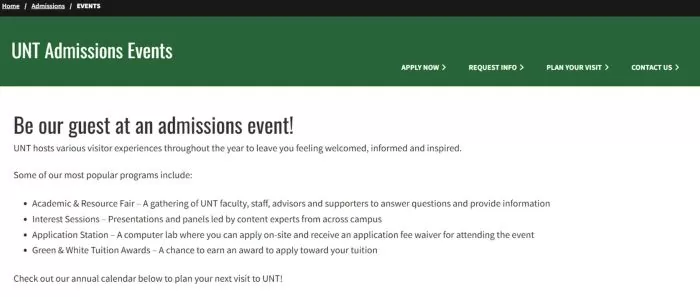
Example:University of North Texas (UNT). UNT offers an array of admissions events designed to welcome and inform prospective students, including both in-person programs and online sessions. One flagship initiative is the UNT Admissions Webinar Series – live virtual information sessions “designed just for students who haven’t applied yet.” These free webinars walk attendees through what makes UNT unique, tips on the application process, and key deadlines, all from the comfort of home. Admissions counselors appear on camera to answer questions in real time, so participants leave with personalized info and confidence about next steps. For those who can visit campus, UNT also hosts large open-house events like “UNT Preview,” a conference-style open day with academic fairs, tours, and even an on-site Application Station where students can apply and get the fee waived.
10. Showcase Outcomes and Alumni Success (Paint the Long-Term Picture)
When families invest in an education, whether paying private tuition or college fees, they want proof that it leads to success. That’s why one of the most compelling marketing strategies for schools is to showcase outcomes. You’re not just selling a school experience; you’re selling what it makes possible.
For K–12 and college-prep institutions, highlight metrics like college acceptance rates and scholarship totals. Randolph-Macon Academy (R-MA), for example, proudly advertises a 100% college acceptance rate and over $15 million in scholarship offers for its 2025 graduates. That kind of evidence quickly signals ROI to prospective families.
Example:Randolph-Macon Academy (R-MA). R-MA prominently advertises its student outcomes to give families confidence in the long-term ROI of its program. For example, the academy proudly announced that 100% of its Class of 2025 earned college acceptances, collectively securing over $15 million in scholarships and 18 appointments to prestigious U.S. Service Academies. This kind of outcome data is highlighted on R-MA’s website and social media, signaling to prospective parents that an R-MA education leads to tangible success. The school also regularly publishes lists of colleges and universities its graduates attend (Ivies, top public universities, military academies, etc.), and shares alumni spotlights – like profiles of graduates who have become pilots, doctors, or entrepreneurs. By showcasing these results, R-MA helps future students (and their parents) visualize their own potential trajectory and trust that the tuition investment will pay off in opportunities.
Vocational or language schools should spotlight relevant results: job placement rates, certifications earned, or skill development gains.
Don’t just rely on stats. Share alumni stories that reflect diverse paths: scientists, entrepreneurs, activists, artists. Feature them on your blog or social channels, and invite them to participate in webinars or info sessions.
On your website, dedicate a section to “Success After Graduation,” including employer logos, testimonials, or infographics. And use social media to celebrate alumni news. These stories build credibility, trust, and vision, which help future students imagine their path through your school.
Turning Strategy into Enrollment Success
In today’s dynamic and competitive education landscape, schools can no longer rely on traditional tactics or word-of-mouth alone. To thrive, they need a strategic, student-centric marketing approach that speaks to modern families across digital platforms. The ten strategies outlined in this article, from optimizing your website and leveraging social media to showcasing alumni outcomes, offer a blueprint for schools to increase visibility, build trust, and convert interest into enrollment.
Whether you’re a K–12 academy, career college, language school, or university, the key is to meet prospective students where they are, communicate your unique value clearly, and guide them confidently through their decision-making journey. When implemented with authenticity and consistency, these strategies not only help fill seats, they strengthen your school’s brand and foster lasting relationships with students and families. In short, great marketing helps the right students find their right-fit school.
Struggling with enrollment and retention?
Our innovative marketing strategies can help you generate more leads.
Frequently Asked Questions
Question: How do you create a marketing strategy for a school?
Answer: A strong school marketing strategy starts by defining your goals and audience, then clarifying your unique value proposition. Choose the right channels: website, SEO, social media, email, events, etc., all while keeping messaging consistent. Implement your plan, track performance with analytics, and adjust as needed to improve enrollment results.
Question: What is the best marketing for independent schools?
Answer: Independent schools succeed with targeted, budget-friendly inbound marketing. The best approach is a strong online presence: a content-rich, search-optimized website, active social media that highlights student life, and helpful emails or blogs that build trust. These tactics attract the right families and strengthen community engagement.
This audio is auto-generated. Please let us know if you have feedback.
Some school boards have recently rejected their districts’ school closure plans at a time when declining student enrollment continues to plague district budgets nationwide. As districts push for closures amid the dwindling enrollment numbers and budget deficits, board members say they need more time to consider plans that would cause major disruptions to their communities.
In Pennsylvania, for instance, 6 of 9 board members at Pittsburgh Public Schools voted on Nov. 25 against the district’s proposal to close nine schools by the end of the 2027-28 school year. The vote came a day after the school board held a three-hour public hearing on the possible closures with a majority of speakers denouncing the district’s plan, according to CBS Pittsburgh.
Gene Walker, the board’s president, said during a Nov. 25 meeting that “in the short-term” he would vote against the closures after hearing public feedback on the issue. Walker added that he thinks the board will need more time to decide on closures, especially as several new board members were set to be sworn in the coming days.
“It’s my personal opinion that we are not in a space where we can properly support the superintendent and his team in this work,” Walker said.
The district recommended the school closures as it faces a projected budget deficit of nearly $11.4 million for the 2025-26 school year. Pittsburgh Public Schools also expects its total expenditures to continue to outpace its total revenue in the coming years. If the district closed the nine schools, Pittsburgh Public School administrators said it could have also saved nearly $103 million by 2031.
The district’s enrollment has steadily decreased over the past five years, dipping from 19,159 students to 17,937 between the 2021-22 and 2025-26 school years. Two decades ago, the number of enrolled students was much higher at 32,529, according to the Allegheny Institute, a nonprofit research and education organization.
Pittsburgh Public Schools Superintendent Wayne Walters said in a Wednesday statement to K-12 Dive that he does not fully agree with the “path” the district’s school board is on right now, but he respects its decision and is committed to finding a “responsible, equitable path forward” with board members.
“Without action, we remain a system unable to deliver the consistent academic and enrichment opportunities our children deserve — one where access too often depends on the building a student attends,” Walters said. “At the same time, our financial stability continues to decline as we stretch limited resources across too many buildings.”
Elsewhere, the school board for Alaska’s Anchorage School District rejected plans on Nov. 18 to close two elementary schools. In a board recap post, the district noted that it’s already had to close five schools since 2015 due to lowering student enrollment. While Anchorage School District has the capacity to serve 50,000 students, only 42,000 are currently enrolled, according to the district.
In Wisconsin, theEau Claire Area School Districtsaid in November that it was no longer considering a proposal to consolidate several elementary schools, according to WEAU 13 News.
The district said on its website that it was planning to consolidate the schools as it continues to see elementary enrollment decline because of lower birthrates and demographic shifts.That planning process began earlier this year. An October report from the district’s Superintendent Mike Johnson shows student enrollment has dropped from 10,267 to 9,910 students between the 2017-18 and 2025-26 school years.
Still, Johnson told WEAU 13 News that the enrollment challenges aren’t going away. “For next year, our second largest class in the district is our 5th grade class,” Johnson said. “If the trends occur the way they have been, when those students exit and go to middle school, we’ll be down 110 students.”
The changed course for Eau Claire Area School District came after families organized to push back against the proposed consolidation plans through a “Save Our Neighborhood Schools” campaign.
Under the district’s proposal, the campaign said the closing of a neighborhood school means children would be “split across multiple elementary schools,” families could no longer access a walkable, community school, and property values would drop because without “the appeal of top-tier schools.”
‘A consequence of not confronting the reality’
Closing underenrolled schools “is a deeply painful decision,” said Thomas Dee, a professor at Stanford University’s Graduate School of Education. These schools, in many ways, are “the fabric of communities who often have a kind of focal identity” around these places, he said.
But when underenrolled schools are kept open, Dee said that comes at a higher cost to the district and ultimately to students. By keeping under-capacity schools open, districts have to spend extra money per student to keep the buildings operating, he added. Those additional costs can then translate into less financial resources for other things students benefit from and need districtwide, such as school transportation, diverse course offerings, or smaller class sizes.
“Closing a school is highly visible and painful, but watching needed instructional supports disappear, or watching class sizes grow, watching fewer hours from a school nurse, all of that is less visible but can be a consequence of not confronting the reality,” Dee said.
It’s important that districts choosing to forego closures amid declining enrollment understand those difficult tradeoffs, and that it’s likely this enrollment challenge isn’t going away, he said.
Dee added that school districts could run the risk of a state takeover if they can’t get a hold of their finances. In the case of a state takeover, communities would no longer have agency over how their local schools run, he said.
“The only way to release that tension is for communities to increase their own property taxes or for states to increase aid through higher sales and income taxes,” Dee said.