Fewer than 52% of Indiana high school graduates from the Class of 2023 went directly to college, according to the latest data quietly released by the Indiana Commission for Higher Education.
Just 51.7% of 2023 graduates, about 39,000 students, enrolled in college within a year of finishing high school, data showed. That’s down from a steady 53% between 2020 and 2022, and far below the state’s peak of 65% a decade ago.
Around 36% of all graduating seniors enrolled in one of Indiana’s public four-year institutions, followed by 8% who chose a private college or university.
Another 7.6% went to a school outside of Indiana, according to the data.
The figures, posted to the agency’s website earlier this month, reflect concerns state leaders have long expressed about Indiana’s declining college-going culture, especially as the state shifts focus toward career credentials and work-based learning.
“The startling drop in our college-going rate yet again can be credited to the lack of two things: money and morale,” said Rep. Ed DeLaney, D-Indianapolis, in a statement released Wednesday.
“While our governor has been taking a victory lap for getting our state universities to freeze tuition, he has failed to guarantee that his move will not decrease financial aid and scholarship opportunities,” DeLaney continued. “Any lack of opportunity for tuition support will lead to more Hoosiers not being able to afford college and being forced to choose a different path.”
The 2023 numbers come just six months after the higher education commission approved sweeping changes to Indiana’s high school diploma, set to take effect statewide in 2029, that emphasize work-based learning and career readiness over traditional college preparation.
High schoolers will be required to earn at least one “diploma seal” to graduate, including options for employment or postsecondary readiness. While some seal options are specifically geared toward college-bound students, graduates will no longer be required to complete all the coursework or meet other criteria typically expected for college admission.
Rep. Ed DeLaney, D-Indianapolis, sits in the House Education Committee on Wednesday, Feb. 12. (Casey Smith/Indiana Capital Chronicle)
DeLaney maintained that Republican leaders “have been devaluing the opportunities that our colleges and universities can offer students.”
“At the same time, the supermajority has made attacking colleges and universities the centerpiece of their culture war agenda — from policing what can be taught in the classroom, to forcing institutions to eliminate hundreds of degree options, to creating an entirely new high school diploma that emphasizes the path directly into the workforce,” the lawmaker said.
“Trying to bury this report in a website and not send a press release is a telling sign that the Commission on Higher Education knows this does not look good, and does not act to fix it,” DeLaney added. “It simply isn’t important enough to them. They are busy eliminating college courses and creating new tests. This is what the legislature has asked them to do.”
CHE has not issued a press release on the latest data and did not immediately respond to a request for comment Wednesday.
Indiana’s college-going rate has dropped more than any other state tracked by the National Center for Education Statistics over the past 15 years.
Previously, Indiana reached a college-going rate of 65%.
“We set a goal to get it back when it slumped,” DeLaney recalled. “Now, it doesn’t seem like we care to address the issue. That is a shame for our students, a shame for our economy, and a shame for our state.”
“The supermajority has been in power for 20 years and this is their achievement,” DeLaney said. “At some point we have to ask ourselves: is a declining college-going rate not the result they want?”
By the numbers
According to the numbers published on CHE’s online college-going dashboard, the vast majority of 2023 grads who continued their education earned some form of college credit while still in high school: 85.6% of college-goers took and passed an Advanced Placement exam; 64.6% earned dual credit; 90.7% earned the Indiana College Core diploma, which comes with a block of 30 general education credits that can be transferred to and accepted at colleges across the state; 86.3% earned as associate’s degree; and 63.6% earned another type of credential.
A quarter of postsecondary enrollees, 25%, are seeking STEM-related degrees, while:
17.8% enrolled in business and communications programs
16% enrolled in health programs
11% enrolled in social and behavioral sciences and human services programs
9.9% enrolled in arts and humanities programs
7.4% enrolled in trades programs
5.8% enrolled in education programs
7% were undecided
College-going among male students dropped to 45%, compared to 59% for female students — widening an existing gender gap.
Among racial groups, Asian and white students had the highest college-going rates, at 70.7% and 54%, respectively. The college-going rates among other racial groups lagged, though, at 45.5% for Black students, and 41.7% for Hispanic students.
The rate for students from low-income backgrounds — as measured by eligibility for free or reduced lunch — was 38.7%, compared to about 60% for their higher-income peers.
More than 78% of college-bound graduates from the 2023 cohort were part of Indiana’s 21st Century Scholars program, according the the new data. The scholarship fund covers full tuition and fees at Indiana colleges and universities for low-income students, who enroll in the 8th grade.
Also previewed in the data was an update on the Class of 2022.
The CHE dashboard showed 53% of the 2022 cohort that enrolled in a postsecondary program within a year after high school graduation met all three early college success benchmarks: they did not need remediation; they completed all courses they attempted during their first year of enrollment; and they persisted to their second year of schooling.
According to the latest numbers, 77.5% of the 2022 cohort that enrolled in a postsecondary program persisted to the second year.
Indiana Capital Chronicle is part of States Newsroom, a nonprofit news network supported by grants and a coalition of donors as a 501c(3) public charity. Indiana Capital Chronicle maintains editorial independence. Contact Editor Niki Kelly for questions: [email protected].
Why Higher Education Leaders Can No Longer Afford to Wait on AI Adoption
Just a few years ago, AI in higher education was largely a topic for innovation labs and speculative white papers. Today, it has moved from the periphery to the absolute core of institutional viability, particularly in the critical areas of marketing and enrollment management. Leaders who still view AI as a future investment, rather than an immediate operational imperative, risk being outmaneuvered by a competitive landscape that is already embracing this transformative power.
The global AI software market is projected to hit an astounding $126 billion by the end of 2025. From healthcare to transportation AI is now an integral part of daily operations, with a significant 78% of organizations reporting AI usage in 2024—a sharp increase from 55% in 2023. Generative AI specifically saw its usage in at least one business function jump from 33% in 2023 to a staggering 71% in 2024.
Here’s the uncomfortable truth: while your most proactive staff are already leveraging AI to drive results, many institutions are held back by analysis paralysis and strategic inaction. This is a direct threat to talent retention and competitive advantage.
While the general sentiment toward AI is increasingly positive, the report highlights that individual university staff are often far more receptive to using emerging technologies than their institutions. This leads to a significant gap between receptivity to AI in marketing and enrollment management and organization-changing operationalization of AI at an institutional level.
In 2025, 65% of survey respondents reported actively using emerging technologies like AI in their marketing and enrollment efforts, a substantial increase from 40% in 2024. However, this leaves over one-third of higher education marketing and enrollment management professionals on the outside of the AI revolution, falling further behind by the day. More troubling, only 61% indicated their institution is open to using these technologies. While the evidence suggests a growing openness to adopting critical technology, only 56 percent of institutions have a plan for upskilling staff in AI-driven tools.
Many respondents recognize a gap in their institutional AI readiness. A striking 56% of respondents don’t consider their institution a leader in implementing AI for marketing and enrollment management functions. When compared to peer institutions, 38% felt they were on pace, but 36% believed they were behind, with only 21% considering themselves ahead. This sentiment underscores a growing urgency to adopt AI, coupled with a pervasive feeling of being “behind the curve.”
AI is the Invisible Engine Driving Higher Ed
AI is a core component embedded directly in the recruitment, engagement and conversion platforms institutions already rely on. This widespread integration is transforming daily operations, as the 2025 survey highlights:
Nearly two-thirds (65%) of institutions utilize AI-enhanced creative and design tools.
Over half (51%) use social media management tools with embedded AI.
Customer relationship management (CRM) systems and data analytics platforms with AI features are used by 31% of institutions respectively.
The perceived effectiveness of these AI-powered tools is on the rise. Content generation, the most widely used AI application, was rated most effective, with 47% deeming it “very effective” or “effective.” Other applications like content optimization (41% effective) and customized ad and message delivery (39% effective) also showed strong results.
Moving beyond perceived effectiveness, AI integration is yielding direct, quantifiable improvements across marketing and enrollment operations:
69% of respondents reported improved efficiency in their workflows due to AI.
More than half (52%) observed an increase in the quality of their work.
Nearly half (48%) believe AI tool integration has positively impacted their enrollment funnel.
The study identified key areas where AI is delivering the strongest return on investment (ROI) including customized ad messaging, lead generation and creative content development. Content optimization also stood out, with 36% of respondents noting a “very high” or “high” ROI. If nearly 70% see efficiency gains and almost half see a positive impact on enrollment, why aren’t more institutions fully embracing this?
The Future is AI-Expected
Modern Learners Are Already There
Student engagement is AI-dependent. For Modern Learners artificial intelligence is a fundamental tool in their college search, essential for information discovery. This profound shift in how the next generation interacts with information demands institutions meet this baseline expectation. Otherwise, they risk being perceived as outdated, irrelevant or having their reputation pre-determined by AI itself.
Modern Learners are using AI to seek information on:
Tuition fees (57%)
Course offerings (51%)
Admission requirements (43%)
Campus facilities (37%)
Student reviews (35%)
This highlights the imperative for institutions to ensure their AI-accessible content, whether via chatbots or search optimization, directly aligns with what students are actively seeking.
What Leaders Are Envisioning
Looking ahead, institutional leaders envision even greater potential for AI-driven tools. Within the next two years, innovations such as:
…are expected to have a significant transformative impact on higher education marketing and enrollment management. These tools promise to address persistent challenges like the need for personalized outreach, improved insights into student behaviors and increased efficiency with limited resources.
The Barriers to AI Integration Progress
Despite the growing enthusiasm and proven benefits, institutions continue to face significant barriers to full AI integration. The top challenges cited by respondents include:
Budget constraints (76%)
Technical infrastructure readiness (64%)
Data privacy and security concerns (52%)
Staff readiness (50%)
Notably, these barriers have become even more pronounced since 2024, underscoring the urgent need for strategic investment and institutional alignment. Alarmingly, 44% of respondents reported their institution lacks a plan to upskill or support staff in adopting AI-driven technologies. This is a leadership failure, not a staff deficiency. Your most valuable asset, your people, are signaling a readiness for growth, yet nearly half of institutions are failing to provide the essential support.
The Only Action Plan You Need for AI Acceleration
The findings from the UPCEA and EducationDynamics study present clear implications for higher education leaders. The time for passive observation is over. Decisive action is required.
Invest Where Impact Is Proven Focus resources on AI applications already delivering proven ROI, starting with content creation, personalized ads and lead generation. Maximize every dollar in a constrained environment and accelerate returns and free up capacity for further innovation by allocating strategically.
Upskill Teams Invest in targeted training for both technical skills and change management is crucial to empower staff to effectively use AI tools and build confidence. Providing clear growth pathways tied to AI fluency can significantly improve staff engagement and retention, especially given that 34% of staff now report that their institution’s stance on AI impacts their likelihood of staying at that institution—a dramatic jump from just 1% in 2024. Furthermore, 90% of respondents view AI as a useful tool for their own professional growth. Failing to invest in AI fluency for your teams is effectively disarming them in a rapidly escalating competitive battle.
Align Leadership with Operational Readiness The nearly doubling of “lack of alignment with strategic priorities” as a major barrier (from 18% in 2024 to 33% in 2025) is an indictment of existing leadership structures. Institutional leaders must move beyond passive support and commit to actionable strategies for AI integration at an institutional level. This involves benchmarking adoption progress, embedding AI into strategic plans and allocating necessary resources to scale effective tools.
Establish Institutional AI Governance Without robust governance, AI adoption will be chaotic, risky and unsustainable. Creating governance structures that include marketing, enrollment, IT and data privacy leaders is essential. These groups should collaborate to develop responsible AI use policies, establish ethical guidelines and transparently communicate data privacy practices to prospective students. Only 49% of institutions currently have measures in place for ensuring student data security and privacy when using AI tools, though this is an improvement from 30% in 2024. Protect your institution’s reputation, ensuring ethical practice and safeguarding student data in an increasingly scrutinized environment.
A Bet Your Institution Can’t Afford
The 2025 study is a revelation of present realities. AI is the operational backbone of competitive higher education marketing and enrollment management. Institutions that have adopted AI are reporting measurable gains in effectiveness efficiency and ROI. The report unequivocally reinforces that delaying implementation means facing the significant risk of falling permanently behind, not only compared to AI-embracing peers but also in meeting the evolving expectations of students and staff.
For higher education, the challenge now lies in converting receptivity into decisive action, and scattered AI adoption into a cohesive institutional strategy. EducationDynamics provides the expertise, data-driven strategies and solutions to help institutions navigate the complexities of AI integration, meet the expectations of Modern Learners and secure a competitive edge in marketing and enrollment management. The future of higher education is AI-expected, and with EducationDynamics, your institution can lead the charge.
How can you capture the attention of teenagers who are skeptical of marketing?
Let’s stop pretending all teens are some mysterious, moody monolith. That old stereotype doesn’t hold up anymore, especially with what we know about how they think and behave today.
Recent research from TeenVoice shines a light on how different 13-year-olds and 18-year-olds are—not just in age, but in how they use social media, how skeptical they are of marketing, and what grabs their attention. The gap is massive, and it’s a huge wake-up call for anyone trying to reach them.
Here’s what science tells us about why teens aren’t just older versions of kids but are actually leveling up in how they think and engage:
1. Scrollers vs. Searchers
Younger teens mostly scroll social media for entertainment and fun; it’s their playground. Older teens, on the other hand, use platforms as tools for research and decision-making. They’re looking for real info, not just distractions. If your content isn’t easy to find or useful, it’s like you don’t exist to them. This fits with what Pew Research has found: nearly half of teens say they’re online almost constantly, but the way they use social media evolves with age toward more purposeful searching and information gathering (Pew Research Center, 2024).
2. Teen Skepticism Is Real and Growing
Adolescents don’t just blindly accept marketing messages. Their brains are developing the ability to question, analyze, and outright reject advertising that feels fake or manipulative. This skepticism comes from both cognitive development, when teens begin to think more critically and realistically, as well as social factors like peer influence and natural resistance to being sold to (Buijzen, 2009; Lumen Learning, n.d.).
3. Peer Stories Carry Weight
When teens hear stories from other students, real people with authentic experiences, it resonates more deeply than any slick ad campaign. Peer influence shapes decision-making significantly during adolescence, sometimes even more than adult advice. This isn’t just about risky behavior; positive peer stories can guide teens toward safer, smarter choices, too (Chein et al., 2011; Gardner & Steinberg, 2005).
4. Authenticity Isn’t Just a Buzzword
Gen Z, especially, are human BS detectors. They crave brands and messages that are honest, transparent, and aligned with their values. Authenticity builds trust, engagement, and loyalty, straight up. If your marketing feels forced or fake, they’ll scroll right past. This is backed by research showing authentic content generates way more engagement and lasting connections with young people (QuirkBank Media, 2025; History Factory, 2024).
5. The Brain Changes a Lot Between 13 and 18
The teen brain isn’t static. At 13, many teens are still developing concrete thinking and emotional regulation. By 18, their prefrontal cortex, the part responsible for reasoning, impulse control, and decision-making, is much more mature. This means the way you communicate with a 13-year-old will be very different from how you reach an 18-year-old who can think abstractly and critically. Treating them like the same audience is a recipe for missing the mark (National Institute of Mental Health, 2022; American Academy of Child and Adolescent Psychiatry, 2023).
What does all this mean to you if you work in enrollment marketing, admissions, or financial aid? Here are five takeaways.
Younger teens hang out on social media mostly to chill and have fun. So, if you want to catch their attention, keep things light, entertaining, and visual. Older teens want to dig in and figure stuff out. Make sure your info is easy to find and answers real questions, they’re not here to waste time.
Don’t try to sell with flashy slogans or over-the-top hype. Teens are sharp and skeptical. If your message feels fake or manipulative, they’ll tune out fast. Instead, be straightforward and honest, show them you respect their smarts.
Peer stories aren’t just noise, they’re gold. Real testimonials or student voices will hit way harder than any polished ad. Let your current students share their genuine experiences. That kind of authenticity influences teens more than anything else.
Authenticity isn’t a trend, it’s a must. If you want teens to trust and stick around, your marketing must feel real. That means ditching corporate jargon, being transparent about what you offer, and aligning with values that matter to them.
Remember, a 13-year-old isn’t just a smaller 18-year-old. Their brains and decision-making skills are still growing. Tailor your messaging for different age groups, simple and engaging for younger teens, more detailed and logical for older ones. One-size-fits-all won’t cut it.
Dive into more insights into teen behavior in the 2025 E-Expectations Report
If you want to see how these attitudes play out in college planning, what platforms students are actually using to explore colleges, how they interact with school websites, what makes them click (or ghost) your outreach, and how AI and privacy concerns are shifting the game, you need the latest data from the 2025 E-Expectations Trend Report.
In the full report, you’ll find answers to questions like:
Which digital resource do students trust the most for their college search?
Is email still alive (spoiler: yes), and what role does it play?
What are the make-or-break features for a college website?
Who’s using AI tools, and what do they really want from personalization?
Which social platforms drive engagement, and why?
If you want real, actionable insights, not just another “state of Gen Z” report, this report is your roadmap!
One shaped by search queries, digital experiences, instant communication, and high expectations. Today’s prospective students demand speed, personalization, and clarity from their first interaction. For institutions that want to grow, scale, and compete, relying on spreadsheets or legacy databases is no longer sustainable.
You need a system that works as hard as your team does. One that doesn’t just manage applicants, but empowers strategy, fosters connection, and drives retention.
That’s the promise of a modern Enrollment Management System (EMS), but only if you choose the right one.
What Is an Enrollment Management System?
An Enrollment Management System is more than a tool for admissions; it’s a digital backbone for your recruitment, application, and onboarding processes. Think of it as an intelligent, data-powered engine that drives student acquisition and supports institutional growth goals.
While many systems include basic applicant tracking and form building, a true EMS integrates across departments, touching admissions, marketing, student services, financial aid, and beyond. It’s designed to give your team a real-time view of the applicant pipeline while also enabling automation, analytics, and multichannel communication.
Example: Mautic by HEM is a dedicated, all-in-one CRM and marketing automation platform for education, built on the open-source Mautic tool. It facilitates thorough applicant tracking by letting schools define custom stages and funnels for the enrollment journey: admissions teams can monitor each contact’s progress through stages (inquiry, application, accepted, etc.) and even apply lead scoring to prioritize the most engaged prospects.
The best platforms don’t just move information. They orchestrate outcomes.
A modern EMS aligns your people, data, and processes so that your team spends less time chasing forms and more time building relationships. It adapts to your enrollment strategy, whether that’s growing international reach, increasing diversity, boosting conversion, or all of the above.
What Does an Enrollment System Do?
It streamlines student recruitment and admissions, enabling your team to launch campaigns, collect inquiries, and track applicant engagement without toggling between multiple platforms. While “enrollment management” is often associated with software, it’s fundamentally a strategic function, and the right EMS becomes a catalyst for this function to succeed.
Here’s how:
It streamlines student recruitment and admissions, enabling your team to launch campaigns, collect inquiries, and track applicant engagement without toggling between multiple platforms. From inquiry to enrollment, every stage is logged, measured, and improved.
Example: Tools like TargetX make it easy to launch campaigns, track lead engagement, and move prospects from inquiry to enrollment. TargetX is built on Salesforce and tailored for higher education, especially career colleges that need efficient outreach.
It enables marketing and communications teams to segment audiences, trigger campaigns, and personalize outreach across email, text, and student web portals, all with full visibility into what converts.
Example: EMS platforms such as Finalsite Enrollment combine CRM and marketing automation to segment audiences and personalize outreach across email, SMS, and web. Designed for independent K–12 schools, Finalsite ensures your message resonates from the first click.
It supports financial aid and yield strategy by syncing with your student information system (SIS) or CRM. That means your staff can track aid packages, award statuses, and net tuition impact, all within the same ecosystem.
Example: Integrated EMS like Anthology allows institutions to view aid packages, tuition forecasts, and academic data in one place. Anthology is especially powerful for institutions with complex admissions models or rolling start dates.
It strengthens student retention by providing advisors with access to academic history, risk indicators, and automated nudges that support at-risk students from the very start of their academic journey.
Example: By giving advisors access to risk flags and real-time data, platforms like Salesforce Education Cloud enable timely interventions that support students long after they’ve enrolled.
And most importantly, it delivers data analysis and forecasting that lets institutional leaders plan with precision. From demographic breakdowns to conversion rates, it provides insight into not just who applied but why they enrolled.
Example: With advanced analytics, tools like Technolutions Slate offer actionable insights into yield, demographics, and conversion rates, helping you refine your enrollment strategy over time.
What is the point of strategic enrollment management? The point of strategic enrollment management (SEM) is to align an institution’s recruitment, admissions, retention, and graduation strategies with its long-term goals, using data and coordinated planning to optimize student success and institutional sustainability. An effective EMS ensures that your strategic enrollment plan becomes an operational reality, daily, seamlessly, and at scale.
Core Features to Look For in an EMS
1. Centralized Database and CRM
A unified database helps you keep track of every applicant and their journey, from interactions and submitting forms to uploading documents and communication history. Look for systems that include robust CRM tools with inquiry tracking, source attribution, and segmentation capabilities.
Example: TargetX (Liaison): Provides a single dashboard with a 360° view of each student, consolidating everything from event registrations and communication touchpoints to financial aid info, all in the same place. This unified database supports data-driven decision making in recruitment and admissions.
Choose a system with customizable forms, document upload functionality, e-signature support, and user-friendly applicant portals. Features like drag-and-drop form builders and application status tracking can greatly improve the experience for both students and staff.
Example: Classe365 supports paperless admissions with custom online application forms. Students can easily apply from home, and submitted form data is automatically mapped into the school’s SIS to avoid manual re-entry. This makes the entire application-to-enrollment workflow smooth and efficient for both applicants and staff.
A strong student enrollment management system allows you to send personalized, automated messages via email, SMS, or in-app notifications. You should be able to build workflows, for example, a welcome message on inquiry, a reminder to complete an application, or an invitation to an open house. Some systems even offer AI chatbots for 24/7 engagement.
Example: Mautic by HEM features built-in email and text messaging automation, enabling schools to send personalized emails or SMS updates triggered by prospect behavior.
Source: HEM
4. Workflow Automation and Task Management
Look for features that reduce manual work, automatic task assignment, follow-up reminders, and to-do lists. These help your admissions team stay on top of deadlines and reduce errors.
Example:Blackbaud Enrollment Management allows schools to tailor their admissions process with configurable workflows and checklists in one centralized system. Staff have personalized task dashboards, and the system automatically triggers next steps, sending follow-up reminders, updating statuses, or notifying counselors based on defined rules. This saves time and keeps the team on schedule
Your EMS should integrate with your SIS, LMS, financial software, and marketing tools. Data should flow without duplication. Look for open APIs or pre-built integrations with platforms you already use.
Example: Slate supports bi-directional data exchange with campus systems. It can push and pull data to external SIS, LMS, financial aid systems, content management systems, and more via its Integration Center. This means application data or status updates in Slate can automatically appear in the SIS, and vice versa, ensuring consistency across all systems.
Analytics tools allow you to track conversion rates, demographic trends, and recruitment performance. Some EMS platforms even offer predictive analytics to identify at-risk applicants or forecast yield.
Example: TargetX goes beyond basic reporting by incorporating predictive analytics features. It includes a Prospect Scoring tool that lets schools apply tailored scoring models to their applicant pool. This means the system can automatically evaluate and rank prospective students based on likelihood to enroll (or other success indicators), helping admissions teams focus their efforts on the best-fit leads. Of course, standard reports and real-time dashboards are also available in TargetX for monitoring application trends and campaign performance at a glance.
No two schools are the same. Ensure your EMS allows you to customize application workflows, add custom fields, configure user roles, and scale as your institution grows.
Example:A cloud-based SaaS platform, Slate, is designed to “scale seamlessly” with an institution’s growth. All technical infrastructure is managed in modern, secure data centers, and Slate regularly updates with new features at no extra cost. This means an organization can start small and trust that Slate will accommodate more applicants, programs, or campuses over time without needing a major system overhaul. In short, EMS vendors focus on both customization (to meet unique local needs) and scalability (to support more users, records, and features as needed).
Adoption hinges on usability. During demos, pay attention to how intuitive the interface is for both staff and applicants. If the system is difficult to use, your team simply won’t use it to its full potential.
Example: User experience drives adoption. During evaluations, platforms like Classe365 and Class by Infospeed regularly earn praise for intuitive interfaces, which is important when your team has limited tech support.
Modern students (and parents) expect mobile-friendly platforms. Responsive design or dedicated mobile apps improve application completion rates and accessibility.
Example: Slate: Entirely web-based and built with responsive HTML5 design, so all end-user interfaces are mobile-ready by default. Admissions officers and applicants can access Slate “anytime, anywhere,” and the system is compatible across iOS, Android, and other modern smartphones without any special app required.
Data privacy is critical. Look for FERPA, GDPR, or other compliance features, role-based access controls, encryption, and regular security audits.
Example:Slate emphasizes that security is an “absolute commitment.” Slate encrypts all data in transit and at rest, and is fully compliant with regulations including PCI-DSS, NACHA, FERPA, GDPR, ADA Section 508, and more. Each client institution’s data is siloed in its own private database, and features like single sign-on integration and multi-factor authentication are supported, all to protect sensitive student information.
Source: Slate
How to Choose the Right System: The Smart Institution’s Guide
Too often, institutions jump into vendor demos before clearly understanding their own needs. But choosing an EMS isn’t like buying a software license. It’s like hiring a new department, one that will touch nearly every part of your student journey.
Too many schools choose an EMS the way they might buy a printer—look at features, pick the cheapest, hope for the best.
That’s a mistake.
Here’s how to do it right:
1. Audit Your Current Process
Bring your admissions, marketing, IT, and registrar teams together. Map the journey from first touch to enrolled student. Identify bottlenecks, duplicate data entry, communication gaps, and missed opportunities.
Ask:
Where are we losing leads?
What’s manual that should be automated?
What data are we not capturing?
Example: EMS tools like LeadSquared often shine here by centralizing fragmented workflows.
Example: If your institution works with international agents, Class by Infospeed is built for managing agent relationships and complex course offerings, a crucial feature for language schools and ESL programs.
Admissions staff. Recruiters. Advisors. These are the people who will live in the system every day. Their input is gold. Make them part of demos. Let them ask tough questions. Choosing a solution like SchoolMint, praised for its intuitive design, becomes easier when usability is prioritized.
4. Research Vendors Strategically
Not all systems serve all markets equally. Some are better for K-12. Others shine in graduate admissions. Some are strong in portfolio management; others in agent tracking.
Look for:
Reviews from schools like yours
Live or recorded demos
Transparent pricing models
Implementation timelines
Shortlist 3–5 vendors. Your shortlist should reflect your institution’s specific context. For graduate schools, Liaison CAS platforms are especially effective. For community colleges, TargetX offers a powerful combination of CRM and enrollment tools without requiring heavy configuration.
5. Evaluate Integration and Migration
Ask each vendor:
How do you integrate with our SIS, LMS, and payment gateways?
Can you support our CRM, or replace it?
How will you handle data migration?
Do you offer API access?
A disconnected EMS is a ticking time bomb. Ask vendors like Technolutions Slate or Salesforce Education Cloud about APIs and migration support—they’re known for smooth onboarding and flexibility.
6. Test the User Experience
Never buy blind. Ask for a sandbox account or personalized demo. Simulate key tasks: submitting an application, assigning leads, pulling a report. Include both staff and mock student journeys.
What feels intuitive? What’s clunky? What’s fast?
Your system is only as good as the people who use it.
7. Scrutinize Support and Training
Great technology without support is useless. Ask:
Who handles onboarding?
Is training included or extra?
What’s your support SLA?
Can we talk to a current client?
Look for a partner, not just a vendor. Look to vendors like Anthology, which are known for offering detailed implementation timelines, role-based training, and strong post-launch support.
8. Evaluate Total Cost and ROI
Look beyond license fees. Consider:
Implementation and training costs
User seat pricing
Support packages
Future upgrade fees
Opportunity cost of inefficiency
For example, Classe365 offers bundled modules that can be more cost-effective for institutions seeking an all-in-one platform.
Then flip the question:
How much time, enrollment yield, and data quality could we gain?
What to Avoid: Mistakes That Derail Enrollment Success
Let’s be clear: choosing the wrong EMS won’t just slow you down, it can undermine your enrollment goals for years.
Common mistakes include:
Prioritizing brand over fit. The best-known system is not always the best match for your institution’s size, staff capacity, or audience.
Skipping the discovery phase. Without understanding your real process needs, you risk choosing a tool that solves the wrong problems.
Overcomplicating the solution. Feature-rich platforms are great—if your team has the time and training to use them. Don’t choose complexity over usability.
Neglecting integration. A system that doesn’t talk to your CRM or SIS will create data silos and extra work.
Ignoring security and compliance. Your EMS will hold sensitive student data. Ensure it meets regulatory requirements like FERPA or GDPR, and ask vendors for proof of their data protection protocols.
Leaving end-users out of the process. If admissions and marketing staff don’t weigh in, you may end up with a system that leadership likes, but staff resents.
Rushing implementation. A fast deployment might sound appealing, but skipping onboarding, testing, and training will lead to low adoption and missed ROI.
A better approach? Take your time. Do the homework. Involve your people. And choose a system that solves your real problems, not just your imagined ones.
A Strategic Investment, Not Just a Tech Upgrade
The right Enrollment Management System is more than a technology purchase. It’s a strategic accelerator. When implemented well, it becomes the operating system for your admissions engine, fueling smarter campaigns, stronger applicant engagement, faster decision-making, and ultimately, better student outcomes.
Institutions that invest intentionally in their EMS see tangible results: higher yield rates, improved retention, deeper applicant insights, and more efficient operations. They don’t just fill classes, they shape them.
But none of this happens by chance. It requires a clear vision, a methodical evaluation, and a commitment to ongoing improvement.
Partnering for Enrollment Success
Choosing an EMS is just the beginning. Implementing it well, and aligning it with your enrollment strategy requires experience, insight, and a steady hand.
That’s where Higher Education Marketing (HEM) comes in. We’ve helped institutions across Canada and beyond design, implement, and optimize enrollment solutions that work. Whether you need a student-facing CRM portal, a smarter communication strategy, or guidance on vendor selection, our team can help.
Book a free consultation with HEM today, and let’s build an enrollment strategy that’s as forward-thinking as your institution. Because better tools don’t just make your job easier, they make your goals achievable.
Need help sorting through the multitudes of enrollment management systems for the right one for your school? Contact HEM today for more information.
Frequently Asked Questions
Question: What is an enrollment management system?
Answer: An Enrollment Management System is more than a tool for admissions; it’s a digital backbone for your recruitment, application, and onboarding processes
Question: What does an enrollment system do?
Answer: It streamlines student recruitment and admissions, enabling your team to launch campaigns, collect inquiries, and track applicant engagement without toggling between multiple platforms.
Question: What is the point of strategic enrollment management?
Answer: The point of strategic enrollment management (SEM) is to align an institution’s recruitment, admissions, retention, and graduation strategies with its long-term goals, using data and coordinated planning to optimize student success and institutional sustainability.
If you’re a university leader today, you’re juggling a lot: enrollment challenges, tightening budgets, shifting student expectations, and the rise of non-traditional competitors. Amid all this, one asset might not be getting the attention it deserves — your university’s brand.
No, not just your logo or tagline. We’re talking about brand equity — the value your institution holds in the minds of students, parents, alumni, faculty, employers, and the public. It’s about reputation, trust, recognition, and connection. And in a competitive market, it matters now more than ever.
What is brand equity in higher education?
Think of it this way: Brand equity is what people think and feel when they hear your university’s name. It’s the difference between being someone’s first-choice school versus just another option.
It shows up in the pride alumni feel when they wear your sweatshirt, the confidence prospective students have when they see your graduates succeed, and the trust employers place in your credentials. It’s shaped by every experience — from the way your website tells your story, to how your faculty engage in the classroom, to the tone of your communications during a crisis.
It’s what drives alumni to give, students to enroll, and faculty to choose you over other institutions. When a university has strong brand equity, people trust it, recognize it, and feel loyal to it. That kind of reputation can spark a ripple effect of positive influence across an entire institution.
Understanding the impact of brand equity across an institution
Brand equity touches every dimension of institutional life, influencing how people experience, perceive, and engage with your university across the student and stakeholder journey. Let’s take a look at its impact in six key areas.
1. Enrolling new students
Choosing a college is a huge decision for students and their families. Today’s students are more informed than ever and expect an institution that’s respected, innovative, and committed to their success.
That’s where your brand can make an impact. If your university has a strong, positive reputation, you’re more likely to make their shortlist. Schools with solid brand equity are seen as high-quality, forward-thinking, and worth the investment, which makes all the difference in a world where competition is fierce and the landscape is changing fast.
2. Attracting top faculty
It’s not just students who care about a school’s reputation — faculty and academic leaders do too. A strong, well-respected brand sends a clear message: This place is serious about excellence, values academic freedom, and encourages innovation.
It’s not just about prestige — top talent also wants to be somewhere that fosters genuine, supportive relationships with students. A respected brand signals a vibrant academic culture where everyone’s invested in each other’s success.
3. Fostering alumni pride
When a university has strong brand equity, it’s not just about reputation — it’s about the sense of pride and connection it creates. Alumni who feel proud of their alma mater are more likely to stay involved, whether that means attending events, volunteering, or giving back financially.
A strong brand also helps foster a lasting sense of community and belonging well beyond graduation. In short, when your brand is trusted and respected, alumni remain engaged — and they’re more likely to support the institution not only with their resources but by recommending it to future students within their networks.
4. Securing strategic partnerships
Whether you’re aiming to partner with major companies, secure government grants, or build global collaborations, having a strong brand can be a significant factor. Organizations want to work with universities they respect, trust, and recognize as leaders in their field.
When your university’s brand is strong and clear, opportunities that are imperative to your institution open up more quickly. Meanwhile, lesser-known schools often struggle to get noticed. Building a strategic and strong brand is your best way to stand out and secure meaningful partnerships that benefit your students and your bottom line.
5. Staying resilient amid market disruption
Higher education is under pressure from various directions shifting demographics, financial constraints, and evolving expectations. A strong brand is essential to stay resilient and relevant.
When controversy, crises, or big changes hit, your brand becomes your safety net. People are far more likely to give you the benefit of the doubt if they already respect and trust you. That reputation can be the difference between weathering the storm and facing long-term damage.
6. Boosting visibility through rankings
While rankings aren’t everything, they do influence perception. Many ranking systems factor in peer reputation, which is directly tied to your brand. The same goes for media coverage. The stronger your brand, the more likely you are to be recognized as a thought leader and trusted voice in the field.
Ready for a Smarter Way Forward?
Higher ed is hard — but you don’t have to figure it out alone. We can help you transform challenges into opportunities.
Practical tips for building brand equity that lasts
University leaders can’t afford to view brand as merely a marketing function— it’s so much more than that. Brand must be seen as a strategic asset embedded in everything from big-picture planning to day-to-day decisions. It’s part of how you attract students, build partnerships, and earn trust.
So how can you turn brand equity into a competitive advantage for your institution? Here are a few key moves to get started:
1. Know what you stand for
Start with a clear sense of who you are and what makes your school unique. What do you want people to feel when they think of your institution? Your brand promise should reflect your values, vision, and personality — and it should feel real, not like something cooked up in a boardroom.
2. Take time to truly know your audience
What matters most to your students, parents, alumni, and faculty? What are they proud of, and what do they wish were better? Take time to listen — through surveys, conversations, and social media — and use those insights to shape your strategy and message.
3. Tell one clear, consistent story
Your brand shows up everywhere: your website, your campus tours, your social media posts, even how your staff answers the phone. Make sure that story feels authentic, easy to understand, and consistent across every touchpoint. Developing comprehensive brand guidelines, share them widely across the institution, and conduct regular audits to ensure every touchpoint reinforces a unified, memorable experience for all audiences.
4. Get your people involved
Your brand isn’t just a logo — it’s how people talk about your institution and the trust they place in it. That means faculty, staff, students, and alumni all have a role to play. Keep them in the loop, give them the tools to share your story, and make them feel like part of the bigger picture. Want to get more people talking about — and proud of — your school? Make it easy for them. Share what’s happening through newsletters and social media and provide your community with tools that help them show off their connection. When faculty, staff, students, and alumni feel informed, celebrated, and included, they’re more likely to stay engaged — and more likely to brag about being part of your institution.
5. Make sure the experience matches the message
If you’re promising innovation, inclusivity, or career readiness, you better be delivering that on campus, in the classroom (both online and in person), and beyond. Brand equity grows when expectations match real experiences. That’s why creating a seamless website experience is so important — it directly impacts how much trust students place in your institution and it’s offerings.
6. Get the word out (strategically)
Raising awareness isn’t just about marketing louder — it’s about marketing smarter. Use the right mix of channels, from digital ads and social media to speaking opportunities for university leaders. And don’t forget about earned media and storytelling that highlights real student success. Do this by building a strategic content plan that aligns messaging across platforms, targets the right audiences, and consistently showcases the impact your institution makes.
7. Keep a pulse on your reputation
What are people actually saying about your school? Check in regularly using surveys, online reviews, social listening, and even informal feedback. This will help you spot issues early and see what’s working.
8. Be prepared to evolve
Higher ed is changing fast, so your brand needs to be flexible. Stay grounded in your core values, but be open to shifting your tone, visuals, or messaging as your audience and the world around you change.
Build a brand with a lasting legacy and immediate impact
In an age of increasing competition and shifting student expectations, brand equity is no longer a luxury — it’s a leadership priority. With students having endless options, donors getting more selective, and reputations spreading instantly, your brand equity can be a serious competitive edge.
Investing in a strong, authentic, and trusted brand can lay the foundation for long-term success. The institutions that thrive in the years ahead will be those that treat their brand as a central part of their overall strategy instead of a marketing afterthought.
Because in higher ed, your brand isn’t what you say it is — it’s what people believe it to be. And that belief? That’s your brand equity.
Ready to strengthen your institution’s brand equity? Explore how a strategic marketing approach can help you stand out and thrive. Let’s talk!
Innovation Starts Here
Higher ed is evolving — don’t get left behind. Explore how Collegis can help your institution thrive.
The Education Department said Thursday that federal money shouldn’t fund dual enrollment, adult education and certain career and technical education for “illegal alien” students, whether they’re adults or K–12 pupils who are accessing postsecondary education.
Department officials said in a news release that they are rescinding parts of a 1997 Dear Colleague letter that had allowed undocumented students to access those programs.
In the interpretative rule published on the Federal Register, the department declared that “non-qualified alien adults are not permitted to receive education benefits (postsecondary education benefits or otherwise) and non-qualified alien children are not eligible to receive postsecondary education benefits and certain other education benefits, so long as such benefits are not basic public education benefits. Postsecondary education benefits include dual enrollment and other similar early college programs.”
Education Secretary Linda McMahon said in the release that “under President Trump’s leadership, hardworking American taxpayers will no longer foot the bill for illegal aliens to participate in our career, technical, or adult education programs or activities. The department will ensure that taxpayer funds are reserved for citizens and individuals who have entered our country through legal means who meet federal eligibility criteria.”
Augustus Mays, vice president of partnerships and engagement at EdTrust, an education equity group, said in a statement that the change “derails individual aspirations and undercuts workforce development at a time when our nation is facing labor shortages in critical fields like healthcare, education, and skilled trades. This decision raises barriers even higher for undocumented students who are already barred from accessing federal financial aid like Pell Grants and student loans.
“Across the country, we’re seeing migrant communities targeted with sweeping raids, amplified surveillance, and fear-based rhetoric designed to divide and dehumanize,” Mays said. “Policies like this don’t exist in a vacuum. They are rooted in a political agenda that scapegoats immigrants and uses fear to strip rights and resources from the most vulnerable among us.”
Today’s prospective students aren’t waiting for a glossy brochure to arrive in the mail. They’re researching schools on their phones between classes, watching campus tours on YouTube, and chatting with peers online to compare experiences. They’re digital-first and impatient, and expect the same seamless experience from a college as they would from Netflix or Amazon.
To stand out in this noisy, fast-moving environment, your enrollment marketing needs to work smarter. That means shifting away from static promotions and embracing data-driven, student-centric strategies that guide each prospect from curiosity to commitment.
Here’s how you can make that happen: 10 tactics that schools across North America (and beyond) are using to win the attention, trust, and enrollment of today’s students.
Struggling with enrollment?
Our expert digital marketing services can help you attract and enroll more students!
1. Understand Your Audience (Better Than They Expect)
The best enrollment marketing strategies begin with deep audience insight. Not the surface-level kind (like age ranges or postal codes), but real, behavior-based understanding.
Instead of just collecting names at events or counting clicks on a landing page, take the time to analyze what your audience is doing. Are they spending five minutes reading your nursing program page but bouncing quickly from your homepage? Is there a spike in traffic after you post student testimonials on Instagram? These are the clues that shape smart decisions.
Tools like Google Analytics, HubSpot, or Slate reveal exactly where prospects engage and where they drop off. Segmenting audiences based on their actions, rather than assumptions, lets you personalize outreach that feels meaningful. If a student explores your hospitality program at 11:00 p.m. from another time zone, your strategy should reflect that interest and context.
Personalization builds a connection. And connection drives conversion.
Example: Oregon State University implemented a modern CRM (Slate) to segment and personalize outreach. OSU filters prospective students by interests, major, and location to trigger automated, tailored communications (email, text, print) for each segment. With this approach, Oregon State University ensures that prospects receive information relevant to them. For example, engineering-minded students get content on OSU’s tech programs, improving engagement and application conversion.
2. Turn Your Website Into a Top-Performing Recruiter
Think of your website as your lead admissions counselor. It works 24/7 and never forgets a prospect’s name, if it’s built right.
A compelling site doesn’t just list programs. It creates an experience. Navigation should be intuitive, especially on mobile, where the majority of users browse. Application deadlines should never be more than one click away. Program benefits should be clear, outcomes measurable, and support services obvious.
Equally important is online visibility. Students won’t land on your site if it isn’t optimized for search. That means including the phrases they’re typing into Google: “Best business diploma in Vancouver” or “Top graphic design college Canada.” A steady stream of blog content around these themes builds your authority and search rankings over time.
Don’t underestimate local search either. Schools that claim their Google Business listing and keep it updated with reviews, photos, and FAQs tend to show up higher in local results, right when families are deciding which campuses to visit.
Example: ENSR partnered with HEM to revamp its website for better usability and search visibility. Targeted SEO optimizations (including multilingual content and Google Ads campaigns) were implemented to attract more qualified traffic. ENSR also improved site speed and navigation. As a result, the school saw a 10% year-over-year increase in admissions, clear evidence that an optimized, easy-to-find website translates into more student enrollments.
How can schools use SEO to reach more prospective students? Schools can use SEO by optimizing their website and content with keywords students search for, like program names or “colleges near me.” Creating informative blog posts, improving site speed, and using clear navigation help boost search rankings, making it easier for prospects to find and explore the school online.
3. Meet Students Where They Scroll
Social media is no longer just a promotional tool; it’s where brand trust is built. And guess what? Students don’t want picture-perfect posts. They want a glimpse into real student life: the awkward, the inspiring, and everything in between.
How do social media platforms help attract prospective students? Social media platforms help attract prospective students by showcasing authentic campus life, student stories, and academic highlights where students already spend time. Targeted ads and engaging content build awareness, answer questions, and create emotional connections that encourage students to explore programs and take the next step toward applying.
The most effective schools blend behind-the-scenes campus life, student takeovers, and authentic voices with strategic, paid campaigns. Engagement is key. Answer comments, reply to DMs, and ask questions. Your presence shouldn’t just be felt; it should be responsive.
And when a student visits your site but doesn’t apply? A retargeting ad reminding them about a scholarship deadline can bring them back with a purpose.
Example: Randolph-Macon Academy utilizes student-driven social media takeovers and campaigns to humanize its brand. For example, on “Takeover Tuesdays,” R-MA students run the school’s Instagram Stories, giving followers a genuine day-in-the-life look at campus life. These peer perspectives resonate with prospective students and parents. R-MA also shares posts on LinkedIn celebrating achievements (like its seniors earning $16 million+ in scholarships) to boost credibility. By strategically targeting content on platforms like Instagram, Facebook, and LinkedIn, R-MA expands its reach and builds trust with specific audiences.
Campus visits are powerful but not always possible. Virtual tours bridge that gap beautifully when done right.
Why are virtual tours important for school admissions marketing? Virtual tours are important because they let prospective students explore campus facilities, culture, and student life from anywhere. They provide a first-hand experience that builds familiarity and trust, especially for international or remote students who can’t visit in person, helping them feel more confident about applying.
The most compelling virtual experiences go beyond slideshows or still images. They immerse visitors in 360° visuals of your labs, residences, lounges, and dining halls. Add narration, clickable maps, and interactive hotspots to create a sense of discovery.
Want to make it even more engaging? Offer live tours hosted by current students. Answer questions in real-time. Make the conversation two-way. This kind of hybrid interaction not only informs, but it also builds comfort and connection.
Gamifying the experience with small touches like hidden easter eggs or quizzes can boost session time, making students stay longer and remember more.
Example: Eastern New Mexico University: In January 2025, ENMU launched an upgraded 360-degree interactive virtual tour of its campus, in partnership with a virtual tour platform. The tour lets prospective students anywhere in the world explore campus landmarks at their own pace with panoramic views and clickable info points. New interactive stops even feature current students sharing their experiences via video, and users can access photos and descriptions of traditions at each location. This immersive virtual experience makes viewers feel “like they are on campus,” even if they cannot visit in person.
Nothing conveys emotion, trust, and energy quite like video. That’s why it’s the top-performing format across all platforms.
Students use video to explore, compare, and decide. A 30-second clip showing campus energy can hook them, while a three-minute video of a student explaining why they chose your school can tip the scales.
The best videos aren’t always the most polished. Often, it’s the realness that lands, the quiet moment in a dorm room, a laugh during class, a genuine answer about overcoming a challenge. When current students tell their story on camera, it resonates far more than scripted promos ever could.
And don’t stop with publishing. Upload to YouTube (the second largest search engine in the world), share snippets on social media, and embed videos in your emails or on your site. It keeps your message moving, even when you’re not.
Example: The Academy of Applied Pharmaceutical Sciences regularly produces short videos featuring student success stories and hands-on training highlights. These testimonials and “day in the life” videos are shared on AAPS’s website and social channels, providing an authentic glimpse into student outcomes. AAPS also posts video content of alumni in their new careers or students in lab classes, which personalizes the school’s message.
6. Be There Instantly with Smart Chatbots
Picture this: a student is exploring your program page at 10:45 p.m. They want to know if scholarships are still open, but your office is closed.
This is where chatbots shine. When used effectively, they answer FAQs, guide students to relevant pages, and even collect lead info for follow-up, all in real time.
Today’s best bots go beyond text. They can speak multiple languages, schedule tours, and connect students with human counselors. They’re not a replacement for your staff. They’re the frontline, making sure no interest goes cold.
Example: The University of Illinois Gies College of Business deployed an AI chatbot named “Alma” on its online MBA program website to handle common questions and nurture leads. The chatbot was built with a no-code AI platform and programmed to answer prospective students’ free-text questions about the program, provide key information (e.g., deadlines, curriculum), and even collect contact info for follow-up.
Your school can say it’s great. But it means more when others say it for you.
Prospective students read reviews before making decisions. That’s true whether they’re buying shoes or choosing a college. A few well-placed, authentic reviews from happy students or parents can tip the scale in your favor.
Example: Rosseau Lake College actively highlights student and parent testimonials on its official site to manage its online reputation. RLC’s admissions section features a dedicated “Student Testimonials” page with quotes, stories, and even videos from current students and recent graduates.
Make it easy for your community to share their voice. Follow up after tours or events with a simple request for feedback. Prompt graduating students to reflect on their journey. And most importantly, respond graciously to both praise and criticism.
Highlight these testimonials in your marketing materials, emails, and website. Some schools even have dedicated pages that feature alumni quotes, rankings, and outcomes all in one place.
Example: Discovery Community College leverages Google reviews and social media to boost its reputation. When the college receives a glowing review online, the marketing team amplifies it; for instance, Discovery CC shared a student’s 5-star Google review on Instagram with a thank-you message.
When you let your results speak for themselves, people listen.
8. Nurture With Purpose: Email and Text Messaging
Email isn’t outdated. It’s just misused.
Too often, schools blast the same generic message to every lead. But with marketing automation tools like HubSpot or Slate, you can do better. Much better.
Send personalized messages based on actual behavior. If someone downloaded a course calendar, send a follow-up series about faculty highlights, career paths, or student testimonials from that program. If a student clicked a scholarship link but didn’t apply, follow up with a helpful guide or checklist.
Text messages are the perfect complement: fast, direct, and effective. Use them for urgent nudges like deadline reminders or event RSVPs. But be respectful. Less is more when it comes to texting.
9. Host Webinars That Educate and Inspire
Done right, webinars are student recruitment gold. They let students interact with faculty, hear from alumni, and ask real questions, all from the comfort of home.
Think beyond the program overview. What are students anxious about? Admissions essays? Career prospects? Financial aid? Offer sessions that solve these problems, not just sell solutions.
Example: The University of North Texas runs themed Admissions Webinars for targeted audiences of students who haven’t yet applied. UNT invites high schoolers to sign up for sessions like “Why UNT? & How to Apply,” where recruiters walk through programs, campus life, and the application process via Zoom.
Live Q&As make these events feel dynamic. A student asking a question and getting an answer in the moment, that’s engagement. That’s trust.
Example: Randolph-Macon Academy hosts regular live webinars for prospective families as part of its recruitment strategy. During these virtual info sessions, R-MA’s admissions counselors present an overview of the school, share up-to-date facts, and then open the floor for Q&A. They often incorporate a live virtual campus tour within the webinar. This format has been effective in converting attendees to applicants – families get to interact directly with staff and students from home, addressing any doubts in real time.
And once the event ends, the content lives on. Recordings become lead magnets. Clips fuel your social strategy. Recaps can power blog posts. Every webinar is a long-term asset when you plan it right.
10. Showcase What Comes After: Alumni Success
Prospective students are investing time and money. What they want to know is simple: “Will it pay off?”
Highlighting alumni outcomes is one of the most persuasive things you can do. Share job placement rates, grad school acceptances, average salaries, whatever metrics tell the story of success.
Even more powerful are personal stories. The alum who launched a startup. The student who landed a dream internship. The graduate who returned to school to mentor others. These aren’t just achievements, they’re proof points.
Example: Randolph-Macon Academy publicizes its alumni and student success outcomes as a core part of marketing. R-MA’s communications showcase statistics like 100% college acceptance and millions in scholarships earned by each graduating class. In 2025, R-MA proudly shared that its 69 seniors collectively secured over $10.5 million in scholarships for college. Alumni success stories (military academy appointments, leadership roles, etc.) are featured on the school blog and newsletters.
Some schools use interactive alumni maps to show where grads are working across the globe. Others run weekly spotlight stories on social or newsletters. However you do it, make sure it’s easy for prospects to imagine their own future in the successes of those who came before.
When you say, “Here’s where our grads go, and here’s how we help them get there,” the value of your school becomes real.
Enrollment Marketing Is Not About Tactics. It’s About Trust.
Each of these enrollment strategies works on its own. But when you combine them into a cohesive enrollment plan, powered by data and driven by empathy, you don’t just generate interest. You build relationships.
From a student’s first Google search to their final enrollment decision, every interaction matters. So make them count. Use tools like CRMs to track engagement. Align marketing with admissions. And most importantly, keep the student experience at the center of it all.
Because in today’s world, enrollment isn’t about volume. It’s about value. Give your prospects content that answers questions, support that feels personal, and stories that inspire. Do that, and the results will follow.
Need help building your enrollment marketing plan?
HEM offers expert services tailored to higher education institutions across Canada and beyond.Contact us today to learn more.
Struggling with enrollment?
Our expert digital marketing services can help you attract and enroll more students!
Frequently Asked Questions
Question: How do social media platforms help attract prospective students?
Answer: Social media platforms help attract prospective students by showcasing authentic campus life, student stories, and academic highlights where students already spend time. Targeted ads and engaging content build awareness, answer questions, and create emotional connections that encourage students to explore programs and take the next step toward applying.
Question: Why are virtual tours important for school admissions marketing?
Answer: Virtual tours are important because they let prospective students explore campus facilities, culture, and student life from anywhere. They provide a first-hand experience that builds familiarity and trust, especially for international or remote students who can’t visit in person, helping them feel more confident about applying.
Question: How can schools use SEO to reach more prospective students?
Answer: Schools can use SEO by optimizing their website and content with keywords students search for, like program names or “colleges near me.” Creating informative blog posts, improving site speed, and using clear navigation help boost search rankings, making it easier for prospects to find and explore the school online.
This audio is auto-generated. Please let us know if you have feedback.
Dive Brief:
Harvard University argued Thursday that the Trump administration may attempt to use “creative relabeling” to circumnavigate a court order blocking its attempt to end the institution’s ability to enroll international students.
U.S. District Judge Allison Burroughs has twice blocked attempts by the federal government to halt all international students from attending Harvard through temporary orders. Now, Harvard and the Trump administration are clashing over what a more permanent preliminary injunction should look like.
In legal filings, the Ivy League institution called on the court to approve its own proposal, which would place more restrictions on the Trump administration and require it to provide a status report detailing its compliance with the pending preliminary injunction.“Given the government’s pattern of behavior thus far and the chaos it has inflicted, this surety is more than warranted,” it said.
Dive Insight:
In late May, the U.S. Department of Homeland Security revoked Harvard’s ability to enroll international students by terminating its Student and Exchange Visitor Program certification.The agency alleged that the university had permitted a “toxic campus climate” to flourish by accommodating “anti-American, pro-terrorist agitators.”
The loss of SEVP certification — required to host international students — would have devastating impacts on both Harvard and its international students.
In the 2024-25 academic year, nearly 6,800 foreign students attended Harvard,according to institutional data. They made up 27.2% of the university’s total student body.
The day after the SEVP revocation, Harvard sued the federal government, arguing that the Trump administration acted abruptly and without “rational explanation.”
Burroughs granted Harvard’s request for a temporary restraining order to block DHS’ decision later that day, ruling the university would undergo “immediate and irreparable injury” if the ban was enforced before she could hear from both parties.
After the judge issued the order, the federal government formally notified Harvard of its intent to revoke the university’s SEVP certification on May 28, according to court documents.
The notification alleged in part that Harvard failed to sufficiently fulfill a federal information request about its international studentsand gave the university 30 days to rebut the allegations.
The next day, Burroughs ruled that she would issue a preliminary injunction in the case and directed Harvard and the Trump administration to negotiate the terms of the order.
The Trump administration then tried another tactic. President Donald Trump signed a proclamation in early June ordering top federal officials to stop all international students heading to Harvard from entering the country.
The university updated its lawsuit and asked Burroughs also to block the proclamation, arguing it is tantamount to a “government vendetta against Harvard.” Burroughs issued a temporary restraining order on June 5 against Trump’s proclamation and extended the block on the SEVP revocation.
Now, Harvard and the Trump administration are fighting out the specifics of that injunction in court.
In legal filings Thursday, Harvard said its proposed preliminary injunction is “tailored to preserve the status quo” while its lawsuit proceeds.
But the Trump administration is pushing back on multiple aspects. One disputed passage would prohibit the federal government from restricting Harvard’s ability to sponsor student visas outside of the attempted SEVP revocation, the university said.
If DHS again tries to revoke Harvard’s DHS certification, another part of the proposed order would delay the decision by 30 days. The timeframe would give Harvard time to seek another injunction, it argued.
“Requiring Harvard to rush to the courthouse for a third time, and requiring the Court to take up these issues on an emergency basis yet again to prevent predictable harms — the inevitable result of the government’s approach — is inefficient, ineffective, and unnecessary,” it said.
The federal government also pushed back on a proposal that would require it to promptly demonstrate how it intends to comply with the court order once approved.
In today’s competitive digital landscape, higher education institutions must continually evolve to reach and engage prospective students. YouTube has evolved from a video-sharing platform into a dynamic search engine where students explore campus life, academic programs, and authentic student experiences. That’s why developing and optimizing a higher education YouTube channel is more important than ever.
Smart video SEO strategies can significantly improve visibility, build brand authority, and support enrollment goals for institutions. A well-crafted YouTube strategy plays a crucial role in this effort, ensuring that content reaches and resonates with prospective students.
Why YouTube SEO matters for higher ed video marketing
YouTube SEO goes beyond views. It positions your institution within one of the most influential search engines in the world. YouTube has become the second-largest search engine after Google, and for today’s prospective students — many of whom are digital natives — video is a primary method of discovery and research.
Whether exploring campus life, comparing academic programs, or seeking authentic student voices, prospective learners turn to YouTube to gather insights that influence their decisions. A well-optimized higher education YouTube channel offers a range of benefits, including:
Builds credibility and trust by providing authentic, engaging content.
Expands visibility on a platform used heavily by prospective students.
Drives enrollment by surfacing at key moments in the decision-making journey.
Strengthens your digital footprint through content that aligns with search behavior.
Supports multi-channel strategies by integrating with websites, email, and social media.
Improves AI-driven search visibility as AI-powered search results increasingly prioritize video content. (Tools like YouTube’s auto-transcription and AI tagging can further enhance discoverability.)
Optimizing your channel ensures your content appears when it matters most and positions your institution as a leader in digital engagement.
“Video content is the future of marketing—it’s authentic, engaging, and capable of building trust with your audience faster than any other medium.”
— Neil Patel, digital marketing expert
Build a strong SEO foundation for your higher education YouTube channel
Every video your institution shares is more than just content — it’s an opportunity to shape perceptions, highlight your strengths, and connect with your audience. Before diving into more advanced strategies, it’s essential to ensure that each video is built on a solid SEO foundation.
When executed consistently, these foundational elements can make the difference between content that gets buried and content that drives meaningful engagement. Foundational elements include:
Accurate video transcripts: Ensure transcripts are complete and error-free. This enhances accessibility and helps search engines understand your content. Also, include captions and alt text to enhance accessibility and meet ADA standards.
Optimized video settings: Configure each video correctly (e.g., mark as “not for children”, assign relevant categories, add strategic tags) to improve discoverability.
Robust video descriptions: Use keyword-rich, detailed descriptions aligned with your academic offerings. Think like a prospective student searching for programs or campus life.
SEO-friendly video titles: Titles should be compelling, clear, and keyword-focused. Avoid jargon — focus on what the viewer will gain.
Apply advanced channel strategies to stand out
Once the foundational elements are in place, it’s time to move beyond the basics. Elevating your higher education YouTube channel requires thoughtful planning and strategic segmentation. This is especially important for institutions with diverse academic offerings and multiple audiences, such as prospective undergraduate and graduate students.
Taking a more advanced approach can help differentiate your content, make navigation easier for users, and deliver tailored experiences that align with varied student needs. To elevate your channel’s performance and support segmented marketing goals:
Create dedicated channels: Maintaining separate channels for different audiences (like graduate versus undergrad) allows for more targeted messaging and cleaner audience segmentation.
Use playlists strategically: Group videos by topic or series and apply consistent naming conventions. This improves navigation, boosts engagement, and supports channel SEO.
Optimize thumbnails and preview content: High-quality thumbnails and concise preview text boost click-through rates, especially on mobile devices.
Ready for a Smarter Way Forward?
Higher ed is hard — but you don’t have to figure it out alone. We can help you transform challenges into opportunities.
Enhance viewer engagement
Even if your department isn’t directly producing every video, there’s still an opportunity to influence engagement and performance. By implementing a few proven tactics, institutions can increase viewer interaction and strengthen their presence on YouTube.
These strategies work in tandem with foundational SEO practices to extend the reach and impact of your video content:
Include clear calls-to-action (CTAs): Ask viewers to like, comment, subscribe, or visit your website. These actions signal relevance to YouTube’s algorithm.
Leverage end screens and cards: Use these to direct viewers to related content, encouraging longer sessions and deeper engagement.
Maintain consistent branding: Ensure videos reflect your institution’s visual identity and messaging tone to reinforce brand equity.
Integrate video into your broader strategy
YouTube content shouldn’t exist in a silo. When part of a cohesive higher ed video marketing approach, your higher education YouTube channel becomes a versatile asset that supports communication and engagement across platforms.
To truly maximize its value, it must be woven into your institution’s broader marketing and communication ecosystem. When aligned with your website, email campaigns, and social media channels, your YouTube strategy reinforces key messages and creates a cohesive experience for prospective students.
YouTube videos can be a powerful asset across multiple marketing channels:
Website integration: Embed program overviews, testimonials, and campus tours to enrich landing pages and drive engagement.
Email campaigns: Incorporate personalized video content into outreach and drip campaigns to boost open and click-through rates.
Social media amplification: Repurpose YouTube content into short clips for Instagram, TikTok, Facebook, and LinkedIn to reach broader audiences.
Virtual events and webinars: Leverage recorded content as follow-up resources or promotional teasers.
Advertising and paid media: Use high-performing videos in YouTube ads or across PPC campaigns to increase reach and ROI.
Stay agile and stay ahead
YouTube SEO isn’t a one-time effort — it’s a continuous process. Use YouTube Studio to track key performance metrics such as watch time, engagement, and search impressions. These insights help guide your strategy and identify opportunities to improve content.
Monitor analytics regularly, refresh metadata, and adapt to changing viewer behaviors. Institutions that stay agile will be better positioned to engage digital-native audiences.
Take your higher ed video marketing to the next level
YouTube remains a powerful tool to build institutional visibility and connect with prospective students. At Collegis Education, our expansive marketing services are backed by deep expertise in higher ed SEO, digital strategy, and content performance. Whether you’re refining your current efforts or starting fresh, a smart, scalable strategy can turn your YouTube channel into a powerful tool for student engagement.
Let’s connect and start building a smarter strategy today.
Innovation Starts Here
Higher ed is evolving — don’t get left behind. Explore how Collegis can help your institution thrive.
How might international student enrollment changes impact colleges and universities? This Thursday, on June 5th, from 2-3 pm ET, the Future Trends Forum is holding an interactive exercise to work through an evidence-based scenario wherein fall 2025 numbers crash. Everyone will participate by representing themselves in the roles they currently have or would like to take up, and in those positions explore the scenario.
We will develop responses to the situation in real time, which may help us think ahead for whatever form the crisis eventually takes. In this exercise, everyone gets to collaboratively explore how they might respond.
As with our first election simulation, not to mention our solarpunk, generative AI, black swan, and digital twin workshops, this one will involve participants as cocreators and investigators, exploring and determining what might come next. Consider it a trial run for a potential future.
To RSVP ahead of time, or to jump straight in at 2 pm ET this Thursday, click here:
To find more information about the Future Trends Forum, including notes and recordings of all previous sessions, click here: http://forum.futureofeducation.us/.


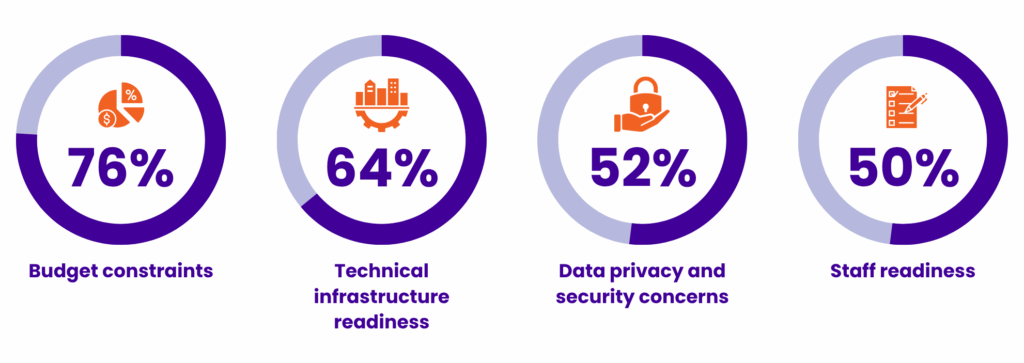
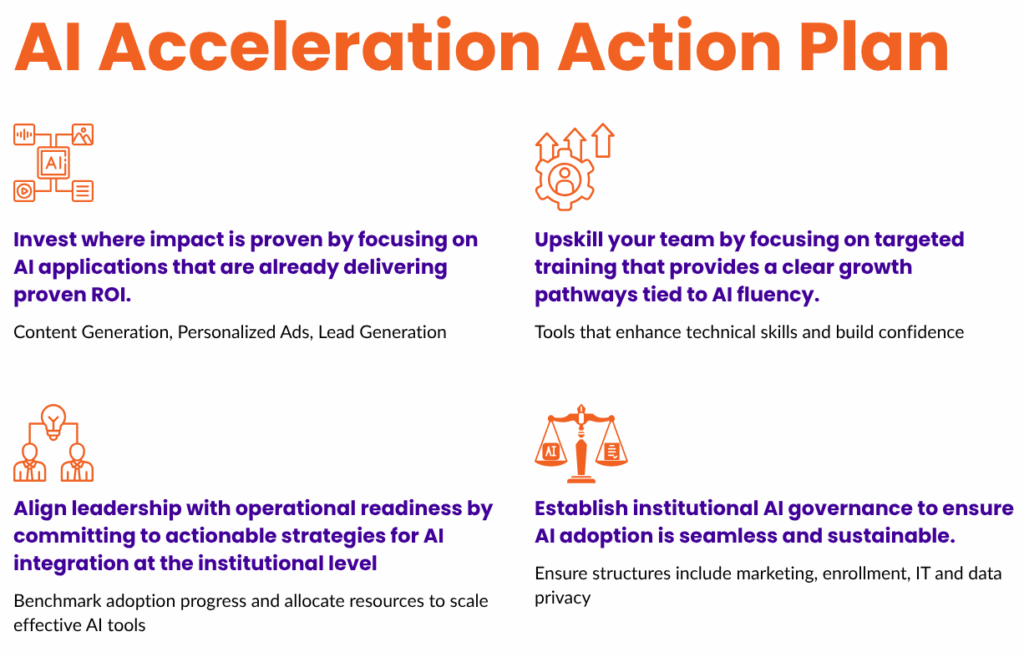


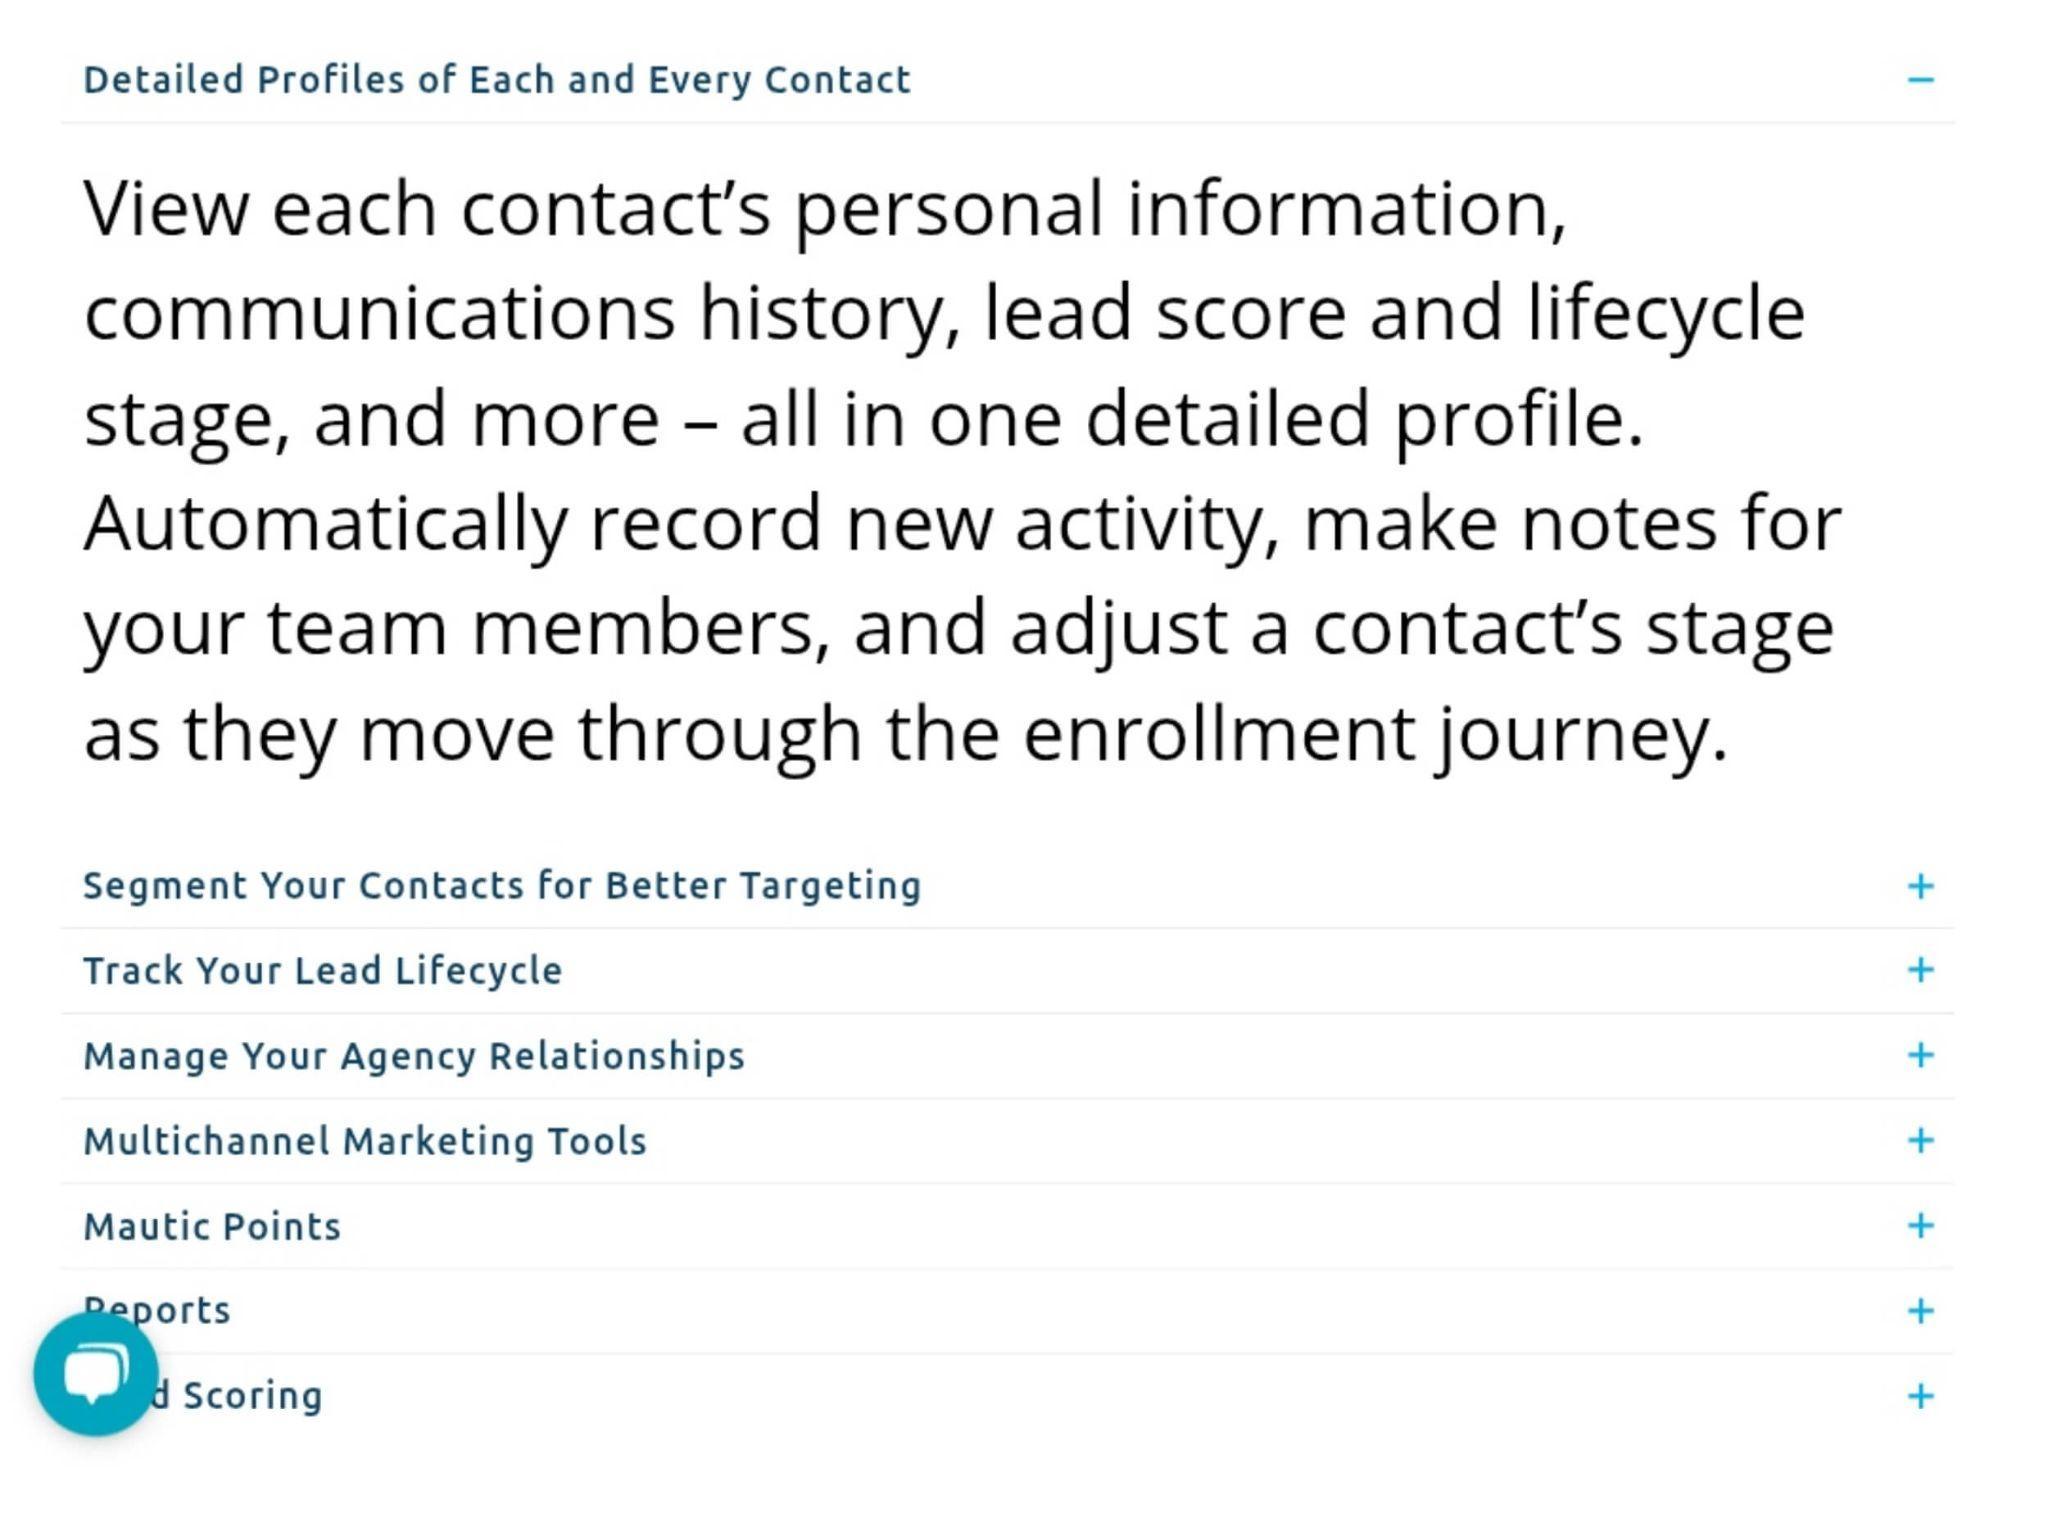


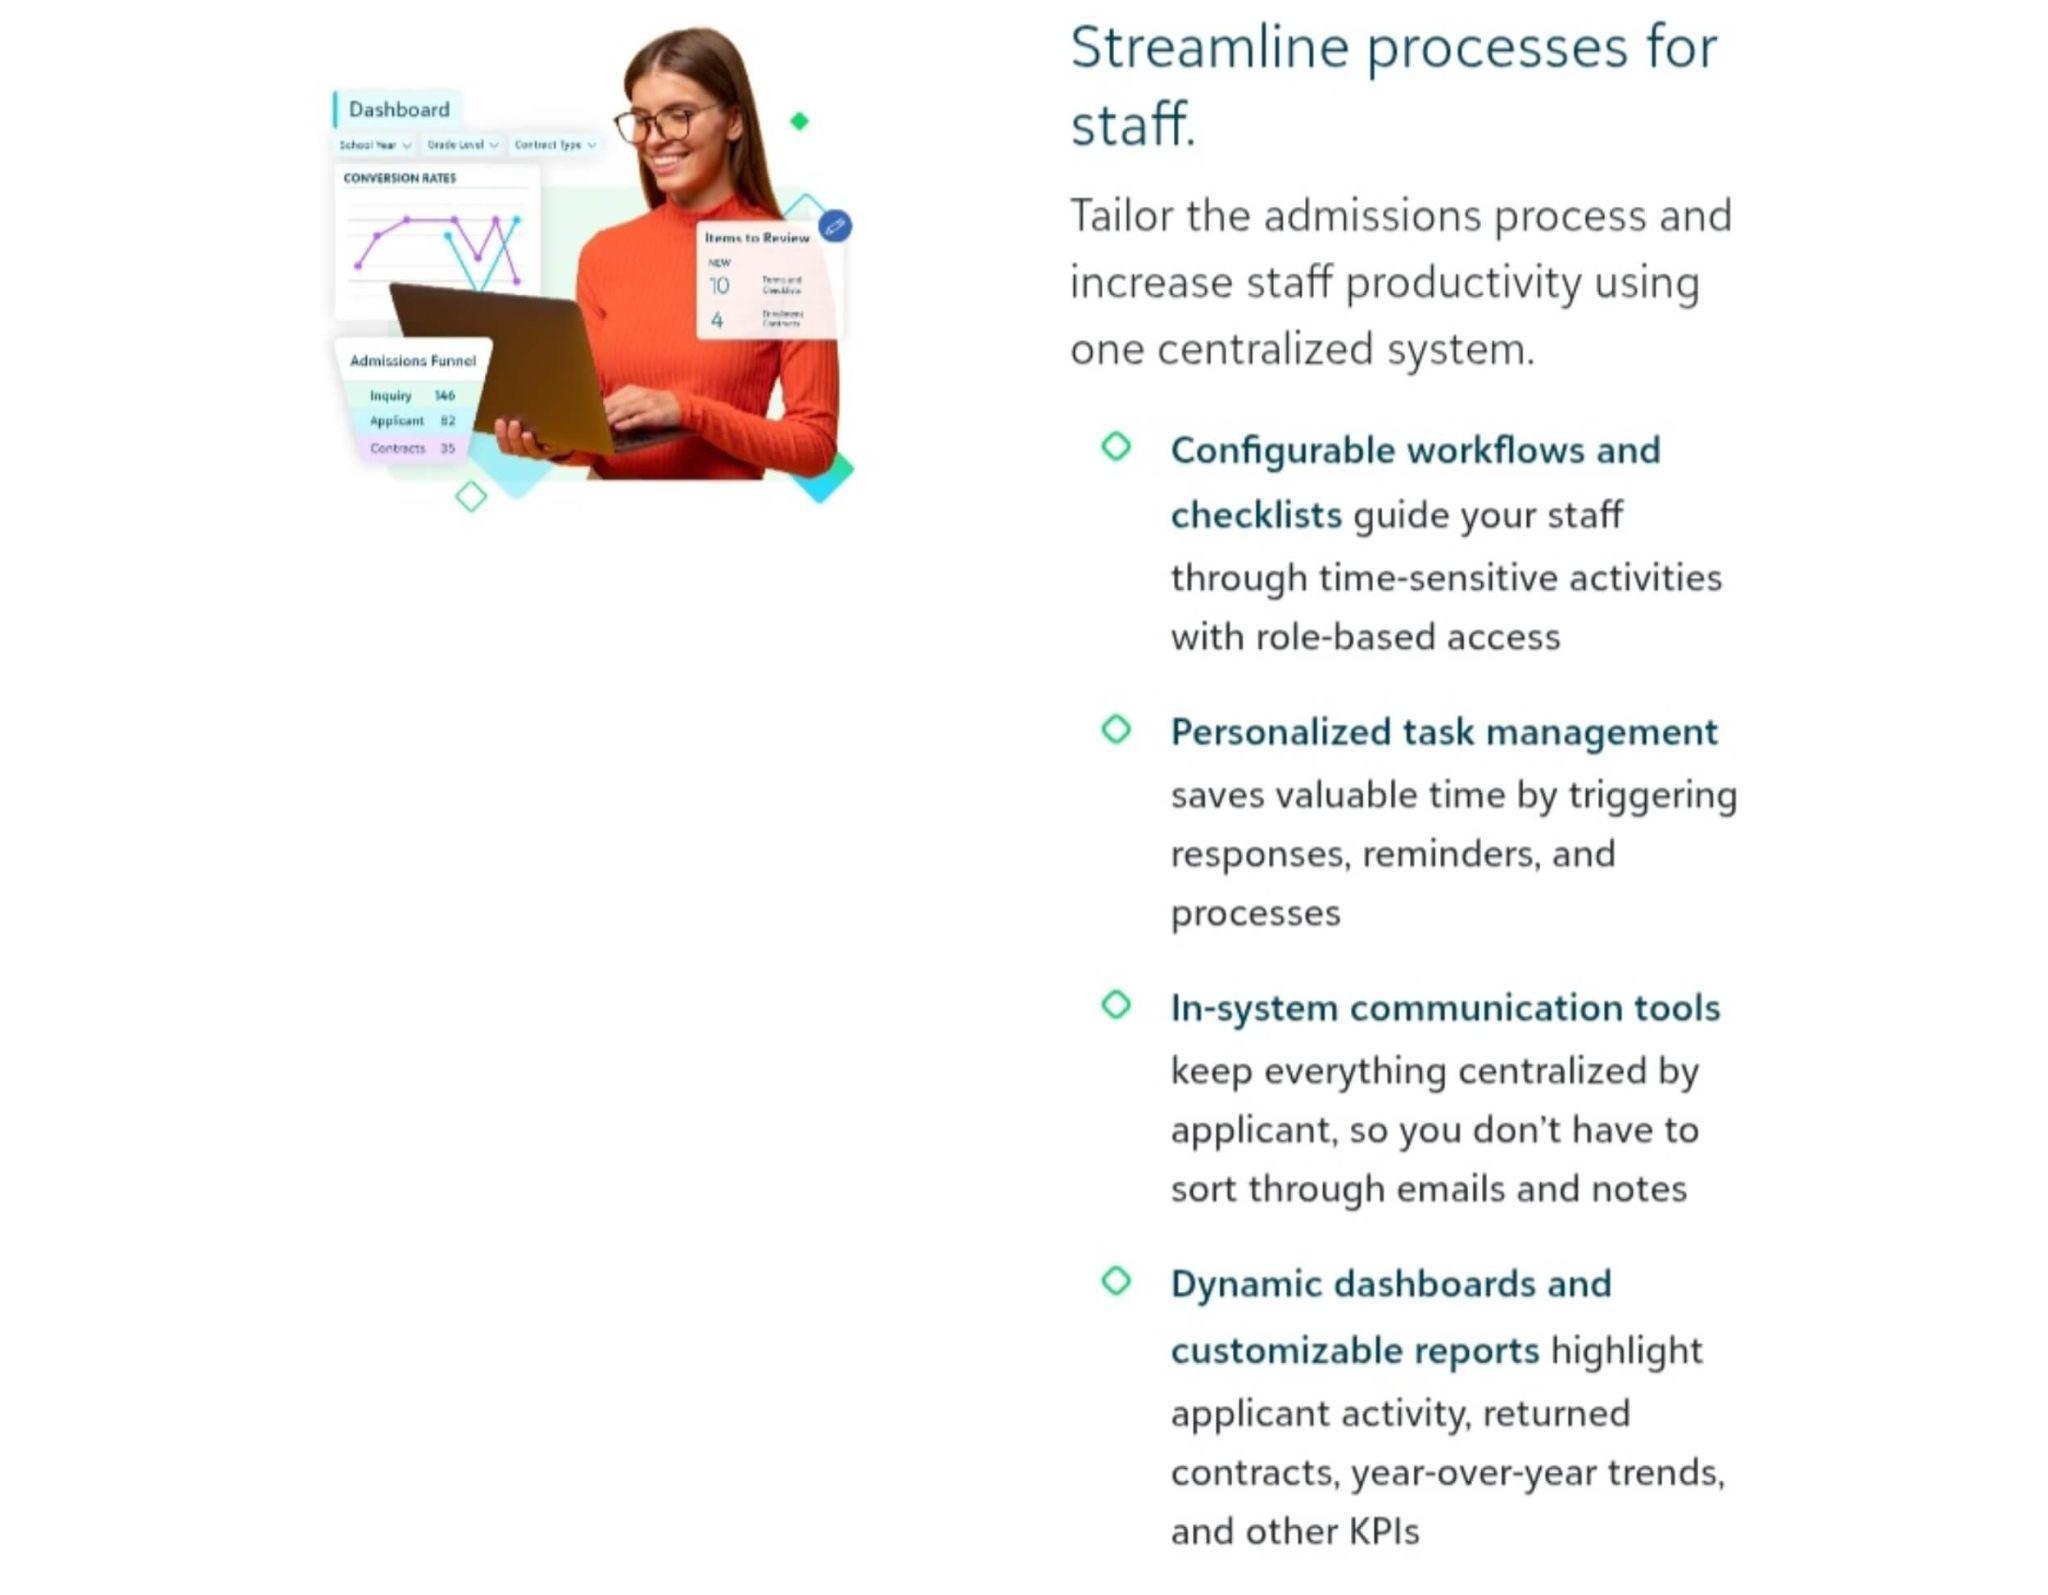


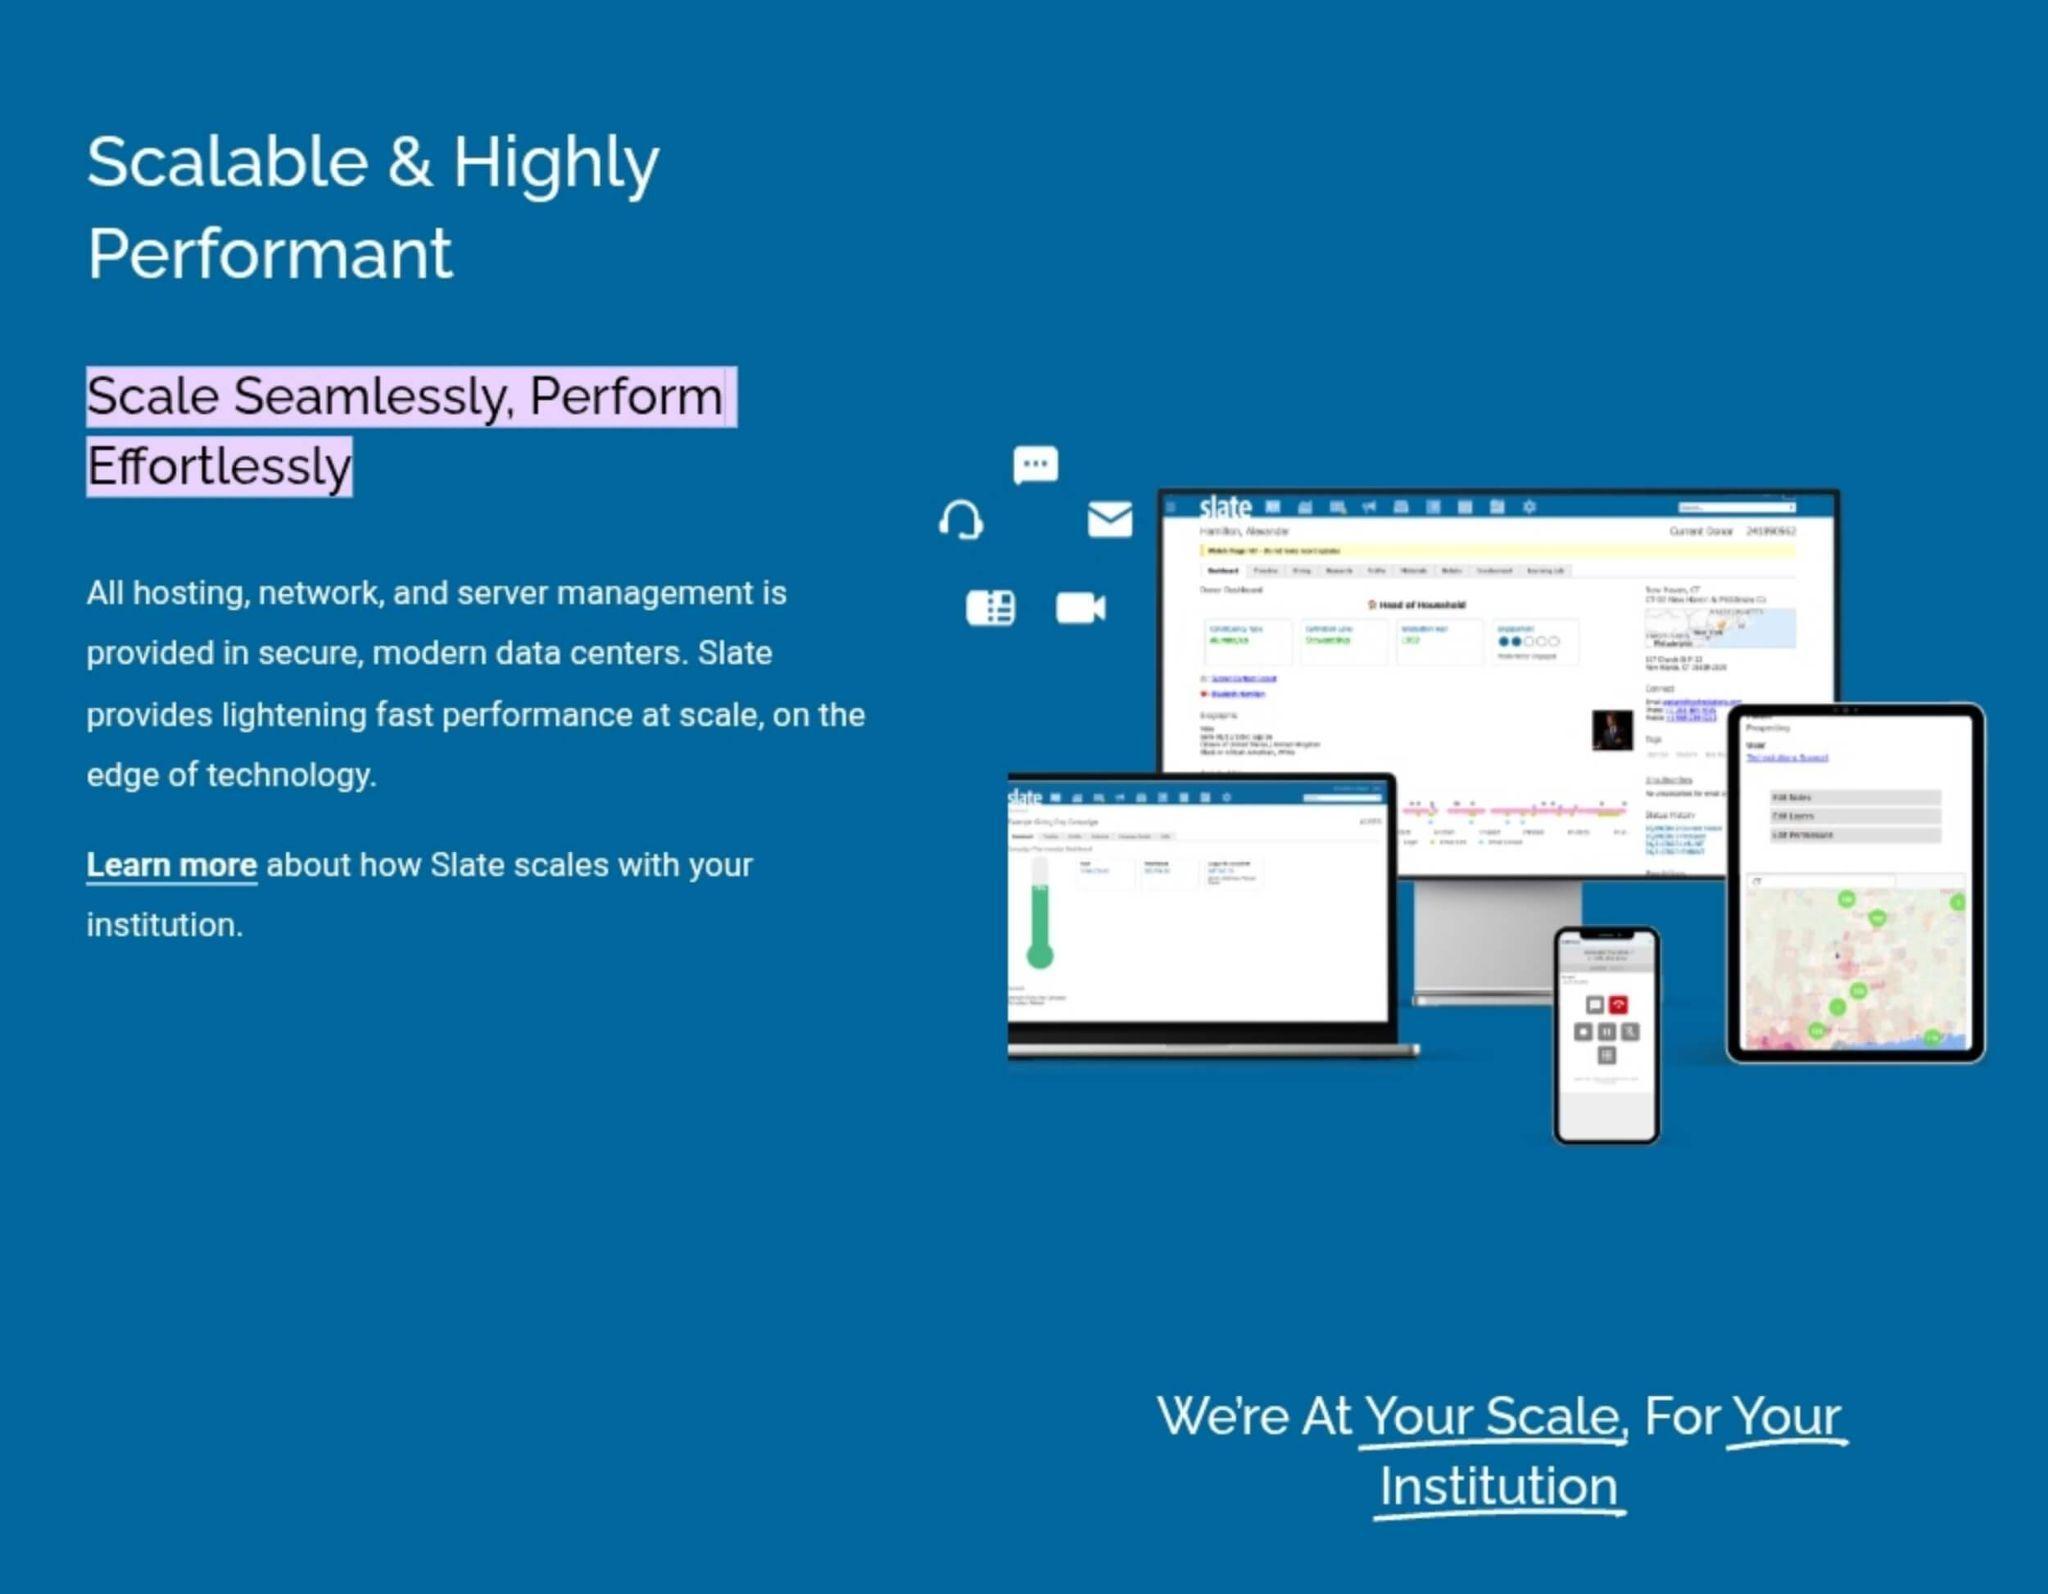


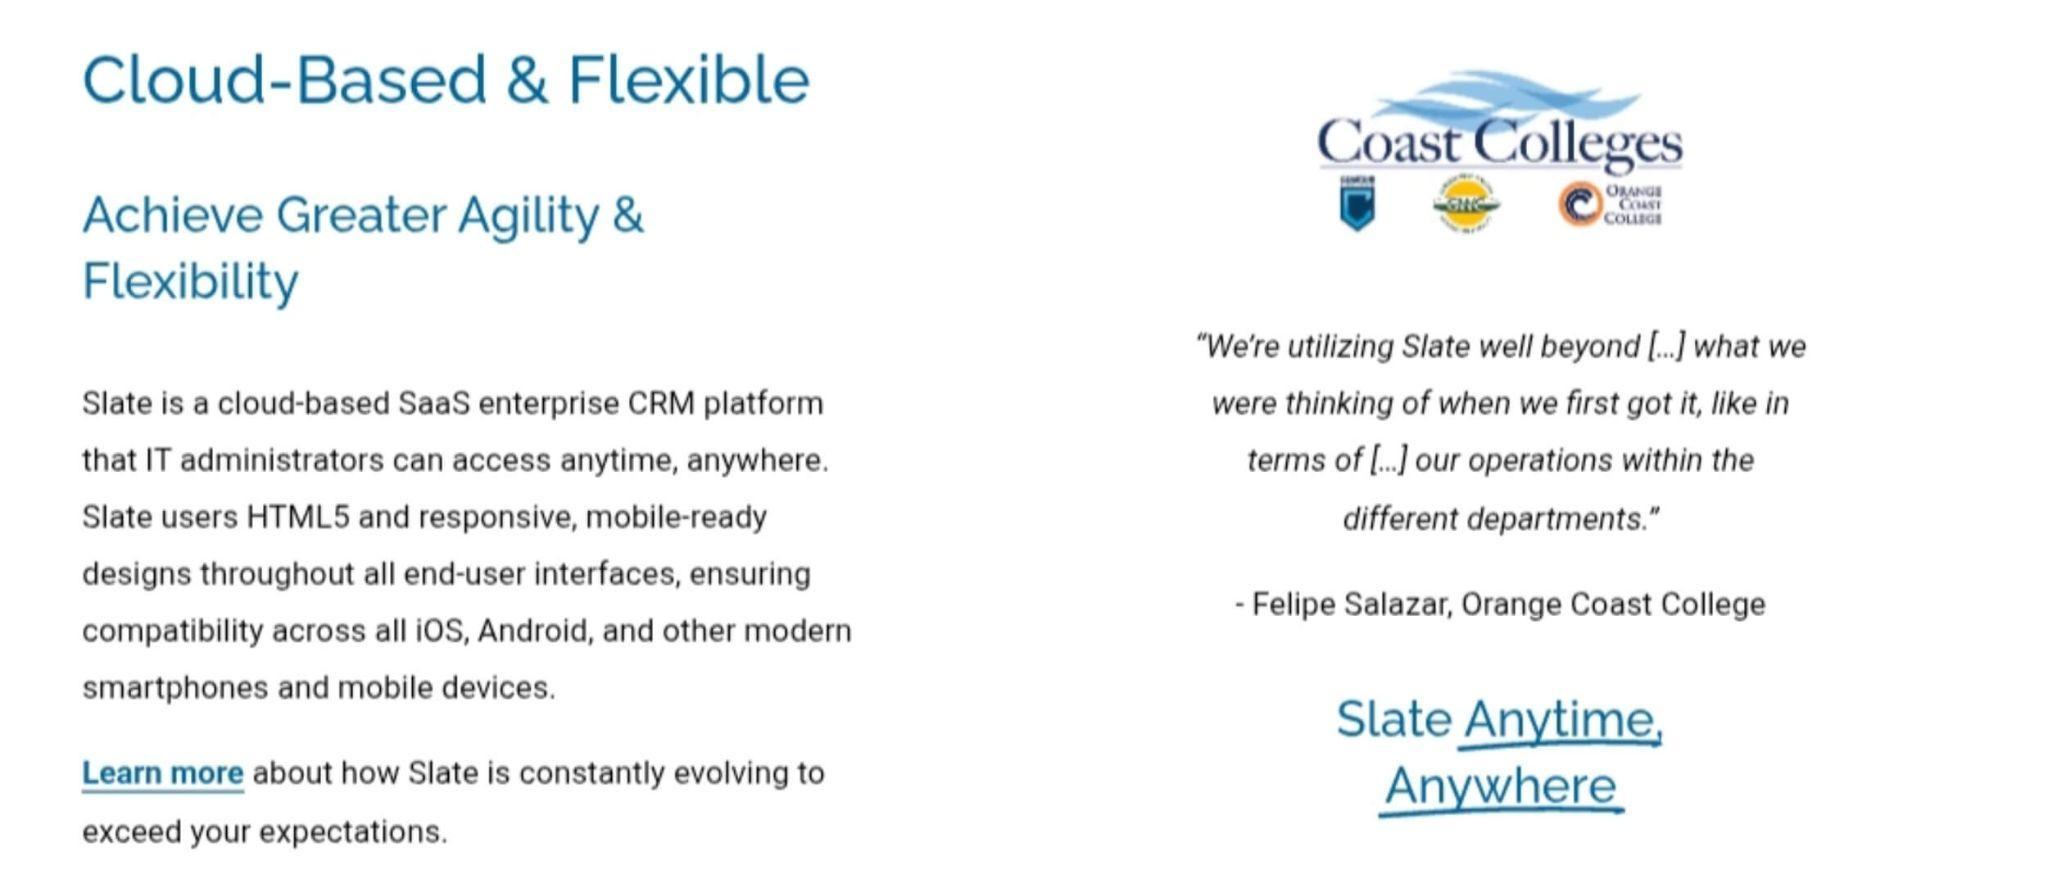
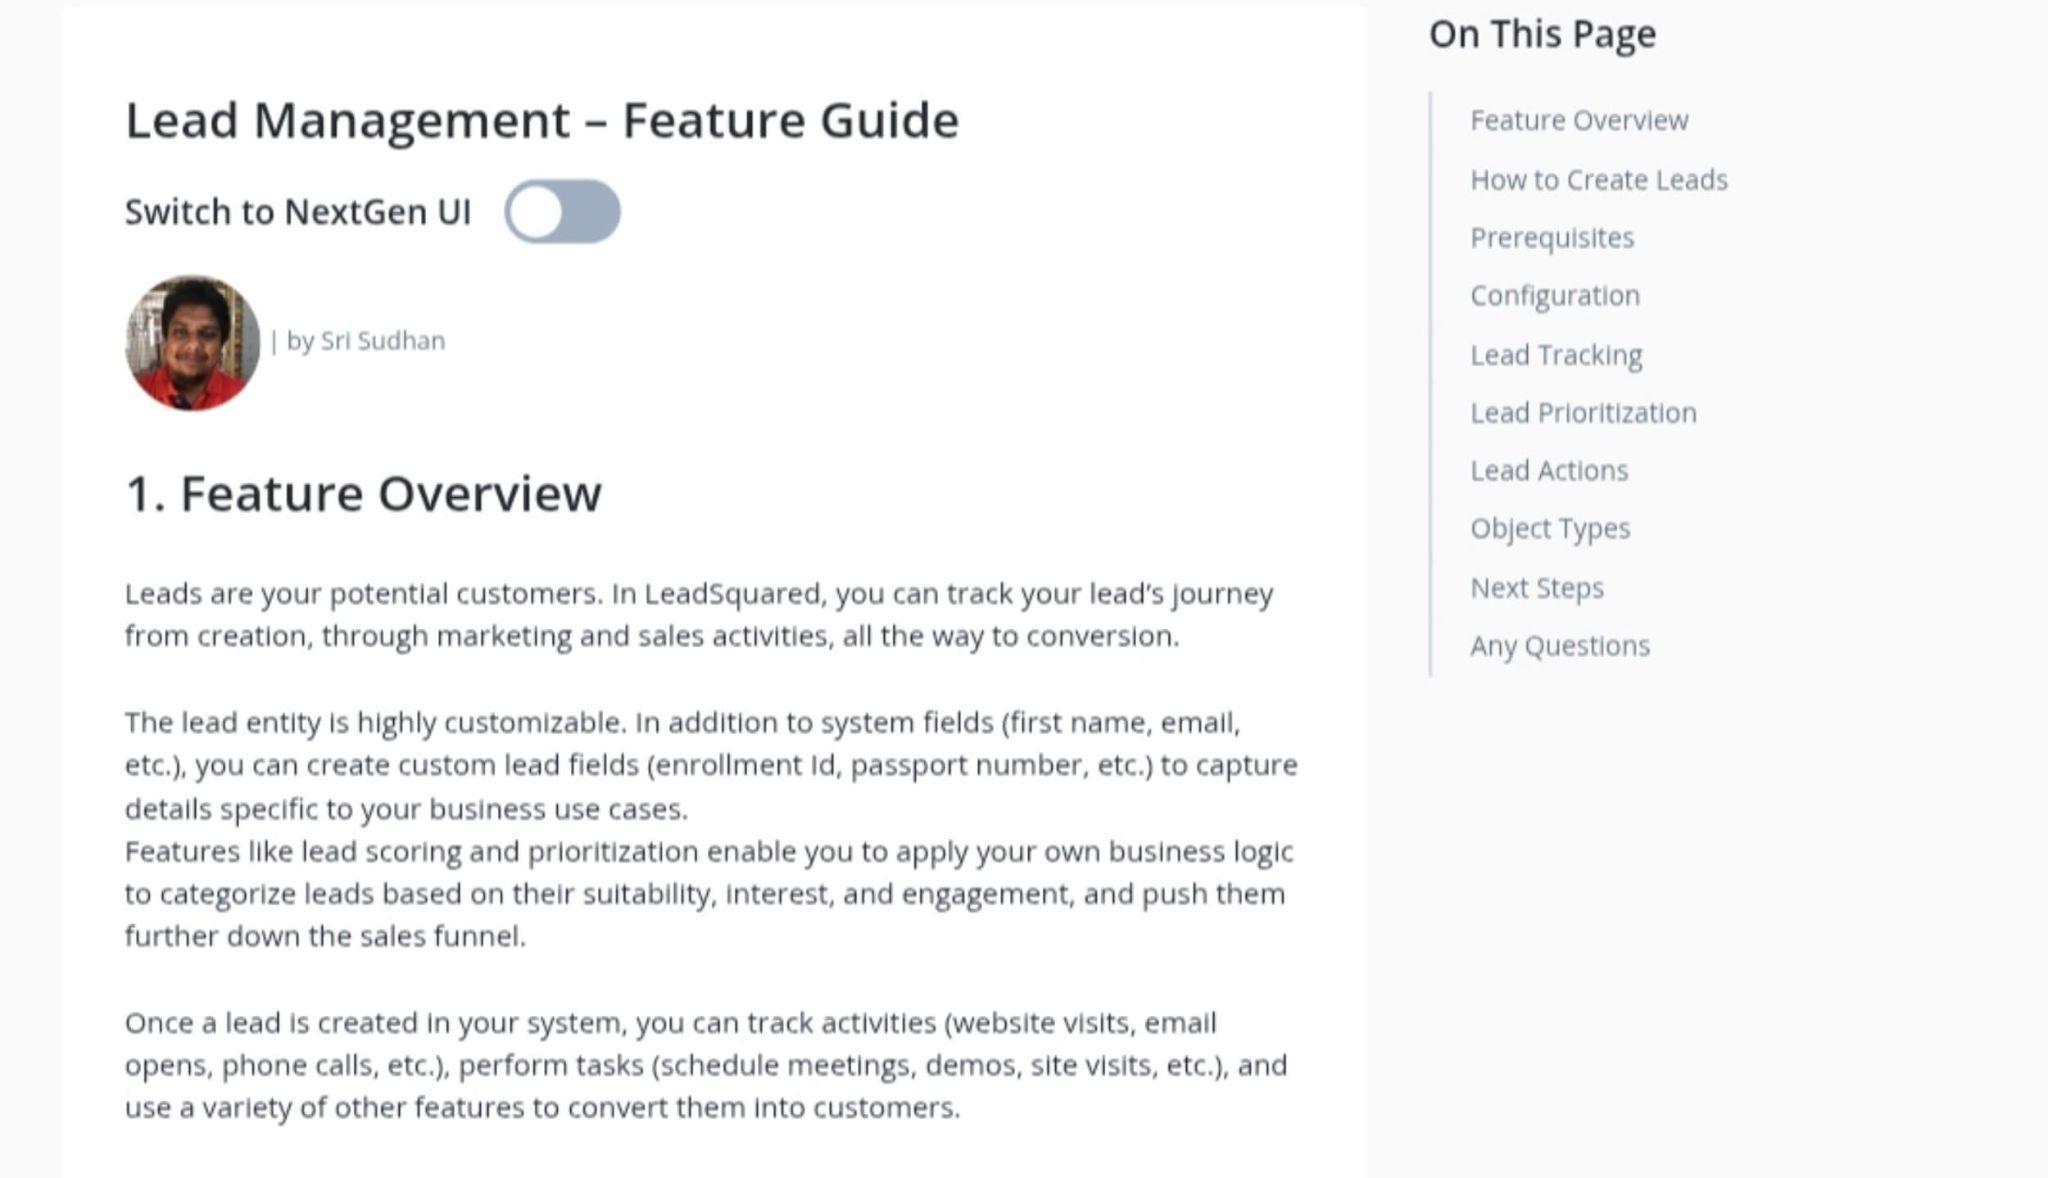


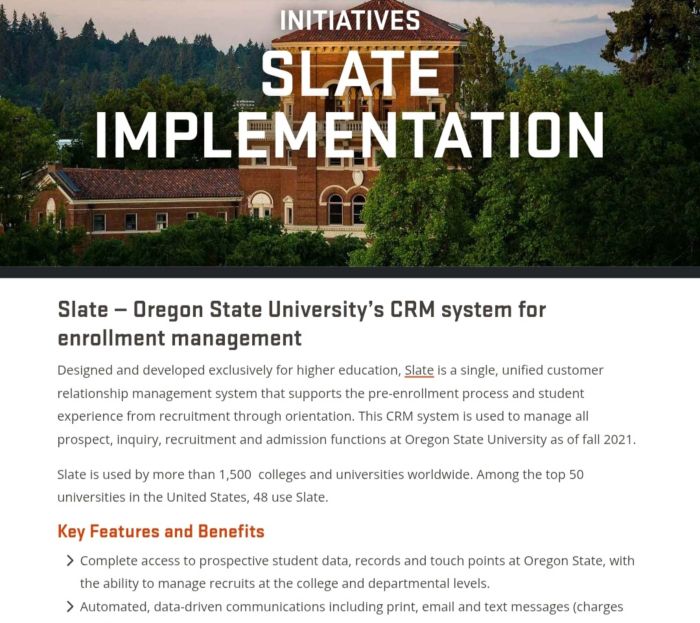
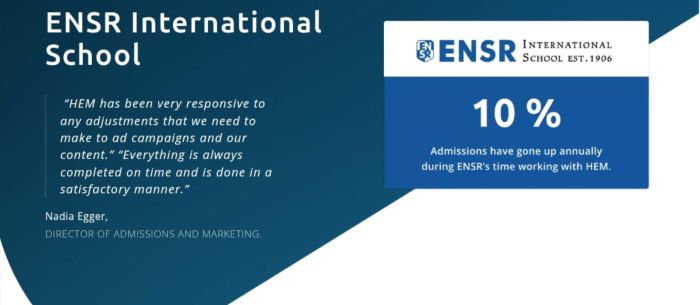


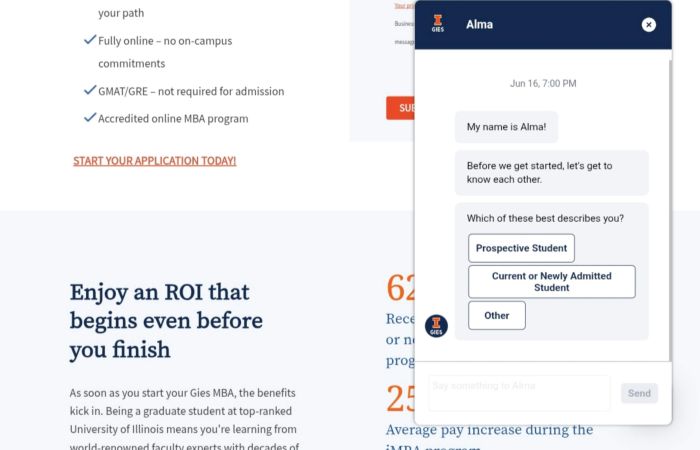
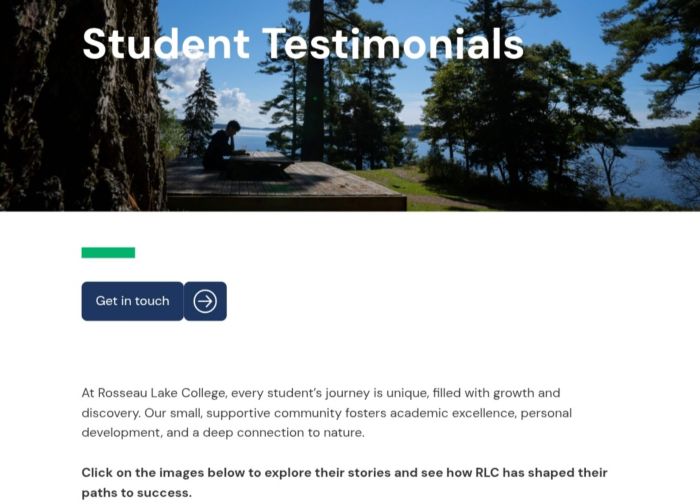

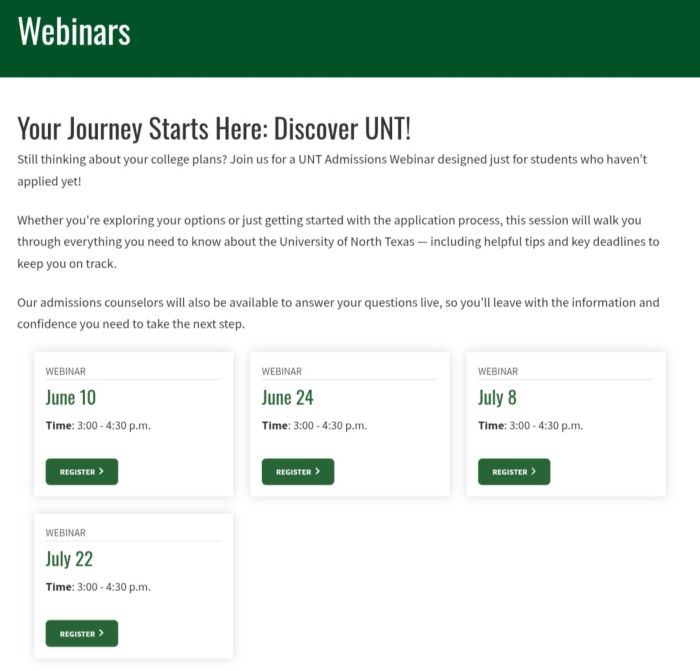
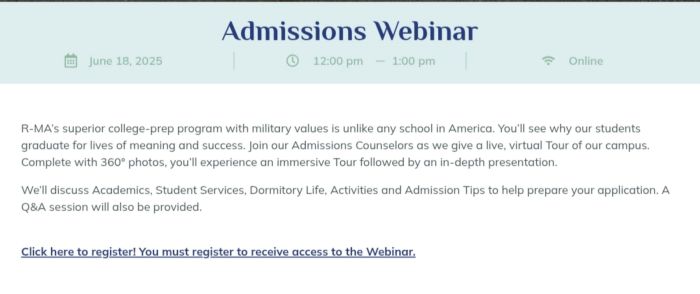
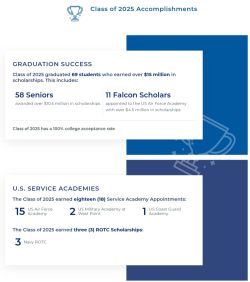


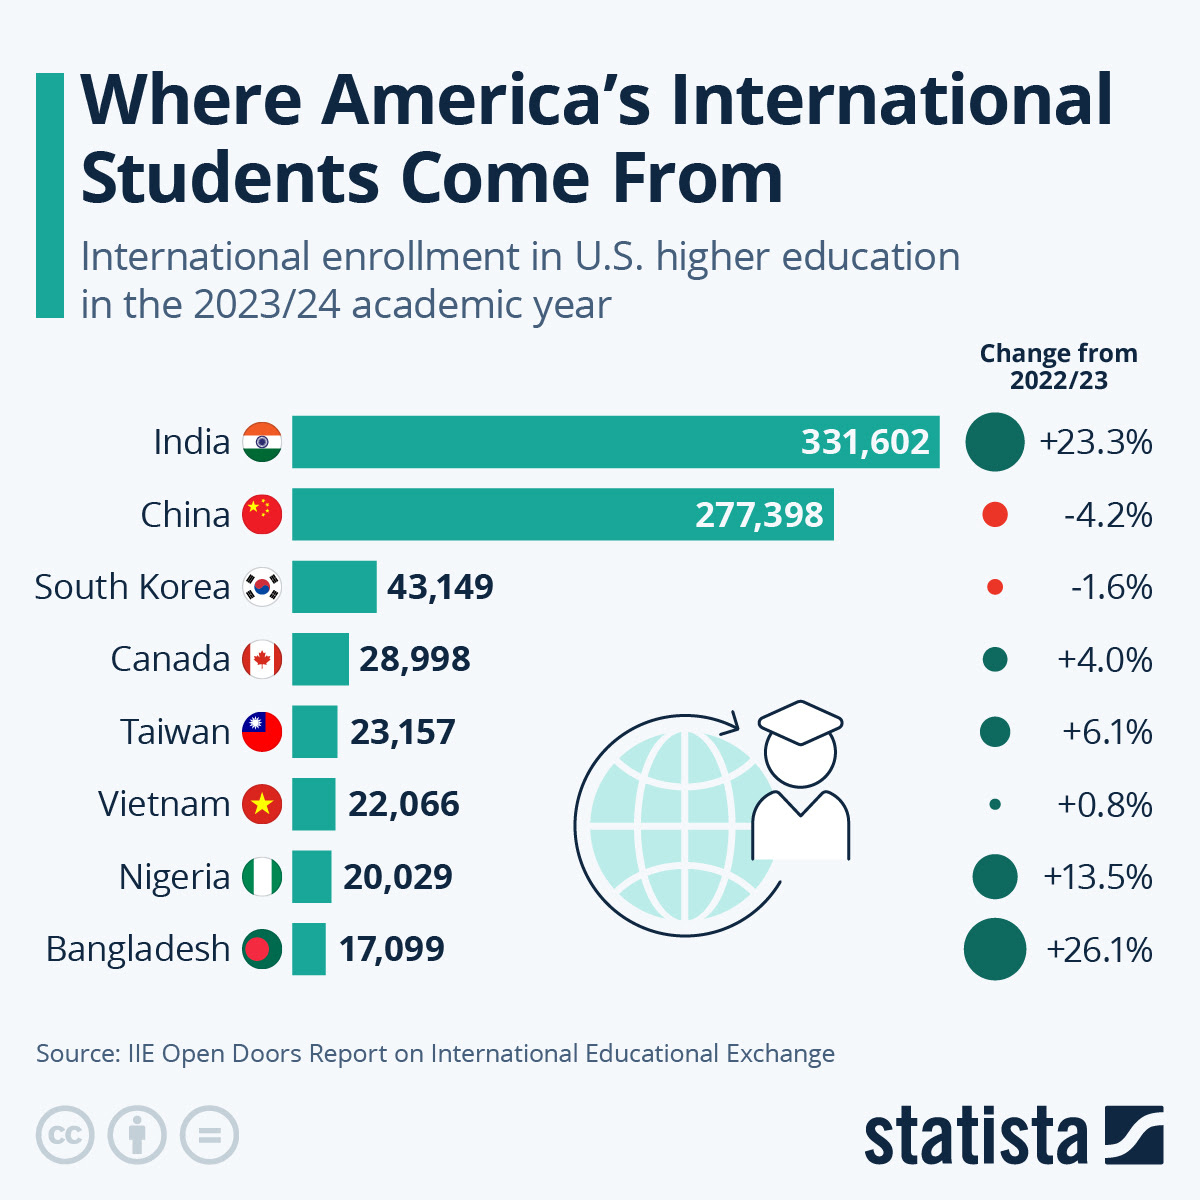