Tag: Ethnicity

  • Causes and consequences of access disparities by ethnicity

    Causes and consequences of access disparities by ethnicity

    If you haven’t looked recently at the stats on the different rates of HE participation by ethnicity, you may find them quite striking.

    Today, young people from ethnic minority backgrounds are progressing to university in record numbers.

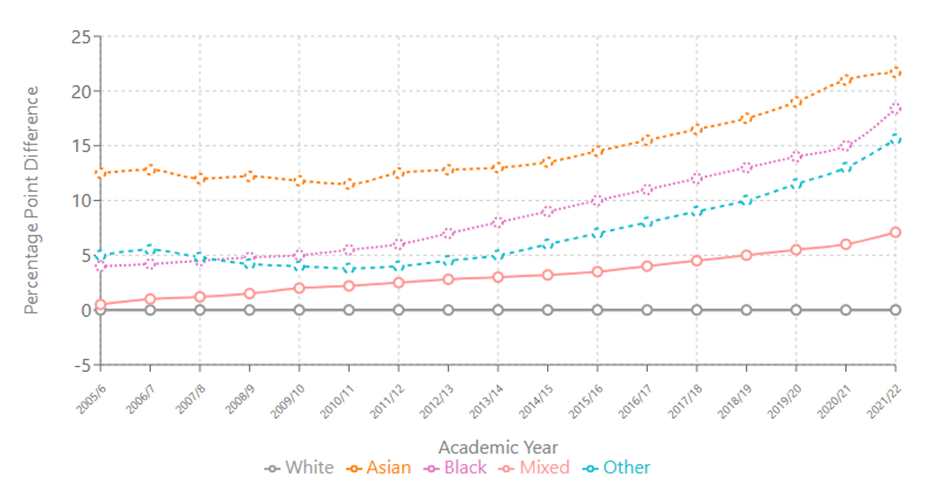
    According to the most recent figures from DfE, the proportion of school pupils in England of white ethnicity who progress to HE by age 19 (41.8 per cent) is comfortably exceeded by the corresponding proportions of school pupils of Asian (68.4 per cent), Black (62.4 per cent) and mixed (51.8 per cent) ethnicity.

    White school pupils now also have the lowest progression rate to more selective high tariff universities. Statistics concerning the intersection of ethnicity and socioeconomic background are even more striking – Black school pupils who are also free school meals (FSM) eligible, for example, have a higher HE participation rate (51.3 per cent) than white pupils who are not FSM eligible (45.1 per cent).

    Can these gaps be explained?

    Whilst as a sector we (quite rightly) focus more on the gap in degree-level attainment by ethnicity (where white students typically outperform those from ethnic minority backgrounds), it is still worth considering why gaps in HE access by ethnicity are so large and what the longer term ramifications of these gaps may be. I recently published a piece of academic research which sought to understand the drivers of HE participation gaps by ethnicity.

    This is a much less straightforward task than trying to understand the drivers of disparities in HE participation by socioeconomic background or gender. A number of statistical modelling exercises, using England’s rich administrative datasets, have shown that gaps in HE participation by FSM eligibility and gender tend to almost vanish once average differences in school attainment are controlled for statistically. Of course, this does not excuse such disparities, but it does help us to better understand why they exist.

    However, when it comes to the link between ethnicity, school attainment and the likelihood of going to university, the relationship here seems to be far from straightforward. For example, Black school pupils in England get slightly lower grades, on average, in their GCSE exams than their white counterparts. Yet at the same time Black pupils are (quite comfortably) more likely to end up progressing to university. At first glance therefore, these statistics appear somewhat counter-intuitive.

    In an analysis of linked National Pupil Database (NPD) and HESA data, I discovered that to better understand overall disparities in HE access by ethnicity, we need to investigate how these disparities vary at different points along the overall school attainment spectrum.

    This can be done using a really straightforward method. First, take an entire cohort of all state school pupils in England (I used the one who took their GCSE exams in 2015) and divide them up into five attainment quintiles based on their grades in their best 8 GCSE subjects. Then, within each of these attainment sub-populations, investigate how HE participation varies by ethnicity.

    For higher attainers, the results were largely unremarkable. But for those with slightly below average attainment, the results were truly staggering.

    The participation gulf for those with lower school attainment

    Young people from ethnic minority backgrounds with high attainment are more likely to end up at university than their high-attaining white British counterparts, but only slightly so. For example, 81.2 per cent of those pupils who were both white British and in the highest quintile of attainment ended up at university, compared to 83.3 per cent of high attainers of Black Caribbean ethnicity and 87.7 per cent of high-attainers of Pakistani ethnicity. So far, so “meh”.

    But consider what happens at the second lowest quintile of attainers. This time, only 9.7 per cent of all white British students in this attainment bracket end up at university. At this same level of attainment, the HE progression rate for those of Pakistani ethnicity is 38.4 per cent, while the rate for those of Black African ethnicity is 52.1 per cent.

    You can take a look at all the percentages here in Table 4 of my paper if you’re really keen, but I can sum it up for you quite simply. While young people from ethnic minority backgrounds with high school attainment are slightly more likely to go to university than high attainers from white British backgrounds, lower attainers from ethnic minority backgrounds are considerably more likely to end up at university than their lower attaining white British counterparts.

    And when I say considerably, I mean considerably.

    Implications

    The upshot of all this is quite simple. Rightly or wrongly, once you get below a certain level of attainment, young people of white British ethnicity just don’t seem interested in going to university anymore. On the other hand, lower attainers from ethnic minority backgrounds are still quite keen to participate in HE, even though their level of attainment might mean that they may face a somewhat constrained choice of different institutions and courses.

    This leads us then to another question – why are young people from ethnic minority backgrounds (especially those with lower attainment) – so much keener to go to university? One somewhat unhelpful answer to this question was offered in the controversial Commission on Race and Ethnic Disparities report which was commissioned by the previous Conservative government. In the view of the commissioners, many people in ethnic minority communities have “an exaggerated respect for the academic route as the only path to success and economic safety on the part of ethnic minorities”. This perspective of course conveniently ignores another explanation which is well grounded in the sociological literature, which is that within ethnic minority communities, becoming as well-qualified as possible is seen as a necessary strategy to adopt in order to counteract the effects of racial discrimination in the labour market.

    Those of white ethnicity, in contrast, may enjoy more latitude to follow alternative pathways with the confidence that they are likely to fall on their feet in the end whatever happens.

    Aesop’s fables

    One thing we know for sure is that, for those with slightly lower school attainment, white and ethnic minority students seem to be making different choices on average at age 18. How might this all pan out in the longer term? Or, to put it another way, how do graduates with lower school attainment fare in the jobs market, compared to non-graduates with lower school attainment?

    When I look at analyses of the LEO earnings data for answers to this question, what I see reminds me of that familiar tale of the race between the tortoise and the hare. School leavers with lower attainment (defined here as not having at least 5 A*-C grades at GCSE) who do not go to university are the hares who dash out of the traps fairly quickly, typically earning wages (albeit fairly low ones) between the ages of 18-21. They have typically enjoyed slightly higher total earnings by age 30 than those lower attainers who went to university, who tend to enjoy only a fairly limited graduate earnings premium at first.

    But the graduate tortoises tend to plod their way to greater career earnings in the end, since graduates are much more likely to enjoy wage increases through midlife, whilst the non-graduate hares take an earnings siesta.

    Of course, most analysis of LEO so far concerns cohorts of people born in the mid to late 1980s. Without a crystal ball, young people today with lower school attainment can’t really be sure whether going to university (from a career and earnings perspective) will be a smart move or not. Either decision could be justified.

    Going to university has always tended to pay off (on average) so far, even as naysayers have continued to argue that the jobs market is becoming too saturated with graduates. On the other hand, continued (and very much welcome) increases in the salaries of less-educated workers (brought about in part by successive real-terms increases to the National Living Wage) may serve to both reduce the size of the graduate earnings premium for lower attainers whilst also increasing the opportunity cost (though foregone earnings) of attending university.

    Only the longitudinal studies of the future will confirm whether young people today with lower school attainment will turn out to be better off in the jobs market by going to university or not.

    However, if the fortunes of lower attaining graduates turn out to be different on average to the fortunes of lower attaining non-graduates, we can be pretty confident that disparities in fortunes by ethnicity will follow.

    Source link

  • Hiding in plain sight? A simple statistical effect may largely explain the ethnicity degree awarding gap

    Hiding in plain sight? A simple statistical effect may largely explain the ethnicity degree awarding gap

    • By Sean Brophy (@seanbrofee), Senior Lecturer at the Centre for Decent Work and Productivity, Manchester Metropolitan University.

    A persistent challenge in UK higher education is the ethnicity degree awarding gap – the difference between White and ethnic minority students receiving top degrees (firsts or 2:1s). The Office for Students (OfS) aims to entirely eliminate this gap by 2030/31, but what if most of this gap reflects success in widening participation rather than systemic barriers?

    Between 2005/6 and 2021/22, university participation grew 21% faster for Asian students and 17% faster for Black students compared to White students. This remarkable success in widening access might paradoxically explain one of the UK’s most persistent higher education challenges.

    Figure 1 presents ethnicity gaps over time compared to a White baseline (the grey line constant at zero). The data for 2021/22 shows significant gaps: 21 percentage points for Black students, 9 for Asian students, and 4 for Mixed ethnicity students compared to their White peers. Traditional explanations focus on structural barriers, cultural differences, and potential discrimination, and much of the awarding gap remains unexplained after adjusting for prior attainment and background characteristics. However, a simpler explanation might be hiding in plain sight: the gap may also reflect a statistical effect created by varying participation rates across ethnic groups.

    Ethnicity Degree Awarding Gap (2014/15 – 2021/22)

    Figure 1. Source: HESA

    Here is the key insight: ethnic minority groups now participate in higher education at remarkably higher rates than White students, which likely then drives some of the observed ethnicity awarding gaps. Figure 2 presents the over-representation of ethnic groups in UK higher education relative to the White reference group (again, the constant grey line). The participation gap has grown substantially – Asian students were 22 percentage points more likely to attend university than White students in 2021/22, with Black students 18 points higher.

    Over-representation of ethnic groups in HE compared to White baseline (2005/6-2021/22)

    Figure 2. Source: UCAS End Of Cycle Report 2022

    This difference in participation rates creates an important statistical effect, what economists call ‘compositional effects’. When a much larger proportion of any group enters university, that group may naturally include a broader range of academic ability. Think of it like this: if mainly the top third of White students attend university, but nearly half of ethnic minority students do, we would expect to see differences in degree outcomes – even with completely fair teaching and assessment.

    This principle can be illustrated using stylized ability-participation curves for representative ethnic groups in Figure 3. These curves show the theoretical distribution of academic ability for Asian, Black, and White groups, with the red shaded area representing the proportion of students from each group accepted into higher education in 2021/22. It would be surprising if there was no degree awarding gap under these conditions!

    Stylized ability-participation curves by ethnic group

    This hypothesis suggests the degree awarding gap might largely reflect the success of widening participation policies. Compositional effects like these are difficult to control for in studies, and it is noteworthy that, to date, no studies on the ethnicity awarding gap have adequately controlled for these effects (including one of my recent studies).

    While this theory may offer a compelling statistical explanation, future research pursuing this line of inquiry needs to go beyond simply controlling for prior achievement. We need to examine both how individual attainment evolves from early education to university, using richer measures than previous studies, and how the expansion of university participation has changed the composition of student ability over time. This analysis must also account for differences within broad ethnic categories (British Indian students, for example, show different patterns from other Asian groups) and consider how university and subject choices vary across groups.

    My argument is not that compositional effects explain everything — rather, understanding their magnitude is crucial for correctly attributing how much of the gap is driven by traditional explanations, such as prior attainment, background characteristics, structural barriers, or discrimination. Only with this fuller picture can we properly target resources and interventions where they’re most needed.

    If this hypothesis is proven correct, however, it underscores why the current policy focus on entirely eliminating gaps through teaching quality or support services, while well-intentioned, may be misguided. If gaps are the statistically inevitable result of differing participation patterns among ethnic groups, then institutional interventions cannot entirely eliminate them. This doesn’t mean universities shouldn’t strive to support all students effectively – but it does require us to fundamentally rethink how we measure and address educational disparities.

    Rather than treating all gaps as problems to be eliminated, we should:

    1. Fund research which better accounts for these compositional effects.
    2. Develop benchmarks that account for participation rates when measuring degree outcomes.
    3. Contextualize the success of widening participation with acknowledging awarding gaps as an inevitable statistical consequence.
    4. Focus resources on early academic support for students from all backgrounds who might need additional help, particularly in early childhood.
    5. Explore barriers in other post-16 or post-18 pathways that may be contributing to the over-representation of some groups in higher education.

    Source link

  • Comparative Data on Race & Ethnicity in Education Abroad by Percentage of Students [2025]

    Comparative Data on Race & Ethnicity in Education Abroad by Percentage of Students [2025]

    References


    American Association of Community Colleges. (2024). AACC Fast Facts 2024. https://www.aacc.nche.edu/researchtrends/fast-facts/


    Fund for Education Abroad (FEA). (2024, December). Comparative Data on Race & Ethnicity of FEA Awards 20222023 by Percentage of Students. Data obtained from Joelle Leinbach, Program Manager at the Fund for Education Abroad. https://fundforeducationabroad.org/  


    Institute of International Education. (2024). Profile of U.S. Study Abroad Students, 2024 Open Doors U.S. Student Data. https://opendoorsdata.org/data/us-study-abroad/student-profile/  


    Institute for International Education. (2024). Student Characteristics: U.S. Students Studying Abroad at Associate’s Colleges Data from the 2024 Open Doors Report. https://opendoorsdata.org/data/us-study-abroad/community-college-student-characteristics/


    Institute for International Education. (2022, May) A Legacy of Supporting Excellence and Opportunity in Study Abroad: 20-Year Impact Study, Comprehensive Report. Benjamin A. Gilman International Scholarship. https://www.gilmanscholarship.org/program/program-statistics/ 


    United States Census Bureau. (2020). DP1 | Profile of General Population and Housing Characteristics, 2020: DEC Demographic Profile. https://data.census.gov/table?g=010XX00US&d=DEC+Demographic+Profile  


    U.S. Department of Education, Institute of Education Sciences, National Center for Education Statistics. (2023, August). Characteristics of Postsecondary Students. https://nces.ed.gov/programs/coe/indicator/csb/postsecondarystudents

    Bibliography of Literature, Presentations & Curriculum Integration Projects Incorporating the Comparative Data Table on Race & Ethnicity in Education Abroad

    Comp, D. & Bakkum, N. (2025, January). Study Away/Abroad for All Students! – Who Studies Away/Abroad at Columbia College? Invited presentation for faculty at the Winter 2025 Faculty and Staff Development Days at Columbia College Chicago.

    Lorge, K. & Comp, D. (2024, April). A Case for Simple and Comparable Data to Assess Race and Ethnicity in Education Abroad. The Global Impact Exchange: Publication of Diversity Abroad. Spring 2024. https://www.diversityabroad.org/GlobalImpactExchange 

    Comp, D. (2019). Effective Utilization of Data for Strategic Planning and Reporting with Case Study: My Failed Advocacy Strategy. In. A.C. Ogden, L.M. Alexander, & Mackintosh, E. (Eds.). Education Abroad Operational Management: Strategies, Opportunities, and Innovations, A Report on ISA ThinkDen, 72-75. Austin, TX: International Studies Abroad. https://educationaltravel.worldstrides.com/rs/313-GJL-850/images/ISA%20ThinkDen%20Report%202018.pdf  

    Comp, D. (2018, July). Effective Utilization of Data for Strategic Planning and Reporting in Education Abroad. Invited presentation at the ISA ThinkDen at the 2018 ThinkDen meeting, Boulder CO.

    Comp, D. (2010). Comparative Data on Race and Ethnicity in Education Abroad. In Diversity in International Education Hands-On Workshop: Summary Report and Data from the Workshop held on September 21, 2010, National Press Club, Washington, D.C. (pp. 19-21). American Institute For Foreign Study. https://www.aifsabroad.com/publications/

    Stallman, E., Woodruff, G., Kasravi, J., & Comp, D. (2010, March). The Diversification of the Student Profile. In W.W. Hoffa & S. DePaul (Eds.). A History of US Study Abroad: 1965 to Present, 115-160. Carlisle, PA: The Forum on Education Abroad/Frontiers: The Interdisciplinary Journal of Study Abroad.

    Comp, D., & Woodruff, G.A. (2008, May). Data and Research on U.S. Multicultural Students in Study Abroad. Co-Chair and presentation at the 2008 NAFSA Annual Conference, Washington, D.C.

    Comp, D.  (2008, Spring). U.S. Heritage-Seeking Students Discover Minority Communities in Western Europe.  Journal of Studies in International Education, 12 (1), 29-37.

    Comp, D.  (2007). Tool for Institutions & Organizations to Assess Diversity of Participants in Education Abroad. Used by the University of Minnesota Curriculum Integration Project.

    Comp, D. (2006). Underrepresentation in Education Abroad – Comparative Data on Race and Ethnicity. Hosted on the NAFSA: Association of International Educators, “Year of Study Abroad” website.

    Comp, D. (2005, November). NAFSA: Association of International Educators Subcommittee on Underrepresentation in Education Abroad Newsletter, 1 (2), 6.

    Past IHEC Blog posts about the Comparative Data Table on Race & Ethnicity in Education Abroad

    Tool for Institutions & Organizations to Assess Diversity of Participants in Education Abroad [February 15, 2011]

    How Do We Diversify The U.S. Study Abroad Student Population? [September 21, 2010]

    How do we Diversify the U.S. Study Abroad Student Profile? [December 8, 2009]

    Source link

  • Student Debt by Ethnicity | HESA

    Student Debt by Ethnicity | HESA

    Hi all. Just a quick one today, this time on some data I recently got from StatsCan.

    We know a fair a bit about student debt in Canada, especially with respect to distribution by gender, type of institution, province, etc. (Chapter 6 of The State of Postsecondary Education in Canada is just chock full of this kind of data if you’re minded to take a deeper dive). But to my knowledge no one has ever pulled and published the data on debt by ethnicity, even though this data has been collected for quite some time through the National Graduates Survey (NGS). So I ordered the data, and here’s what I discovered.

    Figure 1 shows incidence of borrowing for the graduating class of 2020, combined for all graduates of universities and graduates, for the eight largest ethnicities covered by the NGS (and before anyone asks, “indigeneity” is not considered an ethnicity so anyone indicating an indigenous ethnicity is unfortunately excluded from this data… there’s more below on the challenges of getting additional data). And the picture it shows is…a bit complex.

    Figure 1: Incidence of Borrowing, College and University Graduates Combined, Class of 2020

    If you just look at the data on government loan programs (the orange bars), we see that only Arab students have borrowing rates in excess of 1 in 2. But for certain ethnicities, the borrowing rate is much lower. For Latin American and Chinese students, the borrowing rate is below 1 in 3, and among South Asian students the borrowing rate is barely 1 in 5. Evidence of big differences in attitudes towards borrowing!

    Except…well when you add in borrowing from private sources (e.g. from banks and family) so as to take a look at overall rates of borrowing incidence, the differences in borrowing rates are a lot narrower. Briefly, Asian and Latin American students borrow a lot more money from private sources (mainly family) than do Arab students, whites, and Blacks. These probably come with slightly easier repayment terms, but it’s hard to know for sure. An area almost certainly worthy of further research.

    There is a similarly nuanced picture when we look at median levels of indebtedness among graduates who had debt. This is shown below in Figure 2.

    Figure 2: Median Borrowing, College and University Graduates Combined, Class of 2020

    Now, there isn’t a huge amount of difference in exiting debt levels by ethnicity: the gap is only about $6,000 between the lowest total debt levels (Filipinos) and the highest (Chinese). But part of the problem here is that we can’t distinguish the reason for the various debt levels. Based on what we know about ethnic patterns of postsecondary education, we can probably guess that Filipino students have low debt levels not because they are especially wealthy and can afford to go to post-secondary without financial assistance. But rather because they are more likely to go to college and this spend less time, on average, in school paying fees and accumulating debt. Similarly, Chinese students don’t have the highest debt because they have low incomes; they have higher debt because they are the ethnic group the most likely to attend university and spend more time paying (higher) fees.

    (Could we get the data separately for universities and colleges to clear up the confound? Yes, we could. But it cost me $3K just to get this data. Drilling down a level adds costs, as would getting data based on indigenous identity, and this is a free email, and so for the moment what we have above will have to do. If anyone wants to pitch in a couple of grand to do more drilling-down, let me know and I would be happy to coordinate some data liberation).

    It is also possible to use NGS data to look at post-graduate income by debt. I obtained the data by in fairly large ranges (e.g. $0-20K, $20-60K, etc.), but it’s possible on the basis of that to estimate roughly what median incomes are (put it this way: the exact numbers are not exactly right, but the ordinal rank of income of the various ethnicities are probably accurate). My estimations of median 2023 income of 2020 graduates—which includes those graduates who are not in the labour market full-time, if you’re wondering why the numbers look a little low—are shown below in Figure 3.

    Figure 3: Estimate Median 2023 Income, College and University Graduates Combined, Class of 2020

    Are there differences in income here? Yes, but they aren’t huge. Most ethnic groups have median post-graduate incomes between $44 and $46,000. The two lowest-earning groups (Latin Americans and Filipinos) re both disproportionately enrolled in community colleges, which is part of what is going on in this data (if you want disaggregated data, see above).

    Now, the data from the previous graphs can be combined to look at debt-to-income ratios, both for students with debt, and all students (that is, including those that do not borrow). This is shown below in Figure 4.

    Figure 4: Estimated Median 2023 Debt-to-Income Ratios, College and University Graduates Combined, Class of 2020

    If you’re just dividing indebtedness by income (the blue bars), you get a picture that looks a lot like Figure 2 in debt, because differences in income are pretty small. But if you are looking at debt-to-income ratios across all students (including those that do not borrow) you get a very different picture because as we saw in Figure 1, there are some pretty significant differences in overall borrowing rates. So, for instance, Chinese students go from having the worst debt-to-income ratio on one measure to being middle of the pack on another because they have relatively low incidence of borrowing; similarly, students of Latin American origin go from being middle-of-the-pack to nearly the lowest debt-to-income ratios because they are a lot less likely to borrow than others. Black students end up having among the highest debt-to-income ratios not because they earn significantly less than other graduates, but because both the incidence and amount of their borrowing is relatively high.

    But I think the story to go with here is that while there are differences between ethnic groups in terms of borrowing, debt, and repayment ratios, and that it’s worth trying to do something to narrow them, the difference in these rates is not enormous. Overall, it appears that as a country we are achieving reasonably good things here, with the caveat that if this data were disaggregated by university/ college, the story might not be quite as promising.

    And so ends the first-ever analysis of student debt and repayment by ethnic background. Hope you found it moderately enlightening.

    Source link