To meet the growing demand for multimedia services at the Pattee Library Media Commons, a new location has officially opened in Shields Building on Penn State’s University Park campus.
The Penn State community is invited to an open house from 1 to 4 p.m. on Monday, Nov. 10, at the Shields Media Commons, 22 Shields Building. Attendees may stop by anytime during the event to explore the new space and get hands-on with the technology. Interested participants can add the open house to their calendars from the TLT event page.
The government shutdown may be nearing its end, but the delayed distribution of food assistance funds continues to pose a threat to Americans, including the basic needs security of college students. For now, the future of Supplemental Nutrition Assistance Program funding remains cloudy amid the federal government’s ongoing court battles against releasing the funds.
Nearly three in five college students experience some form of basic needs insecurity, and two in five experience food insecurity, according to national surveys. In addition, approximately 3.3 million college students are eligible for federal food assistance, according to 2020 data, though a large share do not utilize SNAP due to lack of awareness.
Financial insecurity is one of the top threats to student retention and persistence in higher education, meaning a lapse in support may impede some students’ ability to remain enrolled.
Some colleges and universities have established new or expanded measures to plug the gap in food support for students during the shutdown, including expanding the hours of campus food pantries and promoting emergency grant funding.
University of Minnesota
Minnesota administrators announced on Nov. 3 that students affected by the lack of SNAP funds would be able to access one free meal a day in the residential dining hall until benefits resume. The university estimates fewer than 1,000 individuals on campus are enrolled in SNAP.
In addition, the on-campus food pantry, Nutritious U, will offer expanded hours for the rest of the semester, opening one hour earlier to serve more students.
Franklin Pierce University
The New Hampshire–based university provides basic needs resources at several campus locations—including the library, counseling center and the Office of Outreach and Engagement—to ensure students can have access to food and hygiene products.
The pantry, Rations for Ravens, is funded primarily through donations, both monetary and physical products.
City University of New York
CUNY chancellor Félix Matos Rodríguez announced the university system would allocate additional funding to all campuses “so they can stock extra supplies in their on-site food pantries or provide food assistance in other forms,” he wrote in a Nov. 7 email to students. CUNY students can visit any campus pantry in the system, regardless of their home enrollment, allowing them to access those with the most convenient hours and locations.
The chancellor also urged students to apply for SNAP benefits for future assistance; students at the Bronx campuses (Lehman, Hostos and Bronx Community College) can also participate in a pilot program for community-based resources.
Austin Community College
Nearly half of the students at Austin Community College are food insecure, according to fall 2023 survey data. Since the government shutdown, officials have received up to 500 requests a week for emergency aid from the college’s 74,000 students, as reported by The Austin American-Statesman.
The college has pantries on every campus, called River Food Bites, which now have extended hours to meet students’ needs. ACC also allocated $25,000 in emergency funding to purchase gift cards to the H-E-B grocery store, and staff plan to create meal kits to support students over winter break.
Long Beach City College
The California college expanded services at its food pantry locations, called Viking Vaults, by increasing food options and offering food cards to students who have been impacted by suspended SNAP benefits. Students can also apply for emergency aid, and the college outlined a list of FAQs to address their concerns during the shutdown.
University of North Carolina at Chapel Hill
UNC offers a variety of basic needs resources during a typical academic year, some of which have been expanded to meet the current surge in demand.
Undergraduate and graduate students can access any of the six on-campus food pantries or nine gardens around campus to pick up food. Eligible students can also receive a free campus dining meal card through a referral form. In addition, the university is piloting a meal swipe donation program for the end of the term so students can share their unused meals with others.
Students can also receive push notifications of events and other free resources through campus events.
This audio is auto-generated. Please let us know if you have feedback.
More than three dozen higher education organizations, led by the American Council on Education,are urging the Trump administrationto reconsider its plan to require colleges to submit years of new data on applicants and enrolled students, disaggregated by race and sex.
As proposed, the reporting requirements would begin on Dec. 3., giving colleges just 17 weeks to provide extensive new admissions data, ACE President Ted Mitchell wrote in an Oct. 7 public comment. Mitchell argued that isn’t enough time for most colleges to effectively comply and would lead to significant errors.
ACE’s comment came as part of a chorus of higher education groups and colleges panning the proposal. The plan’s public comment period ended Tuesday, drawing over 3,000 responses.
A survey conducted by ACE and the Association for Institutional Research found that 91% of polled college leaders expressed concern about the proposed timeline,and 84% said they didn’t have the resources and staff necessary to collect and process the data.
Delaying new reporting requirements would leave time for necessary trainings and support services to be created, Mitchell said. The Education Department — which has cut about half its staff under President Donald Trump — should also ensure that its help desk is fully crewed to assist colleges during implementation, Mitchell said.
Unreliable and misleading data?
In August, Trumpissued a memo requiring colleges to annually report significantly more admissions data to the National Center for Education Statistics, which oversees the Integrated Postsecondary Education Data System.
The Education Department’s resulting proposal would require colleges to submit six years’ worth of undergraduate and graduate data in the first year of the IPEDS reporting cycle, including information on standardized test scores, parental education level and GPA.
In a Federal Register notice, the Education Department said this information would increase transparency and “help to expose unlawful practices″ at colleges. The initial multi-year data requirement would “establish a baseline of admissions practices” before the U.S. Supreme Court’s 2023 ruling against race-conscious admissions, it said.
But the department’s proposal and comments have caused unease among colleges, higher ed systems and advocacy groups in the sector.
“While we support better data collection that will help students and families make informed decisions regarding postsecondary education, we fear that the new survey component will instead result in unreliable and misleading data that is intended to be used against institutions of higher education,” Mitchell said in the coalition’s public comment.
The wording of the data collection survey — or lack thereof — also raised some red flags.
Mitchell criticized the Trump administration for introducing the plan without including the text of the proposed questions. Without having the actual survey to examine, “determining whether the Department is using ‘effective and efficient’ statistical survey methodology seems unachievable,” he said.
The Education Department said in the Federal Register notice that the additional reporting requirements will likely apply to four-year colleges with selective admissions processes,contending their admissions and scholarships “have an elevated risk of noncompliance with the civil rights laws.”
During the public comment period, the department specifically sought feedback on which types of colleges should be required to submit the new data.
The strain on institutions ‘cannot be overstated’
Several religious colleges voiced concerns about the feasibility of completing the Education Department’s proposed request without additional manpower.
“Meeting the new requirements would necessitate developing new data extracts, coding structures, validation routines, and quality assurance checks — all while maintaining existing reporting obligations,”Ryon Kaopuiki, vice president for enrollment management at the University of Indianapolis, said in a submitted comment.
The religious college’s Office of Institutional Research has just two staff members, Kaopuiki said. The Education Department would not provide additional funding and did not suggest it would offer technical support.
Vanguard University of Southern California, another religious institution, said in a public comment that the new work would fall on just one staff member.
A majority of the college leaders surveyed by ACE and AIR said it would take their institution between 250 to 499 hours of work to comply with the new reporting requirements.The federal proposal estimated that the changes will create over 740,000 hours of additional work across the higher ed sector.
But the National Association of Independent Colleges and Universities said required labor will be much worse.
“The strain this collection will place on institutions cannot be overstated,” NAICU, which signed on to ACE’s letter, said in a separately submitted comment. “The proposal greatly underestimates both the burden and timeframe, particularly for colleges with limited staff, infrastructure, and resources already stretched thin” by other new reporting requirements.
Vanguard and the University of Indianapolis urged the department to delay implementing the new requirements until the 2027–28 collection cycleand to test them via a pilot with volunteer institutions before rolling them out nationally.
The institutions also proposed an exemption for small colleges, though they suggested different enrollment cut-offs — the University of Indianapolis suggested fewer than 750 full-time students, while Vanguard pitched fewer than 3,000.
Other concerns from colleges
The University of Texas System, along with the University of Alabama System and the ACE coalition, raised concerns about student privacy and the feasibility of collecting graduate-level data.
“Graduate admissions are inherently decentralized and vary by program,” Archie Holmes, the Texas system’s executive vice chancellor for academic affairs, wrote in a public comment. “Required data elements such as program-level GPA and test scores are not uniformly collected and may not be directly comparable.”
He recommended that the Education Department focus on undergraduate data until the process has been standardized.
Holmes also flagged that colleges risk inadvertently sharing private student data by disaggregating it so significantly, especially in smaller programs.
The University of Alabama System likewise warned of “significant legal and privacy risks” if the Education Department did not provide “clear federal guidance” on privacy protections.
The presidents of Capella and Strayer universities, two for-profit institutions owned by the same company, asked that the Education Department exclude noncompetitive scholarships from its reporting requirements for colleges that accept all or a “vast majority” of their applicants.
For example, a scholarship “whose only eligibility requirement is student persistence” does not “bear any connection to race” and reporting data on its recipients “would not advance the Department’s goal of detecting or preventing racial discrimination,” they said in a joint comment. But it would add an unnecessary administrative burden for colleges, they said.
From Texas to Florida to Arizona, school voucher policies are reshaping the landscape of American education. The Trump administration champions federal support for voucher expansion, and many state-level leaders are advancing school choice programs. Billions of public dollars are now flowing to private schools, church networks and microeducation platforms.
The push to expand school choice is not just reallocating public funds to private institutions. It is reorganizing the very purpose of schooling. And in that shift, something essential is being lost — the public mission of education as a foundation of democracy.
Civic education is becoming fragmented, underfunded and institutionally weak.
In this moment of sweeping change, as public dollars shift from common institutions to private and alternative schools, the shared civic entities that once supported democratic learning are being diminished or lost entirely — traditional structures like public schools, libraries and community colleges are no longer guaranteed common spaces.
The result is a disjointed system in which students may gain academic content or career preparation but receive little support in learning how to lead with integrity, think across differences or sustain democratic institutions. The very idea of public life is at risk, especially in places where shared experience has been replaced by polarization. We need civic education more than ever.
If we want students who can lead a multiracial democracy, we need schools of every type to take civic formation seriously. That includes religious schools, charter schools and homeschooling networks. The responsibility cannot fall on public schools alone. Civic formation is not an ideological project. It is a democratic one, involving the long-term work of building the skills, habits and values that prepare people to work across differences and take responsibility for shared democratic life.
What we need now is a civic education strategy that matches the scale of the changes reshaping American schooling. This will mean fostering coordinated investment, institutional partnerships and recognition that the stakes are not just academic, they are also democratic.
Americans overwhelmingly support civic instruction. According to a 2020 survey in Texas by the Center of Women in Politics and Public Policy and iCivics, just 49 percent of teachers statewide believed that enough time was being devoted to teaching civics knowledge, and just 23 percent said the same about participatory-democracy skills. This gap is not unique to Texas, but there is little agreement on how civics should be taught, and even less structural support for the schools trying to do it.
Without serious investment, civic formation will remain an afterthought — a patchwork effort disconnected from the design of most educational systems.
This is not an argument against vouchers in principle. Families should have options. But in the move to decentralize education, we risk hollowing out its civic core. A democratic society cannot survive on academic content alone. It requires citizens — not just in the legal sense, but in the civic one.
A democratic society needs people who can deliberate, organize, collaborate and build a shared future with others who do not think or live like they do.
And that’s why we are building a framework in Texas that others can adopt and adapt to their own civic mission.
The pioneering Democracy Schools model, to which I contribute, supports civic formation across a range of public and private schools, colleges, community organizations and professional networks.
Civic infrastructure is the term we use to describe our approach: the design of relationships, institutions and systems that hold democracy together. Just as engineers build physical infrastructure, educators and civic leaders must build civic infrastructure by working with communities, not for or on them.
We start from a democratic tradition rooted in the Black freedom struggle. Freedom, in this view, is not just protection from domination. It is the capacity to act, build and see oneself reflected in the world. This view of citizenship demands more than voice. It calls for the ability to shape institutions, policies and public narratives from the ground up.
The model speaks to a national crisis: the erosion of shared civic space in education. It must be practiced and must be supported by institutions that understand their role in building public life. Historically Black colleges and universities like Huston-Tillotson University offer a powerful example. They are not elite pipelines disconnected from everyday life. They are rooted in community, oriented toward public leadership and shaped by a history of democratic struggle. They show what it looks like to educate for civic capacity — not just for upward mobility. They remind us that education is not only about what students know, but about who they become and what kind of world they are prepared to help shape.
Our national future depends on how well we prepare young people to take responsibility for shared institutions and pluralistic public life. This cannot be accomplished through content standards alone. It requires civic ecosystems designed to cultivate public authorship.
We have an enormous stake in preparing the next generation for the demands of democratic life. What kind of society are we preparing young people to lead? The answer will not come from any single institution. It will come from partnerships across sectors, aligned in purpose even if diverse in approach.
We are eager to collaborate with any organization — public, private or faith-based — committed to building the civic infrastructure that sustains our democracy. Wherever education takes place, civic formation must remain a central concern.
Robert Ceresa is the founding director of the Politics Lab of the James L. Farmer House, Huston-Tillotson University.
The Hechinger Report provides in-depth, fact-based, unbiased reporting on education that is free to all readers. But that doesn’t mean it’s free to produce. Our work keeps educators and the public informed about pressing issues at schools and on campuses throughout the country. We tell the whole story, even when the details are inconvenient. Help us keep doing that.
In an age defined by digital transformation, access to reliable, high-speed internet is not a luxury; it is the bedrock of opportunity. It impacts the school classroom, the doctor’s office, the town square and the job market.
As we stand on the cusp of a workforce revolution driven by the “arrival technology” of artificial intelligence, high-speed internet access has become the critical determinant of our nation’s economic future. Yet, for millions of Americans, this essential connection remains out of reach.
This digital divide is a persistent crisis that deepens societal inequities, and we must rally around one of the most effective tools we have to combat it: the Universal Service Fund. The USF is a long-standing national commitment built on a foundation of bipartisan support and born from the principle that every American, regardless of their location or income, deserves access to communications services.
Without this essential program, over 54 million students, 16,000 healthcare providers and 7.5 million high-need subscribers would lose internet service that connects classrooms, rural communities (including their hospitals) and libraries to the internet.
The discussion about the future of USF has reached a critical juncture: Which communities will have access to USF, how it will be funded and whether equitable access to connectivity will continue to be a priority will soon be decided.
Earlier this year, the Supreme Court found the USF’s infrastructure to be constitutional — and a backbone for access and opportunity in this country. Congress recently took a significant next step by relaunching a bicameral, bipartisan working group devoted to overhauling the fund. Now they are actively seeking input from stakeholders on how to best modernize this vital program for the future, and they need our input.
I’m urging everyone who cares about digital equity to make their voices heard. The window for our input in support of this vital connectivity infrastructure is open through September 15.
While Universal Service may appear as only a small fee on our monthly phone bills, its impact is monumental. The fund powers critical programs that form a lifeline for our nation’s most vital institutions and vulnerable populations. The USF helps thousands of schools and libraries obtain affordable internet — including the school I founded in downtown Brooklyn. For students in rural towns, the E-Rate program, funded by the USF, allows access to the same online educational resources as those available to students in major cities. In schools all over the country, the USF helps foster digital literacy, supports coding clubs and enables students to complete homework online.
By wiring our classrooms and libraries, we are investing in the next generation of innovators.
The coming waves of technological change — including the widespread adoption of AI — threaten to make the digital divide an unbridgeable economic chasm. Those on the wrong side of this divide experienced profound disadvantages during the pandemic. To get connected, students at my school ended up doing homework in fast-food parking lots. Entire communities lost vital connections to knowledge and opportunity when libraries closed.
But that was just a preview of the digital struggle. This time, we have to fight to protect the future of this investment in our nation’s vital infrastructure to ensure that the rising wave of AI jobs, opportunities and tools is accessible to all.
AI is rapidly becoming a fundamental tool for the American workforce and in the classroom. AI tools require robust bandwidth to process data, connect to cloud platforms and function effectively.
The student of tomorrow will rely on AI as a personalized tutor that enhances teacher-led classroom instruction, explains complex concepts and supports their homework. AI will also power the future of work for farmers, mechanics and engineers.
Without access to AI, entire communities and segments of the workforce will be locked out. We will create a new class of “AI have-nots,” unable to leverage the technology designed to propel our economy forward.
The ability to participate in this new economy, to upskill and reskill for the jobs of tomorrow, is entirely dependent on the one thing the USF is designed to provide: reliable connectivity.
The USF is also critical for rural health care by supporting providers’ internet access and making telehealth available in many communities. It makes internet service affordable for low-income households through its Lifeline program and the Connect America Fund, which promotes the construction of broadband infrastructure in rural areas.
The USF is more than a funding mechanism; it is a statement of our values and a strategic economic necessity. It reflects our collective agreement that a child’s future shouldn’t be limited by their school’s internet connection, that a patient’s health outcome shouldn’t depend on their zip code and that every American worker deserves the ability to harness new technology for their career.
With Congress actively debating the future of the fund, now is the time to rally. We must engage in this process, call on our policymakers to champion a modernized and sustainably funded USF and recognize it not as a cost, but as an essential investment in a prosperous, competitive and flourishing America.
Erin Mote is the CEO and founder of InnovateEDU, a nonprofit that aims to catalyze education transformation by bridging gaps in data, policy, practice and research.
The Hechinger Report provides in-depth, fact-based, unbiased reporting on education that is free to all readers. But that doesn’t mean it’s free to produce. Our work keeps educators and the public informed about pressing issues at schools and on campuses throughout the country. We tell the whole story, even when the details are inconvenient. Help us keep doing that.
State legislators from both parties want to expand family child care — the home-based sector of licensed child care, which has shrunk by more than a third since 2018. Both the House and Senate budget proposals include pilots to open new programs to meet the needs of families and employers.
For the past two years, a team from the nonprofit Southwestern Child Development Commission (SWCDC) has done just that, creating North Carolina’s first statewide system of support for family child care. In the past year, the organization has helped launch 27 new family child care programs, 20 of which are open, creating at least 160 new slots for children. Two are the first family child care programs in their counties.
Since September 2023, the team has awarded start-up grants to another 26 programs and business sustainability grants to 38 programs. It has created the first statewide family child care mentorship program, regional communities of practice, and a marketing campaign that has garnered interest from more than 200 prospective providers since April.
As state leaders ask how to improve child care access and affordability, the project’s lessons should carry forward, said Daniel Bates, the statewide project’s manager.
“I just really felt like we’ve done something here, and I hope that, no matter what, it still continues, because family child care is so incredibly important,” Bates said. “And they are part of early childhood education.”
‘People that will be around for a while’
Expanding family child care takes one-on-one support for new providers who often bring a passion for children but little knowledge of the complex regulations and business challenges that come with starting and operating a program, the project leaders said. It also requires funding.
In 2024, SWCDC, a nonprofit focused on early care and education based in western North Carolina, was awarded $525,000 from the Division of Child Development and Early Education (DCDEE) from legislative pilot funding to expand access to family child care. The project’s expected output was to help 18 programs get started. Instead, it has helped launch 27 programs by awarding grants to cover start-up costs.
The grants ranged from $5,000 to $20,000 depending on the providers’ needs and the strategic goals of the project. The average grant was about $13,000.
Providers also spent their own money to open their programs outside of the grants. A survey of some of the providers found that most had spent between $1,000 and $5,000 before receiving grants to prepare their homes and buy materials.
The new providers are in 19 counties. In Alleghany and Montgomery counties, grant recipients will be the only family child care providers in their counties. Two providers speak Spanish fluently, according to the project leaders. At least 18 have college degrees. Four of the new providers were under 30 years old. Six were in their 30s; 10 were in their 40s.
“These are people that will be around for a while,” said Vickie Ansley, SWCDC’s Child Care Resource & Referral (CCR&R) regional programs manager and family child care in-home program activity coordinator.
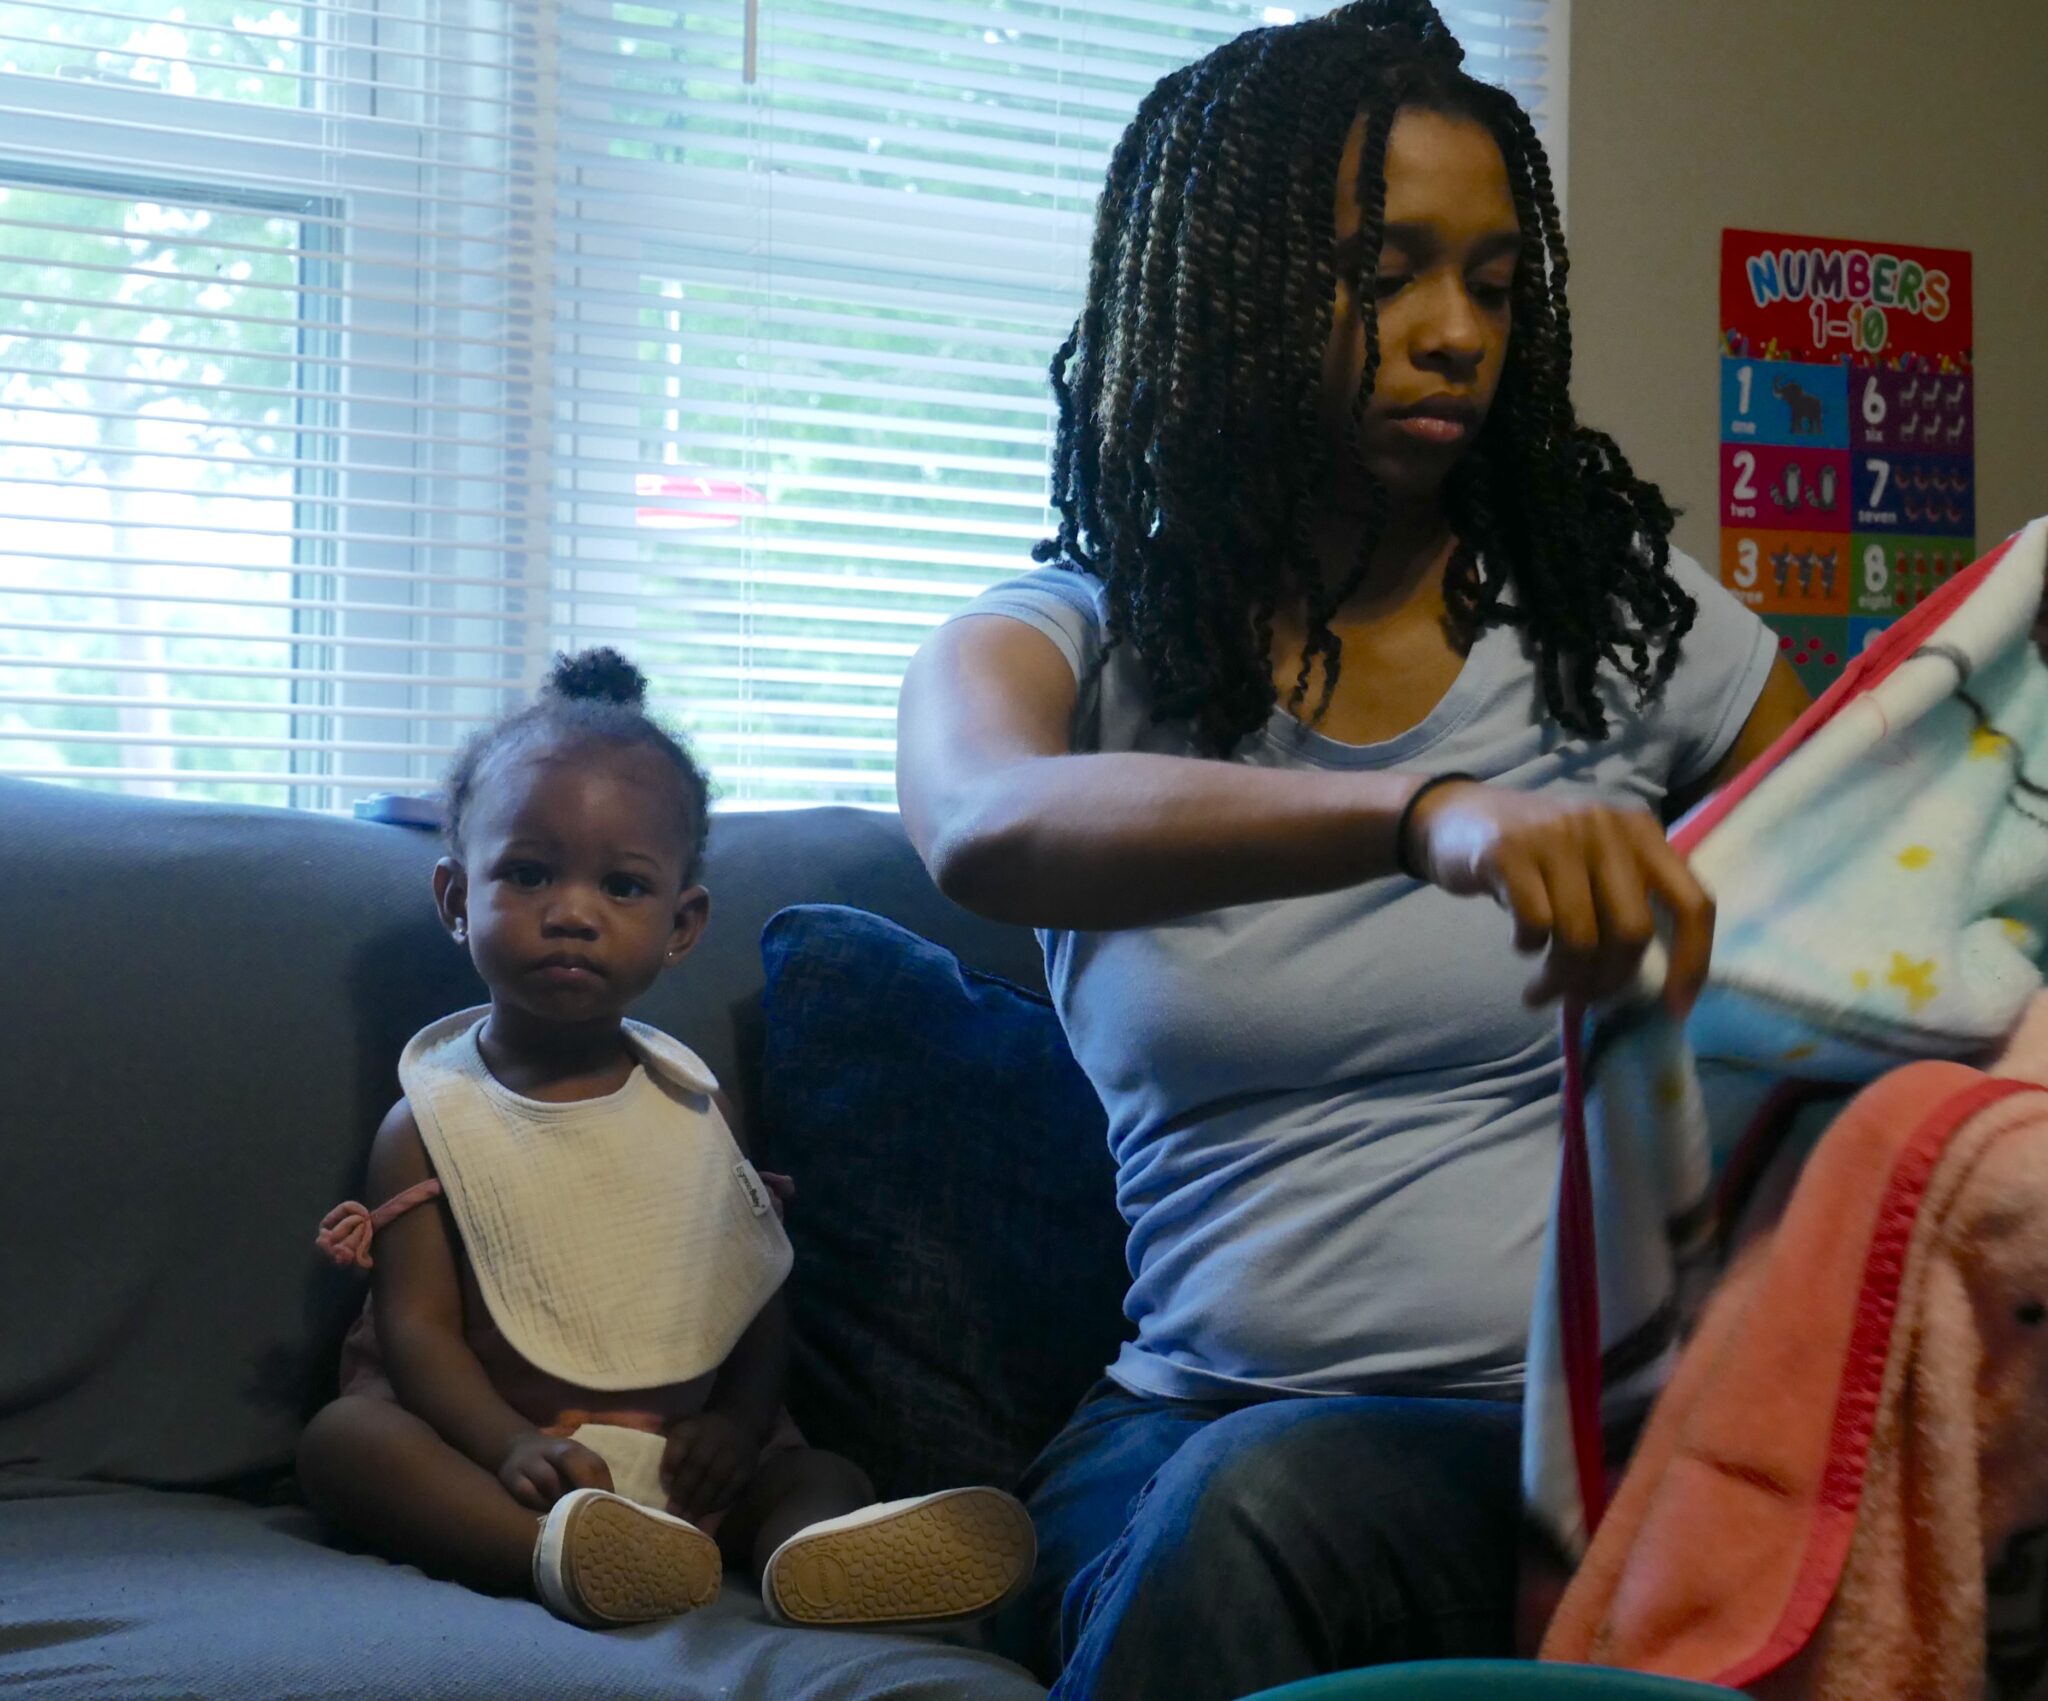
Danielle Dixon wakes up students from nap time at Helen Cole’s Day Care. (Liz Bell/EducationNC)
That grant funding was layered onto a larger statewide family child care project the organization has been leading since February 2023 through a separate $3 million contract with DCDEE from the CCDF, the federal funding stream that helps states raise the quality of child care and helps working families afford it.
The statewide project had many components, including start-up grants of up to $10,000 and business grants of up to $5,000 for access to business training, software, or devices to manage programs. It provided 64 professional development workshops to providers on a range of issues. It also created a framework for family child care substitute pools and a database of zoning contacts and information.
Hands-on support from regional consultants
The crux of the project, however, was all about hands-on support and community building, the project leaders said. The project funded 17 family child care consultants who reached 477 providers in 73 counties with coaching and consultation.
The consultants, trained in the specifics of owning and operating a family child care program, were embedded in the 14 regional CCR&R hubs covering all 100 counties.
“We’re talking about people located in those communities,” Ansley said. “They know the (providers), or they know somebody who knows them.”
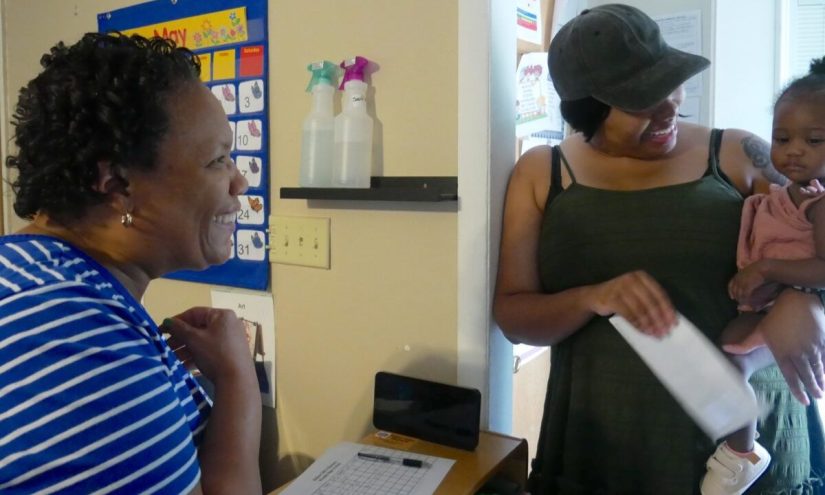
Helen Cole, a family child care provider in Taylortown, says the grants she received from Southwestern Child Development Commission helped her buy high-quality materials. (Liz Bell/EducationNC)
The PDG contract is in process but will be awarded to Acelero Charitable Foundation “in collaboration with multiple agencies that support family child care.” It will focus on increasing quality and family engagement, the spokesperson said.
DCDEE employs licensing consultants who meet with all types of potential child care owners to begin the licensure process. The licensing consultants began recommending reaching out to the regional family child care consultants to new providers.
The family child care consultants then could provide knowledge specific to family child care, dedicate time and energy to decipher the complexities of starting and sustaining a business, and offer support that was independent from regulatory oversight and compliance. Some of the consultants were former family child care providers themselves.
“Prior to that, if an agency had capacity, then they provided support,” Bates said. “The services were somewhat limited, whereas this was full 100% dedication for family child care.”
The regional consultants received business training to advise providers on budget planning, financial reports, marketing, and recruiting and retaining staff.
Kathleen Hoffler, a regional consultant at the Partnership for Children of Cumberland County who once owned a family child care home, described the role as her “dream job.”
Hoffler said she has helped providers take better care of their businesses, their children, and themselves. She encouraged providers to take time off and to reach out for help.
“If you’re having issues with enrollment, if you’re having issues with collecting payments from parents, if you’re having behavior issues with kids or you’re worried that one of your kids might need some developmental screening, and you don’t have anybody to talk that out with, it’s real easy to get discouraged and possibly decide it’s not for you and you’re going to close your program,” Hoffler said.
The family child care consultants connected providers to the pilot grant opportunities and helped them budget what they needed and how they should spend the funding.
Since the consultants were embedded in CCR&R agencies, they could connect providers with a variety of professional development opportunities and resources.
And they connected providers to mentors — seasoned family child care providers who provided a listening ear and advice on overcoming obstacles — and to communities of practice, regional teams that met to share ideas and support one another.
Annette Anderson-Samuels, owner of Phenomenal Kids Child Care Services, a family child care home in Kings Mountain, was one of those mentors. She said her advice to two new providers on how to advertise their programs kept them from closing. She recently helped a provider navigate a tough conversation with parents who were not following her policies.
“It’s to help each other become better at what we do as child care providers,” Anderson-Samuels said.
There were 22 mentors and 44 mentees across the state. In his decades working in early childhood, Bates said the group has been a standout.
“They’ve crossed county lines to go help each other in person,” he said. “The interest and the willingness, wanting to improve themselves, is really out there if they have the opportunity to do that.”
‘The lost segment of early childhood education’
The number of family child care programs, child care businesses within a residence, has fallen by about 36% since 2018, compared with an overall 15% decline in all types of licensed child care.
As a generation of providers age out of the work, a lack of awareness, funding, and support — along with increased regulation — has kept new providers from entering the field, project leaders said.
The team was intentional about listening to providers’ experiences and needs before developing a system of support.
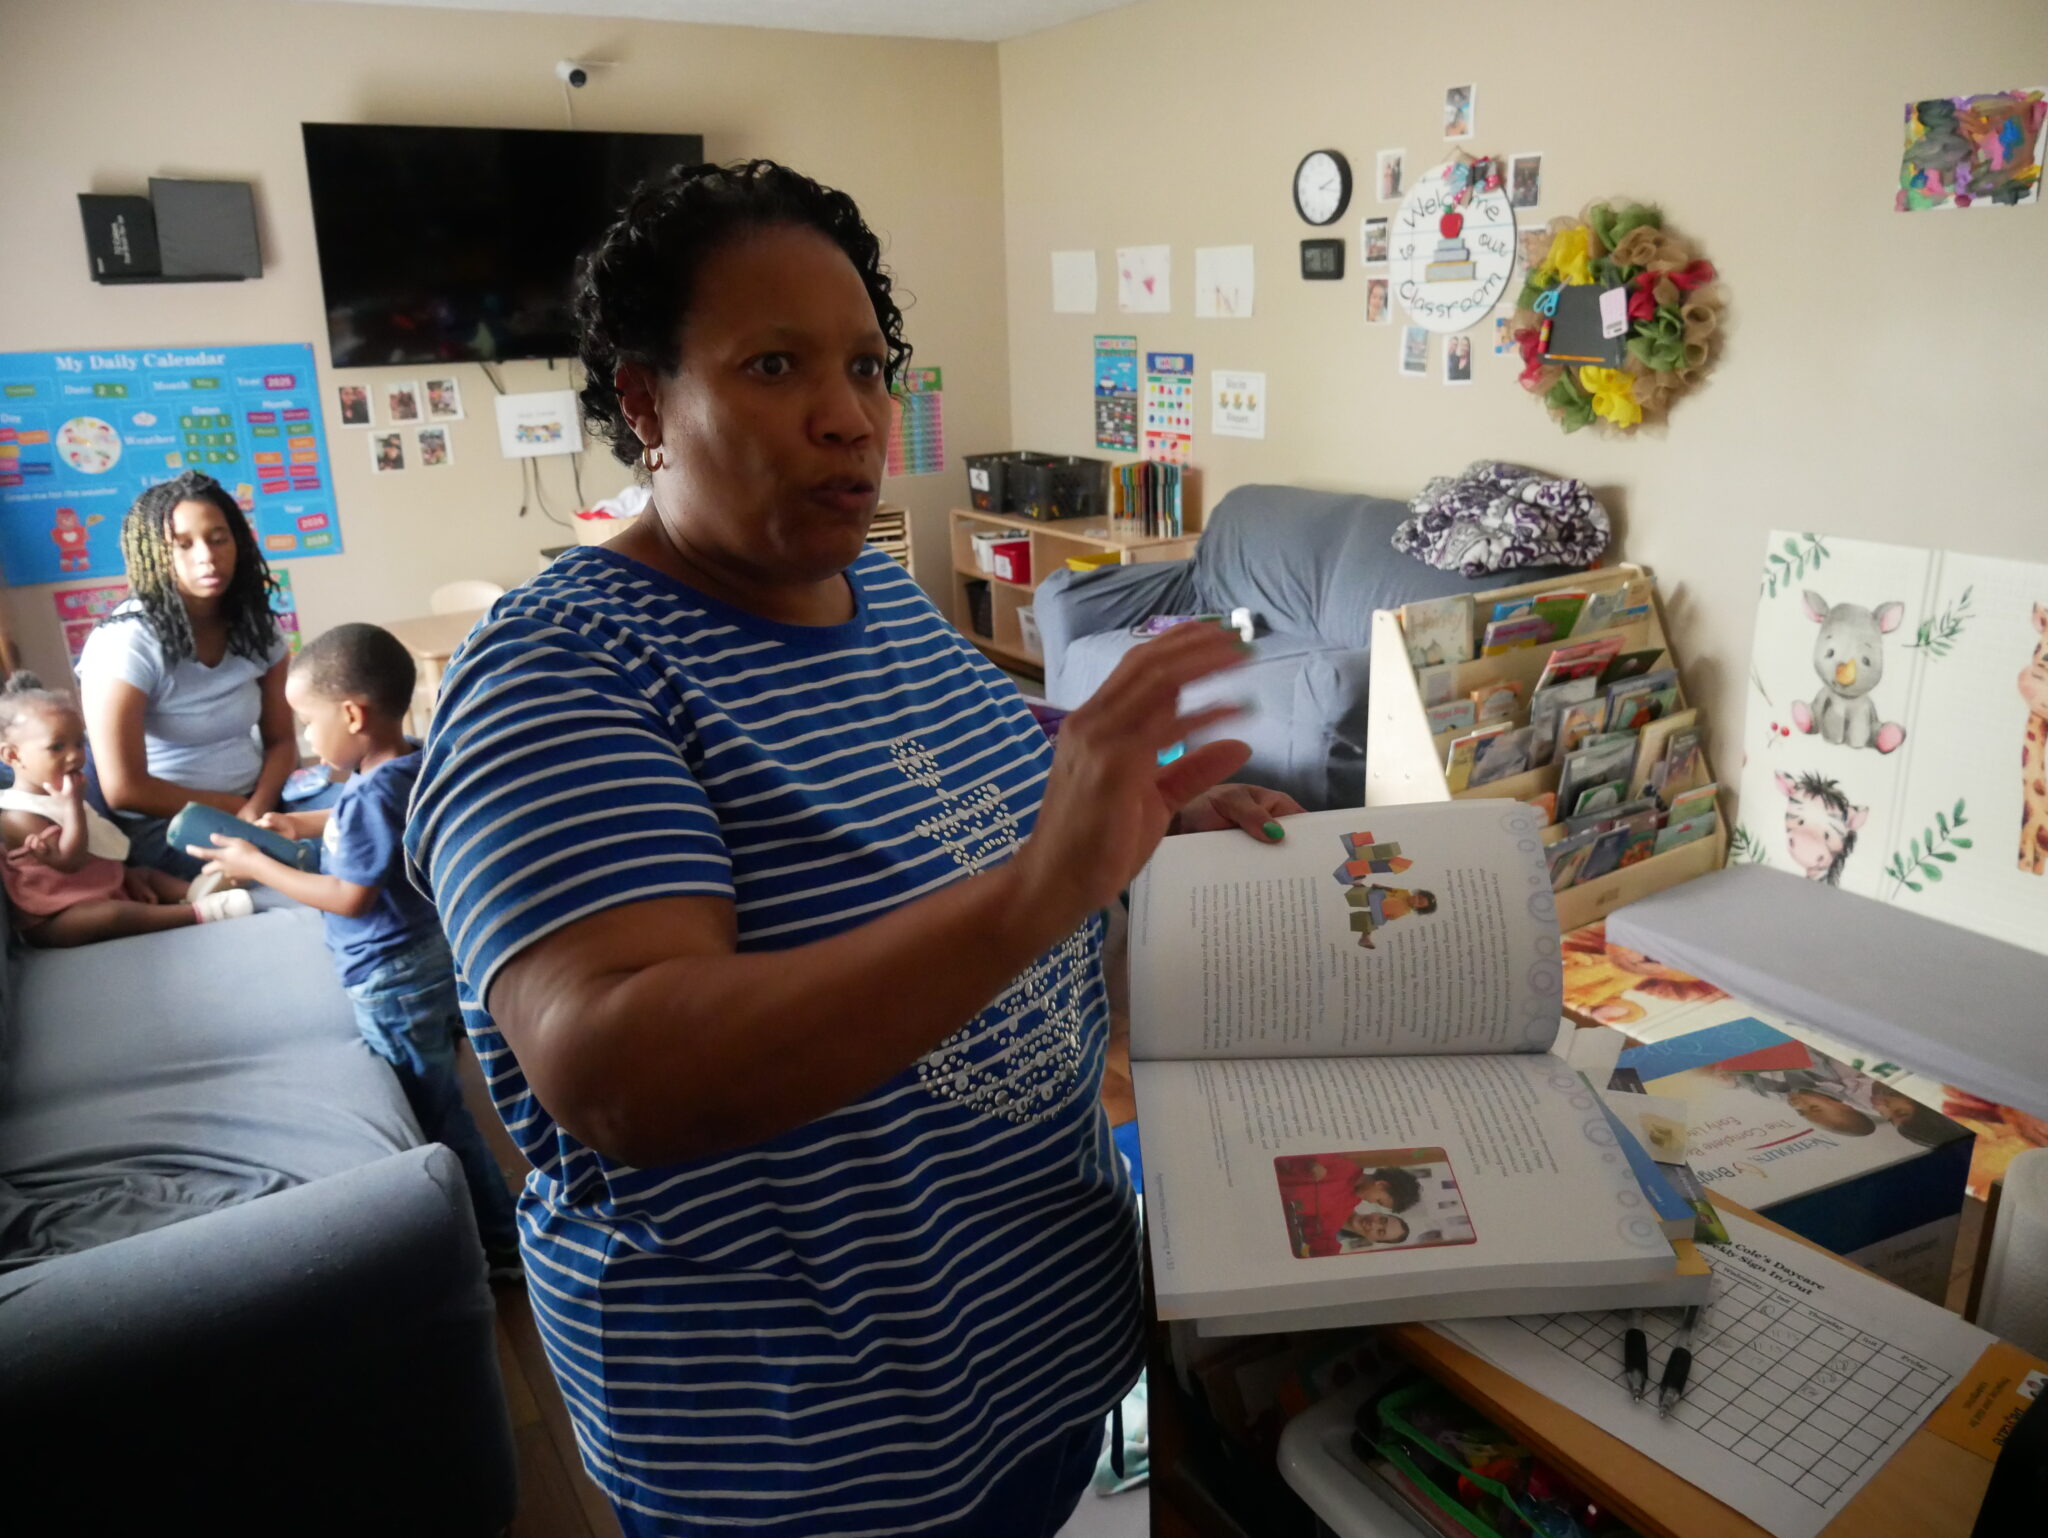
Helen Cole said her family child care home has better equipment and provides higher-quality care because of the support she received from the Southwestern Child Development Commission’s family child care projects. (Liz Bell/EducationNC)
Many brought up the low rates that family child care providers receive per child to participate in the state’s subsidy program. These rates, the state has found, do not cover the full cost of providing child care in any setting. Home-based programs receive lower amounts per child than centers. And providers in rural and low-income areas often receive lower rates than those in higher-income counties.
In rural areas where market rates are lower, “even though we need family child care in those communities desperately, market rates are a hindrance,” said Lori Jones-Ruff, SWCDC’s regional programs manager.
Jones-Ruff also sits on Gov. Josh Stein’s Task Force on Child Care and Early Education, where members have discussed the need for higher subsidy rates and a statewide floor rate that would level the playing field among counties. Research has shown the geographic disparities are wider than place-based differences in cost.
“That’s not just a center issue,” she said. “It’s for family child care as well.”
Low funding from public sources and private tuition leads to low compensation for family child care professionals. The median wage for home-based providers in 2023 was $10.20.
The team also heard about obstacles due to HOA rules and zoning regulations. They found that local ordinances were putting up barriers to new programs in some places. Septic tank requirements were among the most common and most expensive problems.
“(Providers) have recognized, ‘I don’t really need to run to Raleigh; some of the challenges I have are really just in my own backyard, and I just need to talk to my town or county,’” Bates said.
The team heard about the isolation many providers feel, being alone in their homes all day without a network to air ideas or lean on when challenges arise. Providers said they did not feel respected or supported by the state.
“Historically, there was a huge emphasis put on center-based care in North Carolina,” Jones-Ruff said. “Homes did not feel that they were as valued and as supported as center-based. And so there was a period of time where they really felt like they were kind of the lost segment of early childhood education in North Carolina.”
So the team built a strategy based on both funding and relationships.
‘Like a prayer answered’
For Helen Cole, that assistance and funding was key to opening her family child care home in Taylortown in Moore County.
“I just feel like this wouldn’t have been possible without the support and the funds,” said Cole, who recently earned her four-star license to care for children from infancy to 12 years old at Helen Cole’s Day Care.
She received more than $17,000 to start her program from the legislative pilot funding. She bought new outside equipment, furniture, dramatic play sets, age-appropriate toys and books, a new kitchen faucet, a state-approved curriculum, and a new laptop.
Cole heard about the potential grant funding for start-up costs from the state licensing consultant. She was also connected with Hoffler.
Students at Helen Cole’s program work on their counting skills. (Liz Bell/EducationNC)
Cole was excited to open after hearing about a local demand for second-shift care. After retiring as a substitute teacher in her local school district, she needed more income and was eager to fill a community need.
But after her initial meeting with a licensing consultant, she received a long checklist of everything she had to do. She said she felt overwhelmed.
“It was just so much information,” she said. “There are things on the website, but how do you adjust it for your day care?”
Plus, Cole had experience helping in her sister’s child care program, but she did not know the ins and outs of operating a small business. Even with a background in accounting, she knew the role would be challenging. So she reached out to Hoffler for an in-person meeting.
“It was like a prayer answered,” Cole said. “She broke it down for me.”
Hoffler helped Cole navigate the tough decisions that come with operating a business from your home, such as how much living space she was willing to sacrifice and what renovations were needed. And she helped Cole create a budget to apply for grant funding through the legislative pilot. She gave her ideas on high-quality and age-appropriate materials.
She also connected Cole with a mentor, helped her with business skills, and connected her with other resources through the Smart Start partnership.
Hoffler has helped her advertise her program and hold on through the ups and downs of enrollment, Cole said. Because she needed to hire another teacher, her niece Danielle Dixon, Cole said she is breaking even but has not started making a profit or been able to pay herself. She said she has been advised that it can take nine months to a year.
She said low subsidy rates and parents’ inability to afford her private rates have also been financially challenging. She serves one student whose parents are both working, making too much to qualify for a subsidy, but cannot afford her private rate of $200 per week. She only charges that family $85 per week.
Danielle Dixon, a teacher at Helen Cole’s Day Care, has worked in child care for 11 years. (Liz Bell/EducationNC)
Dixon, who has been working in child care professionally for 11 years but informally since she was 16 years old, has both of her children enrolled at the program. Dixon said her grandmother and mother, as well as three of her aunts, have worked in child care. She decided to partner with her aunt, Cole, to return to working with young children in a creative, exploratory environment after working in public schools.
Helen Cole’s Day Care opened in December in the home she was raised in, and where her mother used to take care of children whose parents were at risk of losing custody.
“All of our lives, we’ve had other children here,” Cole said.
Both Dixon and Hoffler have helped Cole strengthen her understanding and practice of early childhood care and education. Her program’s philosophy is based on relationships, exploration, and emotional and social development. Then academic foundations are added.
“It’s that give and take between you and this child,” Hoffler said. “They’re going to learn more from you if you are actively engaging with them and talking to them throughout the day, than they’ll ever learn if you give them a coloring sheet and try to teach them how to stay in the lines. There are no lines in early childhood.”
“That was a wow moment,” Cole said. “I understand that we have to have a curriculum, and we do, but the biggest thing is for them to develop on their own.”
It is this one-on-one attention and intimate environment that make family child care appeal to so many parents. Rural children, low-income children, and children of color are more likely to access home-based care than center-based, according to national advocacy and research group Home Grown. It is often more affordable, more convenient and flexible for nontraditional working hours, and more culturally and linguistically relevant to diverse families.
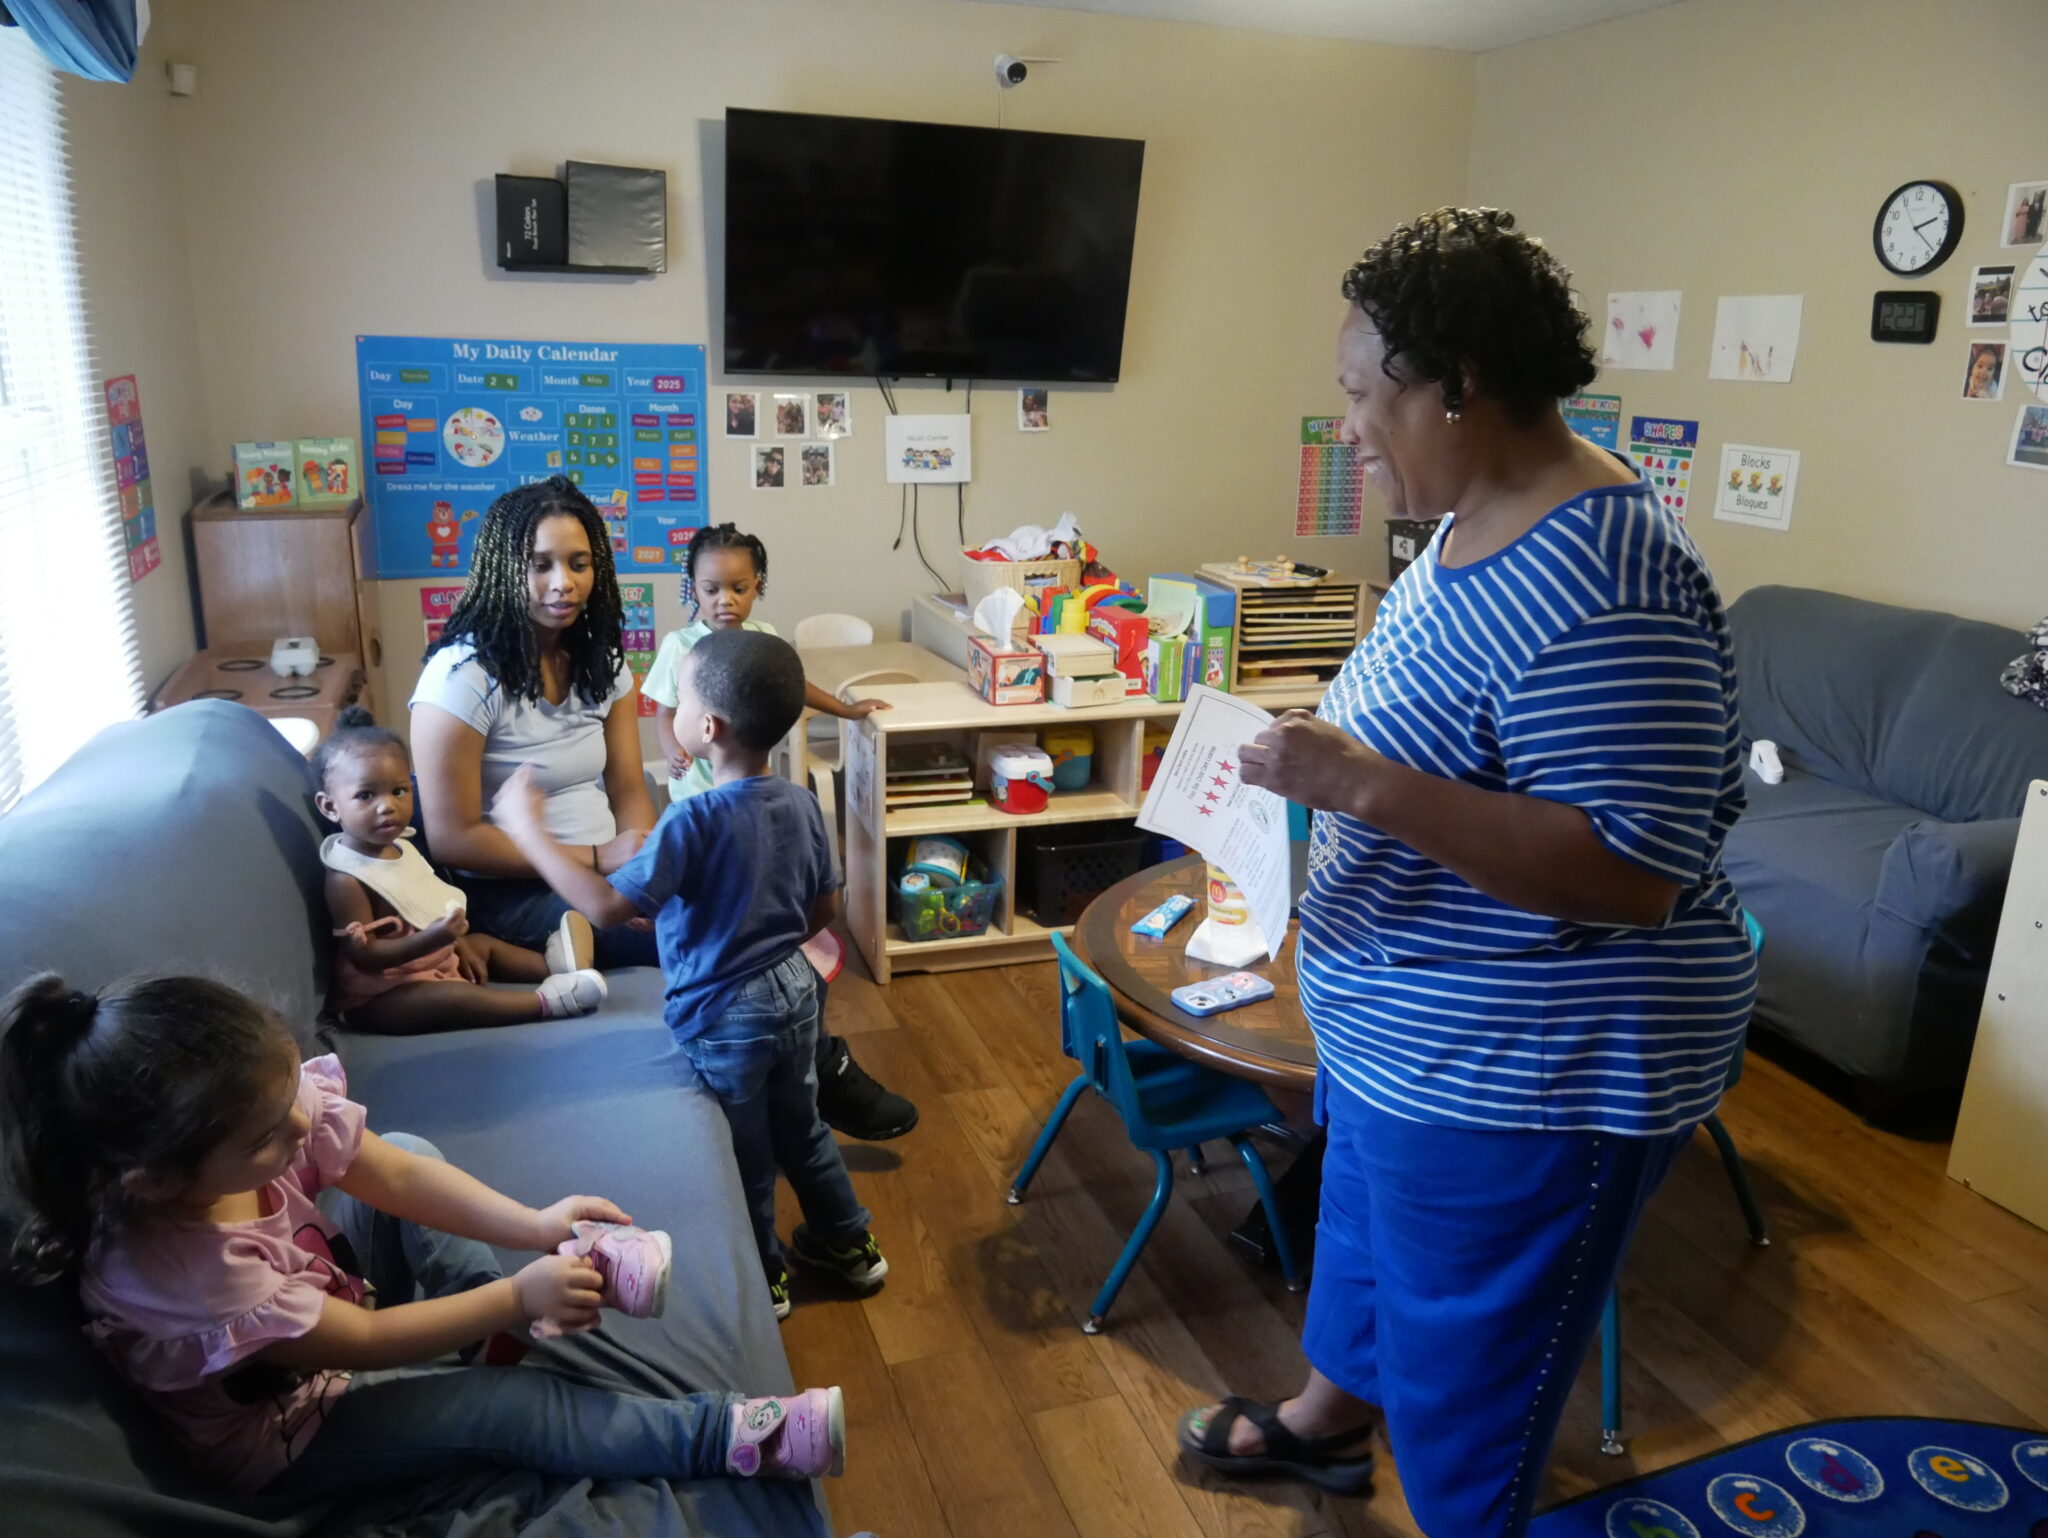
Inside Helen Cole’s child care program. (Liz Bell/EducationNC)
Kailyn Green, whose daughter has been at the program for a month, said she toured other programs with open spots but they “didn’t feel right.” Then she visited Cole’s program and did a walk-through.
“I was like, ‘I’m sold. I’m good,’” Green said.
A licensed clinical social worker, Green said she has been able to return to work without worrying. She receives texts and videos of her daughter’s days and has been impressed by how much she has progressed, especially with eating more consistently.
“I love that she truly gets the attention,” she said. “She’s been able to form a relationship with her. It’s been great.”
Hoffler said she was excited to hear about Cole’s recent accomplishment: earning four out of five stars on the state’s quality rating scale.
“I’m just so proud of her,” she said. “She handled it like a pro.”
What’s next?
There are multiple efforts to build different kinds of supports for family child care. DCDEE said the project with SWCDC taught them that “Family Child Care Homes (FCCHs) would benefit from additional funding, continued community engagement, and professional development to improve quality,” according to a DCDEE spokesperson.
“FCCHs are a vital part of our state’s early care and learning network, and DCDEE is committed to continuing our support for these small businesses,” the spokesperson said in an emailed statement.
Though the contract for the statewide project ends on June 30, the spokesperson said the division will continue using CCDF funds and federal funds from the Preschool Development Grant (PDG) Birth through Five to provide business technical assistance and other services to family child care programs.
The PDG contract is in process but will be awarded to Acelero Charitable Foundation “in collaboration with multiple agencies that support family child care.” It will focus on increasing quality and family engagement, the spokesperson said.
DCDEE is also contracting with Frank Porter Graham Child Development Institute at UNC-Chapel Hill to provide evaluation and coordination of the PDG Elevate FCCH project, which will provide extra subsidy funding to family child care programs to increase wages for providers.
The House and Senate budget proposals direct DCDEE to use CCDF funds to expand family child care capacity. The House would allocate $7 million over two years for a pilot in three localities, and the Senate would allocate $6 million for a pilot in Alamance, Harnett, and Johnston counties. The funding would go to councils of governments in each of those counties to select a third-party vendor. Both proposals have specific requirements for the chosen vendor, including experience in establishing family child care homes in at least three other states and rural areas, experience in operating a substitute pool in another state, and technology that connects families with providers and includes billing and coaching functions.
Meanwhile, Jones-Ruff said SWCDC will continue supporting family child care by retaining a statewide team with organizational funding — and will seek outside funding to continue other aspects of the project. Some of the family child care consultants will continue their work through local CCR&R or Smart Start funding.
“I can see just the monumental amount of work and the progress that has happened in such a short amount of time,” she said. “We’re not going away.”
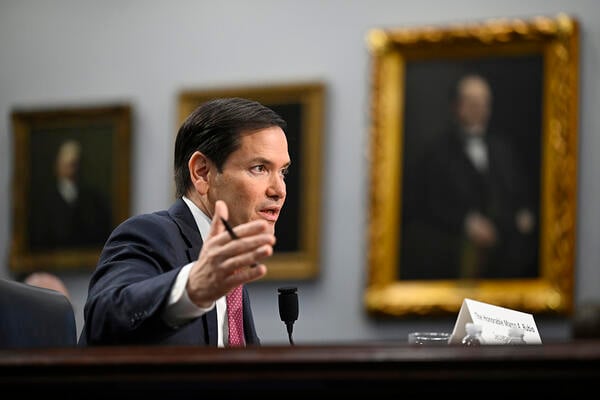
The plans to expand social media screening, first reported by Politico, were outlined in a memo sent by Secretary of State Marco Rubio.
John McDonnell/Getty Images
The Trump administration is planning to implement a policy that would require all student visa applicants to undergo social media vetting, according to a cable sent by Secretary of State Marco Rubio, Politico reported Tuesday. All new student visa interviews have been paused in preparation for the new policy.
“The Department is conducting a review of existing operations and process for screening and vetting of student and exchange visitor (F, M, J) visa applicants, and based on that review, plans to issue guidance on expanded social media vetting for all such applicants,” the memo reads, according to a copy published in full on social media by independent journalist Marisa Kabas.
The planned changes come amid the federal government’s ongoing attacks on student visa holders, which began in March with the detention of multiple students and recent graduates who had been involved in pro-Palestinian protests on their campuses. Shortly after, the administration terminated thousands of student visa holders’ records in the Student Exchange and Visitor Information System, the database the houses international students’ records, leading to a slew of legal actions from students who feared they wouldn’t be able to continue studying in the U.S.
Most recently, the Trump administration announced last week that it would prohibit Harvard University from enrolling international students as punishment for allegedly failing to prevent antisemitism and harassment on campus during last year’s pro-Palestinian encampments. Though that action was quickly blocked by a judge, the move could be devastating for the Ivy League institution, where international students make up more than a quarter of the student body.
The proposed policy would increase the amount of time, manpower and resources required to process visa applications, according to experts.
Faye Kolly, an immigration attorney based in Texas, noted that it’s not unusual for immigration officials to review visa applicants’ social media profiles, which they are required to list on certain immigration forms. But the administration has begun specifically screening the social media accounts of some returning students with visas who had participated in pro-Palestinian campus protests, though Politico reported that State Department officials had found the guidance on how to complete those screenings vague.
It is not clear how this expanded vetting process will unfold; Rubio included no details in the memo, which said further guidance would be disseminated in the coming days. Though the memo didn’t say as much, Kolly predicted that the extra screening will involve looking “at [applicants’] social media handles more closely for what I’m assuming is going to be speech that could be considered either anti-Israel or pro-Gaza.”
International education advocates have sounded the alarm on the proposed policy, arguing that it limits prospective students’ right to free expression and illustrates the Trump administration’s devaluation and distrust of international students.
Fanta Aw, the CEO of NAFSA, an association for international educators, told Politico, “The idea that the embassies have the time, the capacity and taxpayer dollars are being spent this way is very problematic. International students are not a threat to this country. If anything, they’re an incredible asset to this country.”
Kolly told Inside Higher Ed that the move harks back to the SEVIS terminations in March and April. Both actions, she said, indicate the administration’s lack “of nuance … regarding international students. It’s [taking] a simplistic approach to a very complex issue. When you target international students en masse, it’s irresponsible.”
Daryl Bish, the president of EnglishUSA, which represents all English language programs in the country, said the change will reverse recent progress on the visa approval process and have an “immediate impact” on enrollment in English language programs.
“The extraordinary decision to pause visa interviews, under the guise of security and enhanced vetting, is a dangerous precedent that will have immediate short-term consequences,” Bish said. “Visa appointment wait times have, generally, improved since the pandemic. This means that many students apply for the visa close to their program start date. The pause in interviews, if protracted, will force these students to change their plans.”
Elora Mukherjee, a law professor at Columbia University and the director of the law school’s Immigrants’ Rights Clinic, also criticized the government for pausing new student visa interviews in the interim—especially as the memo gave no indication of how long the pause might last.
“The pause is destructive to our national interests and America’s reputation in the world, and its effects may be felt for years. It has thrown the lives of tens of thousands of prospective international students into turmoil and will cause chaos and disruption at colleges and universities across the country. International students have been preparing for months to join U.S. colleges and universities in the fall, and schools have been preparing to welcome them,” she wrote in an email to Inside Higher Ed.
“It is unclear how long the ‘pause’ will be in place, what heightened scrutiny visa applicants will face once the pause is lifted, and the extent to which decisions about granting visas may be tainted by prejudices based on race, religion, and national origin.”
The expansion of government powers would hand Immigration and Customs Enforcement (ICE) the authority to cancel a student’s legal status if the visa they used to enter the US is revoked.
Previously, a visa revocation would only impact a person’s ability to return to the country but would not end their permission to stay in the US as a student.
The new guidelines were outlined in an ICE document shared in a court filing on April 28, according to Associated Press.
Attorneys for international students said in court the new reasons would allow for faster deportations and would justify many of the Trump administration’s terminations of thousands of students’ legal status on the database maintained by ICE.
“This just gave them carte blanche to have the State Department revoke a visa and then deport those students, even if they’ve done nothing wrong,” said immigration attorney Brad Banias, as reported in AP.
When approached for comment, a State Department spokesperson said it “will continue to work closely with the Department of Homeland Security to enforce zero tolerance for aliens in the United States who violate US laws, threaten public safety, or in other situations where warranted”.
The PIE is yet to hear back from ICE.
This just gave them carte blanche to have the State Department revoke a visa and then deport those students, even if they’ve done nothing wrong
Brad Banias, immigration attorney
Sector leaders welcomed last week’s news that the government was restoring students’ legal status while it developed a new framework for future terminations, though the proposed vastly expanded new powers come as another blow for international students and educators.
The court heard that the new policy went against “at least 15 years of SEVP guidance”, referring to the Student and Exchange Visitor Program managed by ICE.
However, NAFSA emphasised on May 2 that “the document cannot yet be regarded as ICE’s new official policy”.
The document offers two new reasons for termination; non-compliance with the terms of nonimmigrant status and visa revocation by the state department.
In the case of the former, it is not clear whether a SEVIS record termination would also result in the termination of nonimmigrant status, though it would strip students of status benefits including applying for OPT or returning to the US after travelling abroad.
According to immigration attorneys, the new guidance could also allow for revoking student status if their names appear in a criminal database regardless of whether they were ever charged with a crime.
Traditionally, student visa revocations have not been common, but recently the US government began terminating students’ status either in addition to or instead of revoking their visas.
The Student and Exchange Visitor Information System (SEVIS) database is maintained by ICE to monitor international students’ presence in the US.
In the absence of disaggregated counts of visa revocation and SEVIS record termination, it remains unclear how many students will lose their status because of the new termination framework.
Since mid-March, sudden visa revocations by the State Department and SEVIS record terminations by ICE and DHS have caused widespread fear and uncertainty across US campuses.
“Exacerbating the stress was the rationale provided by the government, which ranged from wholly absent, to conflicting, to shifting, to downright baseless,” said NAFSA.
In March, secretary of state Marco Rubio said that his department was revoking the visas of students who took part in pro-Palestinian protests and those with criminal charges.
However, many students who saw their status terminated said they did not fall under those categories and argued that they were denied due process. Others said they were not aware their status had been revoked until logging onto the SEVIS database.
In a significant shift for higher education access, Illinois Governor JB Pritzker announced his support for new legislation that would allow the state’s community colleges to offer bachelor’s degrees in high-demand fields. The move aligns Illinois with a growing national trend that has seen dramatic expansion in community college baccalaureate (CCB) programs across the country.
“By allowing our community colleges to offer baccalaureate degrees for in-demand career paths, we are making it easier and more affordable for students to advance their careers while strengthening our state’s economy,” Pritzker said in his February announcement.
The proposed bills, SB2482 and HB3717, would make Illinois the 25th state to implement such programs, joining states like California, Washington, and Florida that have already embraced community college bachelor’s degrees as a way to meet workforce demands and increase educational access. The measure appears to be stalled in the state legislature.
The Illinois initiative addresses practical challenges faced by many community college students. According to State Representative Tracy Katz Muhl, 78% of community college students work while in school, making relocation to four-year institutions impractical.
“Community college students are deeply rooted in their local communities—they work here, raise families here, and contribute to the local economy,” says Dr. Keith Cornille, President of Heartland Community College. “By expanding community college baccalaureate programs, we’re meeting students where they are.”
The proposal has gained support from education leaders including Illinois Community College Board Executive Director Brian Durham, who highlighted the potential to increase access to affordable higher education without burdening students with excessive debt.
A recent survey revealed that 75% of Illinois community college students would pursue a bachelor’s degree if they could complete it at their current institution—a statistic that demonstrates significant untapped potential in the state’s third-largest community college system, which serves 600,000 residents annually.
Illinois’ move follows a remarkable expansion in community college baccalaureate programs nationwide. According to a recent report from The Community College Baccalaureate Association (CCBA) and higher education consulting firm Bragg & Associates Inc., 187 community colleges across the country were offering or authorized to offer bachelor’s degrees as of last year.
This represents a 32% increase from Fall 2021, when only 132 institutions had such authorization. Today, approximately one-fifth of the nation’s 932 community colleges offer bachelor’s degrees, with the number of CCB degree programs rising from 583 to 678—a 17% increase in just two years.
“It’s a big jump over the last two years,” says report author Dr. Debra Bragg, president of Bragg & Associates Inc. Bragg anticipates “tremendous growth” in coming years as more states recognize the potential of these programs.
The movement began in 1989 when West Virginia became the first state to authorize a community college to confer bachelor’s degrees. By 2010, several more states—including California, Michigan, Florida, Texas, and Georgia—had followed suit. Some states have embraced the model completely, with Florida, Delaware, and Nevada authorizing all their community colleges to confer bachelor’s degrees.
Geographic and demographic patterns Community colleges offering bachelor’s degrees are not distributed evenly across the country. According to the CCBA report, 62% of CCB colleges are located on the West Coast, where there is “less density” of higher education institutions and longer commutes to traditional four-year schools.
“Geographic access to college, measured through proximal distance from a student’s home to college, correlates with students deciding whether they will ever participate in higher education,” the report notes. “Research on ‘education deserts’ shows most students choose to attend college within 50 miles of their home.” Washington (32), California (29), and Florida (28) lead the nation in the number of community colleges offering bachelor’s degrees. These institutions tend to be concentrated in large city and suburban areas (36%) or rural and town settings (27%) rather than in small cities or midsize urban areas.
Perhaps most significantly, CCB programs appear to be effectively serving traditionally underrepresented student populations. Approximately half of all community colleges offering bachelor’s degrees qualify as minority-serving institutions (MSIs), with Hispanic-Serving Institutions (HSIs) comprising 71% of these MSIs.
Data from the 2021-22 academic year shows that about half of all CCB graduates come from racially minoritized groups. Hispanic or Latinx students made up the slight majority (52%) of these graduates, followed by those identifying as Black or African American (29%) or Asian (9%).
Women are also well-represented among CCB graduates, accounting for 64% of degree recipients. This aligns with broader trends in higher education, where women generally attain degrees at higher rates than men.
The gender distribution varies by field of study. While business programs attract the largest portion of both male and female students (around 40% for each), men are more likely to pursue STEM fields (34%), while women gravitate toward nursing programs (26%).
The CCBA report highlights that CCB degrees are primarily focused on workforce preparation. Business programs dominate the offerings, followed by health professions, education, and nursing—all areas that align with significant workforce needs.
This workforce alignment is a key selling point for Illinois’ proposed legislation. The initiative comes as Illinois employers report growing demand for workers with bachelor’s degrees in specialized fields, mirroring workforce gaps seen in other states with successful CCB programs.
CCBA President Dr. Angela Kersenbrock sees these workforce-focused degrees as central to the community college mission. “To me, this is the community college really embracing its missions,” says Kersenbrock. “I know some folks say this is community colleges stepping over their mission. But I think it’s a full embracing of what they should be doing… closing equity gaps, being the people’s college, setting people up for economic success and mobility, and being very responsive to what a community needs in terms of workers and employees.”
Despite the growth and apparent success of community college baccalaureate programs, they are not without controversy. Some traditional four-year institutions view them as mission creep or unwelcome competition.
Illinois’ proposal faces similar scrutiny. Critics question whether community colleges have the resources, faculty expertise, and infrastructure necessary to deliver quality bachelor’s degree programs. Others worry about potential duplication of existing programs at four-year institutions.
Supporters counter that CCB programs typically focus on applied fields with clear workforce connections rather than traditional academic disciplines. They also emphasize that these programs often serve students who would otherwise not pursue bachelor’s degrees at all, rather than pulling students away from existing institutions.
Looking Ahead If Illinois passes the proposed legislation, it will join a diverse group of states finding success with community college baccalaureate programs. States like Washington, California, and Florida report positive outcomes in terms of both degree attainment and workforce preparation.
For Illinois’ sprawling community college system—the third largest in the nation—the change could significantly reshape higher education access. Community colleges often serve as entry points to higher education for first-generation college students, working adults, and others who face barriers to traditional four-year institutions.
“This initiative isn’t about competing with our university partners,” notes one Illinois community college president. “It’s about creating additional pathways for students who might otherwise never earn a bachelor’s degree.”
As more states consider similar legislation, the community college bachelor’s degree appears poised to become an increasingly common feature of American higher education. With workforce demands continuing to evolve and traditional college enrollment patterns shifting, these programs offer a flexible approach to meeting both student and employer needs.
For Bragg, the trend represents a natural evolution of community colleges’ historical mission.
“Community colleges have always adapted to meet changing educational and workforce needs,” she observes. “Bachelor’s degrees are just the latest example of this responsiveness.”
As Illinois moves forward with its proposal and other states watch closely, the coming years will likely see further expansion of bachelor’s degree options at community colleges nationwide—continuing a transformation that is making higher education more accessible to students who need it most.
There’s nothing worse than somebody attempting to answer a fascinating question with inappropriate data (and if you want to read how bad it is I did a quick piece at the time). But it occurred to me that there is a way to address the issue of whether graduate repayments of student loans do see meaningful differences by provider, and think about what may be causing this phenomenon.
What I present here is the kind of thing that you could probably refine a little if you were, say, shadow education minister and had access to some numerate researchers to support you. I want to be clear up top is that, with public data and a cavalier use of averages and medians, this can only be described as indicative and should be used appropriately and with care (yes, this means you Neil).
My findings
There is a difference in full time undergraduate loan repayment rates over the first five years after graduation by provider in England when you look at the cohort that graduated in 2016-17 (the most recent cohort for which public data over five years is available).
This has a notable and visible relationship with the proportion of former students in that cohort from POLAR4 quintile 1 (from areas in the lowest 20 per cent of areas).
Though it is not possible to draw a direct conclusion, it appears that subject of study and gender will also have an impact on repayments.
There is also a relationship between the average amount borrowed per student and the proportion of the cohort at a provider from POLAR4 Q1.
The combination of higher average borrowing and lower average earnings makes remaining loan balances (before interest) after five years look worse in providers with a higher proportion of students from disadvantaged backgrounds..
On the face of it, these are not new findings. We know that pre-application background has an impact on post-graduation success – it is a phenomenon that has been documented numerous times, and the main basis for complaints about the use of progression data as a proxy for the quality of education available at a provider. Likewise, we know that salary differences by gender and by industry (which has a close but not direct link to subject of study).
Methodology
The Longitudinal Educational Outcomes dataset currently offers a choice of three cohorts where median salaries are available one, three, and five years after graduation. I’ve chosen to look at the most recent available cohort, which graduated in 2016-17.
Thinking about the five years between graduation and the last available data point, I’ve assumed that median salaries for year 2 are the same as year 1, and that salaries for year 4 are the same as year 3. I can then take 9 per cent of earnings above the relevant threshold as the average repayment – taking two year ones, two year threes, and a year five gives me an average total repayment over five years.
The relevant threshold is whatever the Department for Education says was the repayment threshold for Plan 1 (all these loans would have been linked to to Plan 1 repayments) for the year in question.
How much do students borrow? There is a variation by provider – here we turn to the Student Loans Company 2016 cycle release of Support for Students in Higher Education (England). This provides details of all the full time undergraduate fee and maintenance loans provided to students that year by provider – we can divide the total value of loans by the total number of students to get the average loan amount per student. There’s two problems with this – I want to look at a single cohort, and this gives me an average for all students at the provider that year. In the interests of speed I’ve just multiplied this average by three (for a three year full time undergraduate course) and assumed the year of study differentials net out somehow. It’s not ideal, but there’s not really another straightforward way of doing it.
We’ve not plotted all of the available data – the focus is on English providers, specifically English higher education institutions (filtering out smaller providers where averages are less reliably). And we don’t show the University of Plymouth (yet), there is a problem with the SLC data somewhere.
Data
This first visualisation gives you a choice of X and Y axis as follows:
POLAR % – the proportion of students in the cohort from POLAR4 Q1
Three year borrowing – the average total borrowing per student, assuming a three year course
Repayment 5YAG – the average total amount repaid, five years after graduation
Balance 5YAG – the average amount borrowed minus the average total repayments over five years
You can highlight providers of interest using the highlighter box – the size of the blobs represents the size of the cohort.
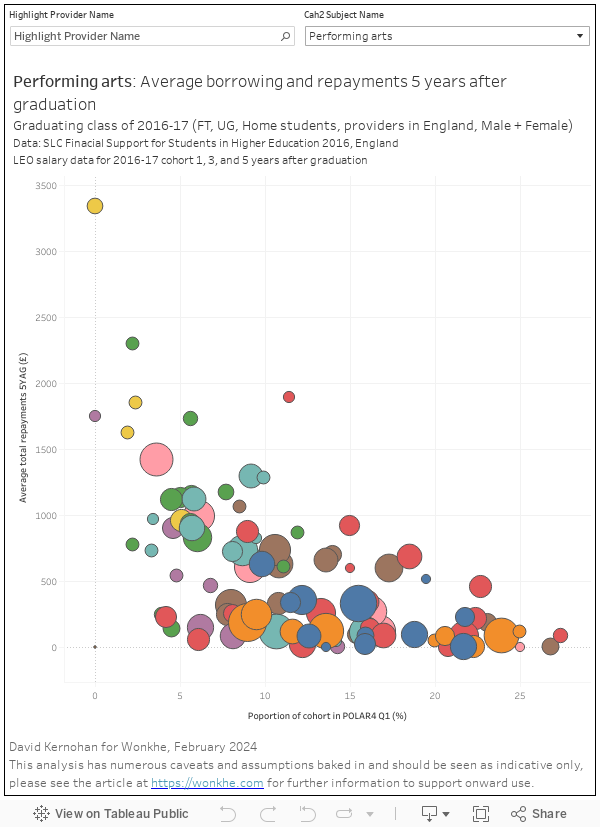
Of course, we don’t get data on student borrowing by provider and subject – but we can still calculate repayments on that basis. Here’s a look at average repayments over five years by CAH2 subject (box on the top right to choose) – I’ve plotted against the proportion of the cohort from POLAR4 Q1 because that curve is impressively persistent.
For all of the reasons – and short cuts! – above I want to emphasise again that this is indicative data – there are loads of assumptions here. I’m comfortable with this analysis being used to talk about general trends, but you should not use this for any form of regulation or parliamentary question.
The question it prompts, for me, is whether it is fair to assume that providers with a bigger proportion of non-traditional students will be less effective at teaching. Graduate outcome measures may offer some clues, but there are a lot of caveats to any analysis that relies solely on that aspect.


