Tag: FirstYear

  • Why First-Year Comp Classes Give Me Hope (opinion)

    Why First-Year Comp Classes Give Me Hope (opinion)

    First-year composition courses, which are required of incoming students at many colleges and universities, lack cachet. No student gets excited about a comp class, and the faculty who teach these classes usually occupy the low rungs on the academic ladder. And right now, as crisis after crisis batters the country, and the world, first-year composition may seem even less important than usual. But in my 30 years of college teaching, it’s first-year comp classes that give me hope, because they offer the possibility of change.

    These small, discussion-based classes give students much-needed practice in how to disagree without disrespect, and—if these classes were embedded more firmly into university curricula—they could radically reshape not only how students learn but how they participate in public life.

    My students often come into their comp class with a chip on their shoulder: Why should they have to “learn to write”? They got themselves into college, after all, and if they get stuck on a writing assignment, there’s always ChatGPT. First-year writing is a waste of time, they think; they’re in college to take “real” classes, courses that matter.

    I harbor a secret affection for these reluctant students, because I know that their resistance will melt when they discover the immensely practical importance of finding the right words for their ideas—and the accompanying sense of power that comes with being able to express themselves so that others understand them. Universities tell students that comp classes aren’t “content courses,” because writing courses aren’t discipline-specific. But then again, neither is the world we live in: Most of us live, work and think in multiple, overlapping contexts.

    For many students, the composition class is the first (and for some, the only) place in college where they experience a seminar-style class that emphasizes process as much as (or more than) product. The paradigm of a composition course involves a reset: It’s not about “the right answer”; it’s about prioritizing curiosity over certainty and about students discovering not only that they have a voice, but that they can use this voice to explore their world. In the 21st-century university, in which faculty are asked for their “course deliverables,” as if learning were an assembly-line widget, comp classes exemplify an alternative to the sludgy tide of university corporatization.

    Composition classes encourage questions, welcome mistakes and revisions, and value messiness and curiosity. During peer workshops, which are an integral part of these courses, I remind students that grades aren’t pie: Everyone can, conceivably, get an A in the course, so their workshop task is helping one another create more effective writing, not to tear each other’s drafts to shreds. Their success, in other words, does not depend on someone else’s failure.

    There are other disciplines where students work iteratively and collaboratively—computer science, for example. But in composition workshops, students learn to ask the kinds of questions that promote reflection and refinement. They’re quick to pick up on one another’s sweeping generalizations—“throughout history, men and women have always disagreed”—and explain why those sorts of generalizations aren’t effective.

    As they talk, they see how their own experiences might be radically different from those of the people reading their work, and they begin to understand how their experiences, consciously or not, have shaped how they see the world. In classroom conversations and workshops, they learn to disagree without rancor and to understand that how they chose to explain (or not explain) an idea has consequences for how they are understood. In a recent essay in The New York Times, Greg Weiner, president of Assumption University, writes that college campuses “are places where dissenting views deserve an elevated degree of respectful and scholarly engagement.” That’s a tall order for U.S. colleges these days, it seems, but it’s one of the underlying principles of composition classrooms.

    “How could I say this better?” is a question I hear writers ask, to which their readers reply, “What do you really want to say, and why?” Students ask one another to explain the evidence for their claims, to examine their assumptions and to think about alternative ways of presenting their ideas. Composition courses help people become more effective writers because they help people become better listeners: Students learn to disagree without dismissiveness or disrespect. And as they help one another, they see ways to improve their own work; it’s a feedback loop that helps them find critical distance, which is essential for revision. Quite literally, students have to re-see their ideas and consider the impact of those ideas on their audience.

    I remember when a male student from Shanghai read an essay written by a female student from the Persian Gulf about her struggles to be a dutiful daughter. “She totally read my mind,” the Shanghai student proclaimed. “Being a good son, trying to keep my parents happy—it’s exhausting!” His comment prompted a class discussion about the generational struggles they all shared, albeit across wildly divergent cultural experiences. Their differences prompted questions that led to connections; difference became an opportunity for exploration rather than a threat. Students were excited to write the essays that emerged from this conversation; they were invested in examining their own experiences in order to open those experiences to others.

    That’s what reading and writing can give us: moments of connection with other people’s lives, which then help us see ourselves in a new light. Connection and distance, empathy and self-reflection: These are the qualitative moves that students practice in composition class. These are the deliverables.

    These deliverables, however, don’t translate into status for composition teachers, who are typically not tenure-track or tenured; they are often called lecturers rather than professors, despite having a Ph.D. Most of us are what’s known as contingent faculty because we work on renewable contracts (sometimes semester to semester, sometimes in longer increments).

    To be a composition teacher, then, means working in the trenches of the university rather than its ivory towers. I’ve been teaching some version of first-year writing for more than 30 years, and while I might hope otherwise, I know that only one or two semesters of writing instruction isn’t enough to create lasting change, even though the most resistant students admit to feeling like more confident and competent writers by the end of the course.

    If universities had the courage to put composition at the center of their missions, however, they could create real change: What if students had expository writing classes every year for four years, regardless of their majors? Four years of slow, reflective, process-based writing about the world outside their specific subjects, with an emphasis on exploration and curiosity, rather than “the right answer”? What if the ability to reflect and reconsider, the twinned abilities at the heart of critical thinking, were the deliverables that mattered?

    Imagine those students bringing that training into the public sphere. People who are eager to ask questions and interrogate assumptions (including their own), people who think in terms of process rather than product: These are the basic tenets of almost any composition class and yet, increasingly, these attitudes seem almost radical. People trained in this way could re-shape public discourse so that it becomes conversation rather than a series of point-scoring contests.

    First-year comp is a content course. We just need to see that content as valuable.

    Deborah Lindsay Williams is a clinical professor in liberal studies at New York University. She is author of The Necessity of Young Adult Fiction (Oxford University Press, 2023) and co-editor of The Oxford History of the Novel in English: Volume 8: American Fiction Since 1940 (Oxford, 2024).

    Source link

  • UTSA launches first-year seminar for veteran students

    UTSA launches first-year seminar for veteran students

    The transition to college is a challenge for many students as they navigate the bureaucracy of higher education, build community and discern their goals and plans after graduation.

    For student veterans, an added challenge can be having too many choices.

    “The beauty of the military is they tell you what your path is in life and where you’re going to be assigned, what your job is gonna be,” says Brian Rendell, senior director of academic credentialing, leadership development and marketable skills at University College, part of the University of Texas at San Antonio. “Once you leave that, it’s an open book.”

    A new course offering at UTSA helps individuals with military service experience adjust to their life at the university and connect with peers who have similar backgrounds. The course, launched this calendar year, fulfills a general education requirement and provides personalized assistance with obtaining credit for prior learning.

    What’s the need: UTSA, located in San Antonio, known as “Military City USA,” Rendell jokes, serves a large number of military-affiliated learners, including offering a robust ROTC program and enrolling dozens of student veterans.

    Veterans, compared to their peers, are often older and have complex life experiences.

    Student veterans at UTSA shared with campus leaders that they didn’t always feel connected with their peers who came straight out of high school, which pushed administrators to consider other ways to create community for military-affiliated learners.

    The course is also designed to help consider their military training from an asset-based perspective.

    “What a lot of veterans don’t realize is the military teaches you so many skills,” Rendell says, including teamwork, discipline and hard work, which can assist in academic pursuits. While some careers have a direct application into postmilitary life, such as pilots, “there’s no tank drivers in the civilian world,” so helping students see where their skills and talents could assist them in the future requires some individual attention.

    How it works: The course, part of the Academic Instruction and Strategies (AIS) program, provides support and community for veterans for their academic and personal achievement.

    UTSA enrolls a large population of military-affiliated students, including ROTC cadets and veterans.

    AIS is required for all incoming students with fewer than 30 credits, and the initial Air Force pilot cohort fell within this category, though the course may be open to additional learners in the future, Rendell says.

    All AIS courses address academic skills and career planning, but unique to student veterans is one-on-one support from staff to evaluate their past experiences and military training to see where to award credit for prior learning.

    The in-person course is exclusively being taught by faculty and staff who are former service members themselves. Rendell, a retired Air Force colonel, is teaching the pilot cohort and has found his shared experiences help break down barriers.

    “I’ve been pleasantly surprised with how honest these students have been about the struggles they’ve had in the military or just in life,” Rendell says.

    Rendell invited representatives from the Veterans Association and the Student Veteran Association to speak in class, helping build connections across the institution and beyond.

    Looking ahead: The initial cohort of AIS student veterans includes five learners, but Rendell anticipates course enrollment to grow quickly due to the university’s large number of military-affiliated students.

    Next fall, he anticipates two to three sections of a veterans-only AIS with 20 to 30 learners per class.

    Campus leaders will track qualitative feedback from veterans to gauge the impact of the program, as well as CPL awarded to veterans, as measures of success.

    UTSA currently has a Center for Military Affiliated Students, which helps with onboarding and financial aid, and is launching a living-learning community on campus for ROTC participants to further connect students physically.

    If your student success program has a unique feature or twist, we’d like to know about it. Click here to submit.

    Source link

  • First-year student enrollment spiked 5.5% in fall 2024

    First-year student enrollment spiked 5.5% in fall 2024

    This audio is auto-generated. Please let us know if you have feedback.

    Dive Brief: 

    • Enrollment of first-year students grew 5.5% in fall 2024 compared to the year before, representing an increase of about 130,000 students, according to a final tally from the National Student Clearinghouse Research Center
    • The figure is a striking reversal from the clearinghouse’s preliminary findings in October, which erroneously reported a decline in first-year students. Earlier this month, the clearinghouse said the early data contained a research error and suspended its preliminary enrollment reports, which use different methodologies to determine first-year student counts than the research center’s reports on final enrollment figures. 
    • College enrollment overall grew 4.5% in fall 2024 compared to the year before, according to the final data, rebounding to levels seen before the coronavirus pandemic caused widespread declines. 

    Dive Insight: 

    The new data is promising for higher education institutions, many of which have weathered steep enrollment declines in the wake of the pandemic. 

    “It is encouraging to see the total number of postsecondary students rising above the pre-pandemic level for the first time this fall,” Doug Shapiro, the research center’s executive director, said in a Wednesday statement. 

    Undergraduate enrollment surged 4.7% this fall, representing an increase of about 716,000 students. Graduate enrollment likewise spiked 3.3%, representing an uptick of about 100,000 students. 

    All sectors enjoyed enrollment increases. For-profit, four-year institutions had the largest enrollment growth, with headcounts rising 7.5% in fall 2024 compared to the year before. Public two-year institutions and public primarily associate-degree granting baccalaureate institutions, or PABs, saw similar levels of growth — 5.8% and 6.3%, respectively. 

    Enrollment also increased at four-year nonprofits. Overall headcounts grew 3.8% at private colleges and 3.1% at public institutions. 

    Older students largely drove the growth in first-year students. Enrollment of first-year students from ages 21 to 24 surged 16.7% in fall 2024, while headcounts of students 25 and older spiked by a whopping 19.7%. 

    Enrollment of younger first-year students also increased, though the growth was more muted. 

    Headcounts of 18-year-old students grew 3.4%. However, this group of first-year students has still not recovered to pre-pandemic levels, Shapiro said in a statement.

    Similarly, enrollment of first-year students ages 19 to 20 increased 4.5%. 

    Two-year public colleges and public PABs enjoyed strong increases in their first-year student population, with 6.8% and 8.4% growth, respectively. However, for-profit, four-year colleges saw the largest increase, 26.1%, according to the new data. 

    Headcounts of first-year students also spiked at four-year nonprofits, rising 3.3% at public institutions and 2.8% at private colleges. 

    Shapiro addressed the research center’s methodological error during a call Wednesday with reporters. The erroneous preliminary report found that first-year enrollment had declined by 5% — over 10 percentage points lower than what the final data showed. 

    “I think our sensitivity to abnormally large changes was somewhat reduced because we had a host of kind of ready explanations for why we might be seeing these declines,” Shapiro said, citing issues with the federal student aid form, growing concerns with student debt and changes in the labor market.

    The research center staff has been investigating its other publications to see if the issue crept into them. 

    So far, they discovered that the flawed methodology also impacted a February 2024 report on transfer students. The clearinghouse will correct that data when it issues its next transfer report in February. 

    The research center previously announced that the error affected other reports in its “Stay Informed” series, which shares preliminary enrollment data. It has halted those reports — which launched at the height of the pandemic — until it vets a new methodology.

    Source link

  • Common App data shows 5% jump in first-year college applicants

    Common App data shows 5% jump in first-year college applicants

    This audio is auto-generated. Please let us know if you have feedback.

     Dive Brief:

    • First-year Common Applications are up 5% year over year, with over 1.2 million prospective students submitting the forms for the 2024-25 application cycle as of Jan. 1, the company said Thursday.
    • First-year applications ticked up across both institution types and student demographics, but some groups saw accelerated growth. Common App found disproportionate increases among students believed to be from low-income households and those who identified as underrepresented minorities. 
    • Applications to public institutions grew by 11% year over year, outpacing the 3% growth seen at private colleges, Thursday’s report said. 

    Dive Insight:

    Applications from prospective first-year students have steadily increased since the 2020-21 application cycle, Common App found. 

    That’s despite the challenges that have thrown aspects of college admissions into tumult, including the botched rollout of the updated Free Application for Federal Student Aid during the 2024-25 cycle and the U.S. Supreme Court’s June 2023 ban on race-conscious admissions.

    Roughly 960,000 students used the Common App portal to submit over 4.8 million applications during the 2020-21 cycle. In the 2024-25 cycle, over 1.2 million users submitted just under 6.7 million applications.

    Prospective students can continue to apply to colleges through the month and beyond. But a majority of applications for the following fall semester are traditionally submitted by the end of December. 

    The number of colleges first-year prospects applied to ticked up slightly between 2020-21 and 2024-25, but remained between five and six institutions. 

    Common App found disproportionate application growth among students from low-income households. The portal does not directly collect household income from applicants, but researchers used students who were eligible for fee waivers as a proxy. Application rates for that group increased by 10%, compared to 2% for their counterparts who weren’t eligible for the waivers.

    Moreover, applications from students in ZIP codes where median incomes fall below the national average grew 9% since the 2023-24 cycle, compared to 4% growth from those in above-median income areas, Common App found.

    The company also saw more applications from minority groups underrepresented in higher education, classified by researchers as those who identify as Black or African American, Latinx, Native American or Alaska Native, or Native Hawaiian or other Pacific Islander.

    As of Jan. 1, 367,000 underrepresented applicants used Common App to submit first-year applications. But their numbers are growing at a faster rate than their counterparts.

    Among students in underrepresented groups, first-year applications grew by 13% since last year, compared to the 2% growth for the others. 

    Latinx and Black or African American candidates drove much of that growth, showing year-over-year increases of 13% and 12%, respectively.

    However, it appears that students are reconsidering their application materials following the 2023 Supreme Court decision. In June, separate Common App research found a decrease in the number of Asian, Black, Latinx and White students referencing race or ethnicity in their college essays.

    Thursday’s report also found more first-year students including standardized test scores in their applications, up 10% since last year. The number of applicants leaving them out remained unchanged year over year.

    “This marks the first time since the 2021–22 season that the growth rate of test score reporters has surpassed that of non-reporters, narrowing the gap between the two groups,” the report said.

    That’s despite interest slowing in highly selective colleges, the type of institutions that have historically most used standardized test scores in the admissions process.

    Applications to colleges with acceptance rates below 25% grew just 2% in 2024-25, Common App found. That’s compared to the between 8% and 9% increases seen at institutions of all other selectivity levels.

    Just 5% of the colleges on Common App required test scores in the 2024-25 application cycle, a slight uptick from the 4% that did so the previous year. 

    COVID-19 pushed many institutions with test requirements to temporarily waive this mandate, and some ultimately made the change permanent.

    But others returned to their original rules. And reversal announcements continue to trickle in, including one from the highly selective University of Miami just this past Friday. 

    Source link

  • This week in numbers: Clearinghouse retracts first-year enrollment data

    This week in numbers: Clearinghouse retracts first-year enrollment data

    We’re rounding up recent stories, including a methodology mea culpa and billions of dollars in discharged loan debt.

    Source link

  • Diversity in the First-year Class at the Ivy Plus Institutions

    Diversity in the First-year Class at the Ivy Plus Institutions

     I’m not sure where to begin on this one, so let’s veer off topic a bit.  

    I’ve decided I’ll likely be phasing out Higher Ed Data Stories in the near future as I go into retirement and start my new venture, which is soft launched but not officially open for business.  When I do, I’ll be posting regularly on my blog over there, but won’t be putting everything out on the web for free, as I’ve been doing on this site.  I do appreciate the contributions people made on the Buy Me Coffee site, but the hosting, software, and labor costs never balanced with the revenue, and while there was a lot of good will that came from my work, I was still in a deficit situation (especially on the time part) and I’ll need to dedicate that to the business side of things.  Medicare Parts B and D ain’t free, you know.

    But this is some unfinished business, and it might be a good place to end.  You know I’ve been personally opposed to the very idea of the SAT and ACT for some time, while being professionally neutral: If colleges find value in it, I don’t care if they use one, the other, or both.

    But I do care about the truth.  On that note, two issues: The headlines suggesting that lots of colleges are returning to standardized tests for first-year admissions are just not true, of course, and everyone in the business knows this.  The testing agencies are curiously silent on the misinterpretation of this information, of course.

    The larger issue of “truth” is the justification put forth by the universities that are returning to the SAT or ACT.  They are all suggesting that they need the tests to find qualified students of color, or low-income students.  Is that true?  If it is, does it mean they denied admission to other, more highly qualified students of color with test scores? You can look at the data below, and while it’s not absolutely definitive, it is interesting.

    Before diving in, however, some caveats:

    • IPEDS reporting recognizes “two or more” as an ethnic category, but does not allow breakouts.  So many colleges will report some percentage of students in every category they check, and of course, there is good reason to do so.  There is no reason, however, to increase the numerator and not the denominator in the equation, as some of them do.  So you may notice that the numbers here don’t line up with what colleges have published.
    • IPEDS data on income or financial need is far less clear, as it only breaks out by Pell/Non-Pell.  Perhaps the researchers who have access to the unit record data can dive in more deeply.
    • We don’t have a lot data (at least not published as supporting evidence for the claim) that says there is a problem with performance among the students admitted without tests.  If that comes to light later, it might change your perception of this data, as it should.  What I have seen shows only minor differences, and given COVID and its disproportionate effects on students, I’m not sure the SAT would survive other testing.
    • Some of these charts show Simpson’s diversity, which is a different way of thinking about diversity.  It’s not the percentage of minority students; it is essentially the chance that two randomly selected members of a group will be different.  If your population was 100 and all 100 in the group were different, you’d have perfect diversity (a value of 1).  If all 100 were the same, you’d have a value of 0.  Higher numbers indicate greater diversity.

    OK.  Got it?

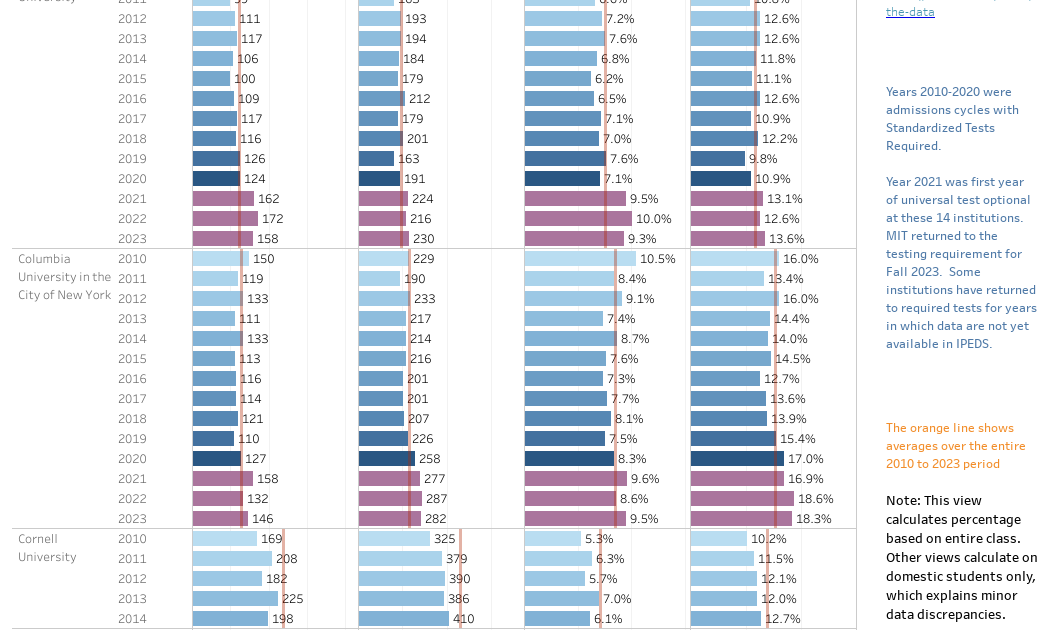
    There are four views in the visualization.  The first shows just Hispanic and Black/African-American enrollment in the first-year classes at the “Ivy Plus” institutions (The Ivy League institutions plus Duke, MIT, Stanford, and the University of Chicago.)  You can see the trend (in both numbers and percentage of the class) over time.  The denominator is the entire class. The blue bars show data up until 2020, and the purple bars show test optional years.

    The second shows the entire ethnic composition of the domestic students in the class.  Look at them collectively to start, then look at individual institutions using the control at right. 

    The last two views show the Simpson’s Index of Diversity for each institution over time.  The first is for domestic students, and the second is for everyone, including international students counted as an ethnicity.  Use the highlight control to focus on one institution.

    So, what do you think?  Do highly rejectives need the SAT to find students of color?  Let me know.

    Source link

  • Troubled FAFSA Rollout Linked to Sharp Decline in First-Year College Enrollment

    Troubled FAFSA Rollout Linked to Sharp Decline in First-Year College Enrollment

    Title: Fewer Freshmen Enrolled in College This Year Following Troubling FAFSA Cycle

    Author: Katharine Meyer

    Source: Brookings Institution, National Student Clearinghouse Research Center

    The rollout of the new FAFSA form last year triggered cascading consequences across the higher education community. The launch was delayed, customer calls remained unanswered, and the number of filings decreased by about three percent. As the form’s issues compounded, experts predicted that the fumbled rollout would likely negatively impact the higher education sector across several metrics, particularly new student enrollment.

    The National Student Clearinghouse Research Center collected data at the beginning of the academic year to begin painting the updated enrollment picture and will follow up with final enrollment numbers for the 2024-25 academic year. The Brookings Institution analyzed the preliminary data and observed large declines in FAFSA filings, followed by a decrease in first-year enrollment.

    Across all institutions, first-year enrollment is down 5.8 percent among 18-year-olds and 8.6 percent among 19-20-year-olds. At public four-year institutions, first-year enrollment declined 8.5 percent, and it declined 6.5 percent at private four-year institutions. White freshman enrollment declined the most (11.4 percent), followed by multiracial (6.6 percent) and Black (6.1 percent) first-year student enrollment. Enrollment at HBCUs, however, increased 5.9 percent from last year and has cumulatively increased 12.6 percent since fall 2022.

    First-year enrollment at four-year schools declined across all levels of Pell Grant recipience. Institutions that experienced the largest declines in first-year enrollment, though, were public and private four-year institutions with the highest shares of students receiving Pell Grants (-10.4 and -10.7 percent, respectively). First-year enrollment at four-year colleges is also down across all levels of selectivity, with the largest decline occurring at very competitive public four-year institutions (-10.8 percent), followed by competitive public four-year institutions (-10.3 percent).

    Despite declines in first-year enrollment, total college enrollment increased three percent, due in part to a 4.7 percent increase in community college enrollment. Interestingly, this increase occurred at certain types of two-year institutions but not all of them. At colleges that predominantly award associate degrees and some bachelor’s degrees, freshman enrollment increased 2.2 percent, and at two-year institutions that enroll a higher proportion of low-income students, first-year enrollment increased 1.2 percent. At community colleges only awarding associate degrees, however, enrollment decreased by 1.1 percent.

    The author notes these insights come with caveats; many factors have contributed to enrollment decline over the last decade, notably falling public confidence in higher education and the ever-growing cost of attending college. The sharp decline in first-year enrollment, however, correlates with the troubled FAFSA launch. Continuing to collect data over time will provide more insight into the implications of recent disruptions to enrollment trends, particularly following the COVID-19 pandemic and the FAFSA rollout. The 2025-26 FAFSA form will be available this December, and its functionality will determine the gravity of the past year’s enrollment decline.

    To view the National Student Clearinghouse Research Center data dashboard, click here. To read the Brookings Institution analysis, click here.

    —Erica Swirsky


    If you have any questions or comments about this blog post, please contact us.

    Source link

  • Private college discount rates for first-year students, 2021

    Private college discount rates for first-year students, 2021

    Two quick additions/clarifications to this:  The definition of full-pays is those students who receive no institutional funds.  EM people don’t care where the cash comes from, only the discount.  Second, yes, I know some institutions use endowments to pay for institutional aid.  That percentage is likely very small, although concentrated at a few institutions.

    Before we begin, here is what this post does not do:

    • It will generally not tell you where you can get low tuition, with a very few exceptions.  And when it does, it won’t be at one of “those” colleges.
    • It will not tell you which colleges are likely to close soon, although after the fact, you can probably find a closed college and say, “Aha! Right where I expected it would be!”
    • It will not show you net costs to students.
    • It will not adjust for things like church support, enormous endowments, or the cost of living in that high-priced city where Excellence College or Superior University is located.

    Got it?  Good.

    This will show you the discount rate on first-year students at about 1,000 four-year, private, not-for-profit colleges in 2021-22.  Discount as I define it is the total unfunded institutional financial aid divided by the total charged (gross) tuition and fees.  A university that charges (published tuition and fees times the number of students) $10,000,000 and awards $4,000,000 in aid has a discount rate of 40%.  At most colleges, this discount is simply an accounting transaction, much like a coupon to save a dollar on a sandwich at Subway.  That, of course, is a gross over-simplification of the “what” of discounting, and it doesn’t touch the “why” of discounting at all.  But if you want an explanation, I’ll gladly talk to your trustees for a reasonable fee.

    And there is a difference between discount and net revenue, although at any given tuition charge, the two are perfectly related.  Unfortunately, as  you’ll soon, see, colleges all set their own tuition.  To wit:

    • A college charging $50,000 with a 20% discount has net revenue (the cash you can spend) of $40,000 per student.
    • That same college with a 50% discount has just $25,000 per student.
    • A college charging $30,000 with a 10% discount has $27,000 per student.
    • That same college with a 40% discount has $18,000 per student.

    As a college, you don’t care where the cash comes from: Pell grants, state grants, loans, or the student’s family.  This means, hypothetically, a student with low institutional aid might pay less than one with more aid.  Confused?  Good.

    If you use this with your trustees to explain your own college’s market position, consider supporting my costs of time, hosting and software by buying me a coffee.  Just click here to do so.  If you counsel high school students, or your a parent of a prospective college student, must keep reading and don’t feel any obligation at all.

    Here is the data, in three views.  The first two are box and whisker plots, where half of the colleges fall inside the gray box on each column to show you the middle 50%.

    The first view shows net revenue per freshman student, arrayed by the institution’s Carnegie type.  Use the controls to filter region, highlight region, or highlight an individual college.  To do the latter, type any part of the name in the box, hit enter, and select from the options.  Hover over dots for details; each dot is a college.

    The second view is identical, but it shows discount rate, the number people obsess over while missing the more important net revenue figure.

    The third view shows those two values arrayed, with the same highlighters, allowing you to filter on Carnegie type, or even the percentage of the students who are full-pay (that is, they get no institutional aid at all.)

    You’ll soon see that discount and net revenue don’t seem to be big issues at the big name, strongly endowed institutions.  That’s because, at many of these places, undergraduate education is essentially a sideline business, and only a minor source of revenue.  The money they bring in (or don’t) on this presumably core function of the university is managed to best optimize to reputation or selectivity, or other factors (including, sometimes, mission).

    Note that I’ve done my best to remove some outliers with wild data that throw the charts off.  Many of these are colleges I have never heard of, and they’re tiny.  Others are places with strong religious missions (like Yeshivas or Seminaries) that may be externally funded in ways this can’t account for. 

    Enjoy

    Source link

  • First-year student diversity in American colleges and universities, 2018-2022

    First-year student diversity in American colleges and universities, 2018-2022

    I started this visualization to show how first-year classes at the highly rejective colleges had changed since COVID-19 forced them all to go to a test-optional approach for the Fall of 2021.  But it sort of took on a life of its own after that, as big, beefy data sets often do.

    The original point was to help discount the conventional wisdom, which is propped up by a limited, old study of a small set of colleges that showed test-optional policies didn’t affect diversity.  I did this post last year, after just one year of data made it fairly clear they did at the institutions that had the luxury of selecting and shaping their class. 

    This year I took it a little farther.  The views, using the tabs across the top, show the same trends (now going to 2022) for Public Land Grants, Public Flagships, the Ivy and Ivy+ Institutions.  In each case, choose one using the control.

    Note that I had colored the years by national trends: 2018 and 2019 are pre-test optional, gray is COVID, and blue is post-test optional.  This is not to say that any individual college selected either required tests or went test-optional in those years, but rather shows the national trend.  And remember these show enrolling students, not admitted students, which is why gray is critical; we know COVID changed a lot of plans, and thus 2020 may be an anomalous year. 

    The fourth view shows where students of any selected ethnicity enroll (again, use the dropdown box at the top to make a selection); the fifth view breaks out ethnicity by sector; and the final view allows you to look at diversity by sector and region (to avoid comparing diversity in Idaho, California, and Mississippi, for instance, three states with very different racial and ethnic makeups.)

    On all views, hovering over a data point explains what you’re seeing.

    If you work at a college or university, or for a private company that uses this data in your work, and want to support my time and effort, as well as software and web hosting costs, you can do that by buying me a coffee, here. Note that I won’t accept contributions from students, parents, or high school counselors, or from any company that wants to do business with my employer.

    And, as always, let me know what jumps out at you here. 

    Source link

  • First-year student (freshman) migration, 2022

    First-year student (freshman) migration, 2022

    A new approach to freshman migration, which is always a popular post on Higher Ed Data Stories.

    If you’re a regular reader, you can go right to the visualization and start interacting with it.  And I can’t stress enough: You need to use the controls and click away to get the most from these visualizations.

    If you’re new, this post focuses on one of the most interesting data elements in IPEDS: The geographic origins of first-year (freshman) students over time.  My data set includes institutions in the 50 states and DC.  It includes four-year public and four-year, private not-for-profits that participate in Title IV programs; and it includes traditional institutions using the Carnegie classification (Doctoral, Masters, Baccalaureate, and Special Focus Schools in business, engineering, and art/design.

    Data from other institutions is noisy and often unreliable, or (in the case of colleges in Puerto Rico, American Samoa, and other territories, often shows close to 100% of enrollment from that territory.)

    Instead of explaining how to interact with these views, I’ve put a text box on the view when appropriate.  You won’t break anything by clicking; I promise.

    If you use this in your business, I appreciate your support on Buy Me A Coffee to help with web hosting, software, computer, and labor costs.  If you are a parent or a high school counselor, just scroll right to the views. 

    Yes, there are some data problems in every report using IPEDS data, so don’t make any strategic decisions based on what you see here (I corrected Harvard’s 2012 glitch of not reporting anyone from California but 220 students from Arkansas instead, and I see Kenyon 2022 is funky.  I only report what’s in the data, folks.)

    Source link