The end of 2025 didn’t just usher in winter break but also major leadership changes.
Two East Coast flagships, the University of Virginia and the University of Delaware, named new presidents, each of whom took office on Jan. 1. But UVA’s decision to name a president in December defied the wishes of Gov.-elect Abigail Spanberger, potentially setting the stage for contentious relations between her and the university’s board.
At least two religious institutions also announced leadership transitions last month, some making mid-academic year pivots.
Below, we’re rounding up a selection of last month’s most notable college leadership changes.
President: Brian Konkol
Institution: Valparaiso University
Coming or going? Coming
Valparaiso University on Dec. 2 selected Brian Konkol as its new president. Konkol joins the Lutheran institution from Syracuse University, where he served as vice president, dean and professor.
Konkol assumed the role on Jan. 1.
Like many small religious institutions, Valparaiso’s finances have been shaky in recent years.
The university implemented a suite of cuts in 2024, eliminating over two dozen academic programs with low enrollment and nixing an undisclosed number of faculty positions.
Valparaiso’s last leader, José Padilla, said at the time that the cuts were “not solely a cost cutting initiative” and were also intended to “meet the expectations of our students and the demands of the market.” Six months later, Padilla announced he would resign when his contract expired on Dec. 31.
S&P Global Ratings in May gave Valparaiso’s bonds a BB+ rating, which reflects some credit risk. The university’s attempt to sell $54 million in bonds faced delays, according to Bloomberg, but they went through in July.
President: Kathleen Getz
Institution: Mercyhurst University
Coming or going? Going
Mercyhurst University President Kathleen Getz will retire at the end of June, the Catholic institution announced Dec. 2.
Under Getz, the Pennsylvania university served as a teach-out option for students who attended Notre Dame College of Ohio, a nearby religious institution that shuttered in 2024.
Mercyhurst also moved up to NCAA’s Division 1. Getz said at the time that the transition would allow the small private college to collaborate and compete with “universities and athletic programs in new and larger markets.”
The university also made staffing cuts, though they were less dramatic than those at other peer colleges. It cut five administrative and staff positions in June. Getz told the Erie Times-News that the cuts were not indicative of larger financial struggles at the university.
Mercyhurst’s board selected David Livingston as the institution’s interim president for a term of two years, beginning when Getz steps down. Livingston is a former Mercyhurst faculty member and administrator who more recently led Lourdes and Lewis universities.
President: Greg Cant
Institution: Wilkes University
Coming or going? Going
Greg Cant will retire as Wilkes University’s president in August, per a Dec. 8 statement from the university.
The announcement came just days after Cant informed university stakeholders that the private Pennsylvania institution had implemented a plan that had closed a roughly $7 million budget deficit.
The deficit first became public knowledge when The Citizens’ Voice obtained a copy of an October letter to the campus community detailing the shortfall, which attributed it in part to a “breakdown in process” and “failure in leadership.” The projected gap followed a $2.8 million deficit the previous year that left officials “surprised,” according to The Citizens’ Voice.
The university faced student protests in the fall demanding more transparency from administrators. Wilkes last month did not publicly share details about how it had addressed the budget gap, but a university spokesperson told The Citizens’ Voice it will “share any additional updates when they are available.”
Effective immediately, Wilkes’ senior vice president and provost, David Ward, assumed the role of chief operating officer and provost “to support the University in this time of leadership transition,” the university said in its Dec. 8 release.
President: James Clements
Institution: Clemson University
Coming or going? Going
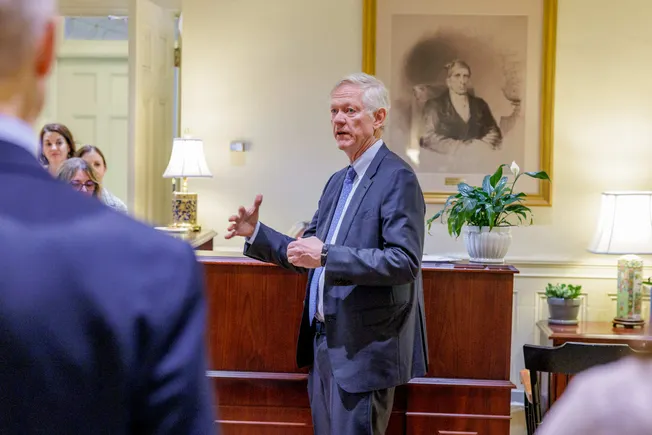
Clemson University President James Clements announced on Dec. 9 that he would retire at the end of the month, after leading the South Carolina institution for 12 years. The abrupt notice came after Clemson’s board approved a five-year contract extension for Clements in October 2024.
The public research university has repeatedly been in the public eye over the last year, both for its financial woes and its responses to political pressure.
Clemson froze all spending that wasn’t “mission critical,” restricted employee travel and suspended hiring amid reports it needed to cut $63 million from its budget. According to an email shared with The Post and Courier, the university said it was not facing a deficit and no jobs were in danger.
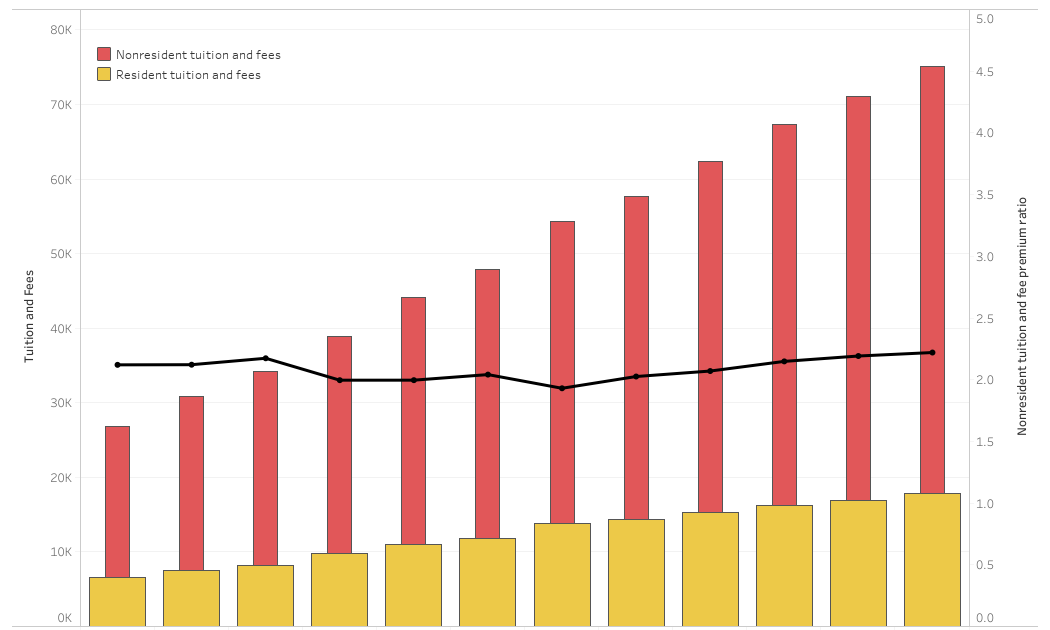
The university also froze its in-state tuition rate for undergraduates to secure more state funding.
In September, Clemson eliminated all advisory commissions, which had represented groups like veterans, and members of the LGBTQ+ and Black communities. The move came as the Trump administration has pressured colleges to do away with diversity initiatives.
On Dec. 9, Board Chair Kim Wilkerson applauded Clements’ tenure, under which she said Clemson saw record enrollment and graduation rates.
Clemson’s board selected Robert Jones to serve as interim leader while it searches for Clements‘ permanent replacement. Jones, the university’s provost and executive vice president for academic affairs, had previously been set to retire.
President: Laura Carlson
Institution: University of Delaware
Coming or going? Coming
The University of Delaware on Dec. 9 selected Laura Carlson as its permanent leader, after she held the interim president title for six months. She previously served as the university’s provost.
Carlson stepped into the temporary role at a difficult time for the state flagship.
In March, the University of Delaware was among dozens of institutions that the Trump administration began investigating over allegations they violated civil rights laws through “racial preferences and stereotypes” in academic programs or scholarships. The research institution also lost over $15 million in federal earmarks that Congress pulled from the fiscal 2025 budget.
In May, the university’s last leader, President Dennis Assanis, surprised many by announcing he would step down at the end of the academic year, after nearly a decade in the role. Assanis faced criticism from faculty for his focus on capital building projects at a time when the university experienced a budget deficit the previous year and faced another.
President: Scott Beardsley
Institution: University of Virginia
Coming or going? Coming
On Dec. 19, the UVA’s governing board unanimously selected Scott Beardsley as the state flagship’s next president.
UVA has been without a permanent leader since former President Jim Ryan abruptly stepped down this summer amid reports of a pressure campaign orchestrated against him by the U.S. Department of Justice.
Beardsley, who previously served as dean of the university’s business school, assumed the presidency on Jan. 1.
The public university’s selection of Beardsley runs contrary to a request made by Abigail Spanberger, the incoming governor, who had called on the board to hold off naming a new president until she took office this month, arguing trustees had “severely undermined the public’s and the University community’s confidence.”
This summer, the UVA faculty senate and the university student council each passed votes of no confidence in the board over the ouster of Ryan and its search for a new president.