Tag: freshman

  • Freshman enrollment up this fall; data error led to miscount

    Freshman enrollment up this fall; data error led to miscount

    Freshman enrollment did not decline this fall, as previously reported in the National Student Clearinghouse Research Center’s annual enrollment report in October. On Monday, the NSC acknowledged that a methodological error led to a major misrepresentation of first-year enrollment trends, and that first-year enrollment appears to have increased.

    The October report showed first-year enrollments fell by 5 percent, in what would have been the largest decline since the COVID-19 pandemic—and appeared to confirm fears that last year’s bungled rollout of a new federal aid form would curtail college access. Inside Higher Ed reported on that data across multiple articles, and it was featured prominently in major news outlets like The New York Times and The Washington Post.

    According to the clearinghouse, the error was a methodological one, caused by mislabeling many first-year students as dual-enrolled high school students. This also led to artificially inflated numbers on dual enrollment; the October report said the population of dually enrolled students grew by 7.2 percent.

    “The National Student Clearinghouse Research Center acknowledges the importance and significance of its role in providing accurate and reliable research to the higher education community,” Doug Shapiro, the center’s executive director, wrote in a statement. “We deeply regret this error and are conducting a thorough review to understand the root cause and implement measures to prevent such occurrences in the future.”

    On Jan. 23, the clearinghouse will release another annual enrollment report based on current term estimates that use different research methodologies.

    The Education Department had flagged a potential issue in the data this fall when its financial aid data showed a 5 percent increase in students receiving federal aid. In a statement, Under Secretary James Kvaal said the department was “encouraged and relieved” by the clearinghouse’s correction.

    Source link

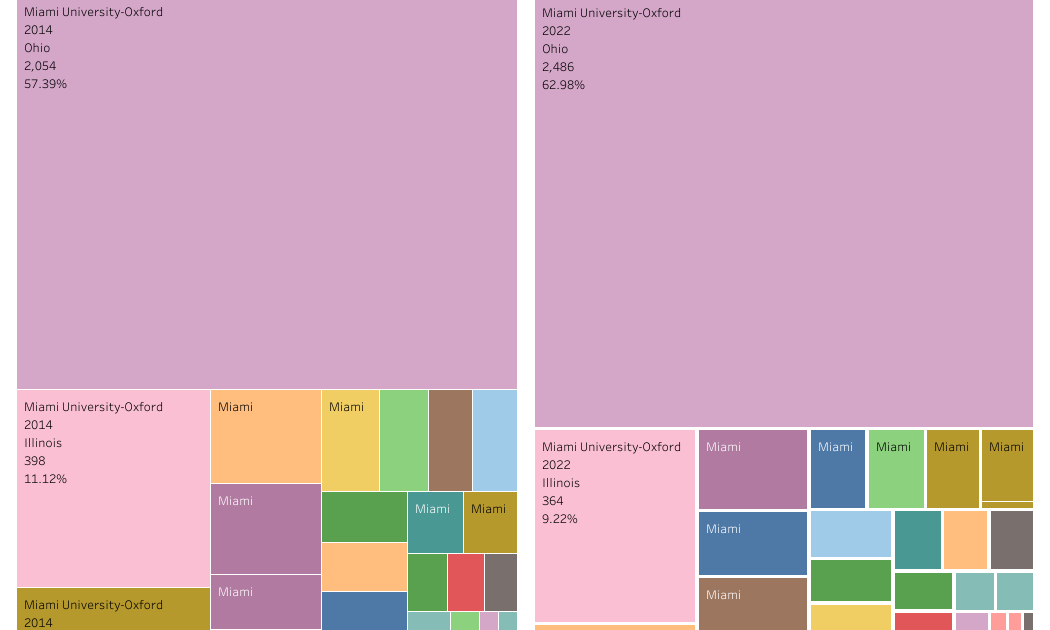
  • First-year student (freshman) migration, 2022

    First-year student (freshman) migration, 2022

    A new approach to freshman migration, which is always a popular post on Higher Ed Data Stories.

    If you’re a regular reader, you can go right to the visualization and start interacting with it.  And I can’t stress enough: You need to use the controls and click away to get the most from these visualizations.

    If you’re new, this post focuses on one of the most interesting data elements in IPEDS: The geographic origins of first-year (freshman) students over time.  My data set includes institutions in the 50 states and DC.  It includes four-year public and four-year, private not-for-profits that participate in Title IV programs; and it includes traditional institutions using the Carnegie classification (Doctoral, Masters, Baccalaureate, and Special Focus Schools in business, engineering, and art/design.

    Data from other institutions is noisy and often unreliable, or (in the case of colleges in Puerto Rico, American Samoa, and other territories, often shows close to 100% of enrollment from that territory.)

    Instead of explaining how to interact with these views, I’ve put a text box on the view when appropriate.  You won’t break anything by clicking; I promise.

    If you use this in your business, I appreciate your support on Buy Me A Coffee to help with web hosting, software, computer, and labor costs.  If you are a parent or a high school counselor, just scroll right to the views. 

    Yes, there are some data problems in every report using IPEDS data, so don’t make any strategic decisions based on what you see here (I corrected Harvard’s 2012 glitch of not reporting anyone from California but 220 students from Arkansas instead, and I see Kenyon 2022 is funky.  I only report what’s in the data, folks.)

    Source link