Tag: full

  • HESA has published full student data for 2023–24

    HESA has published full student data for 2023–24

    The 2023-24 HESA student data release was delayed by three rather than six months this year.

    We’re clearly getting better at dealing with the output (and the associated errors) of data collected through the HESA Data Platform. While there are not as many identified issues as in last year’s cycle the list is long and occasionally unnerving.

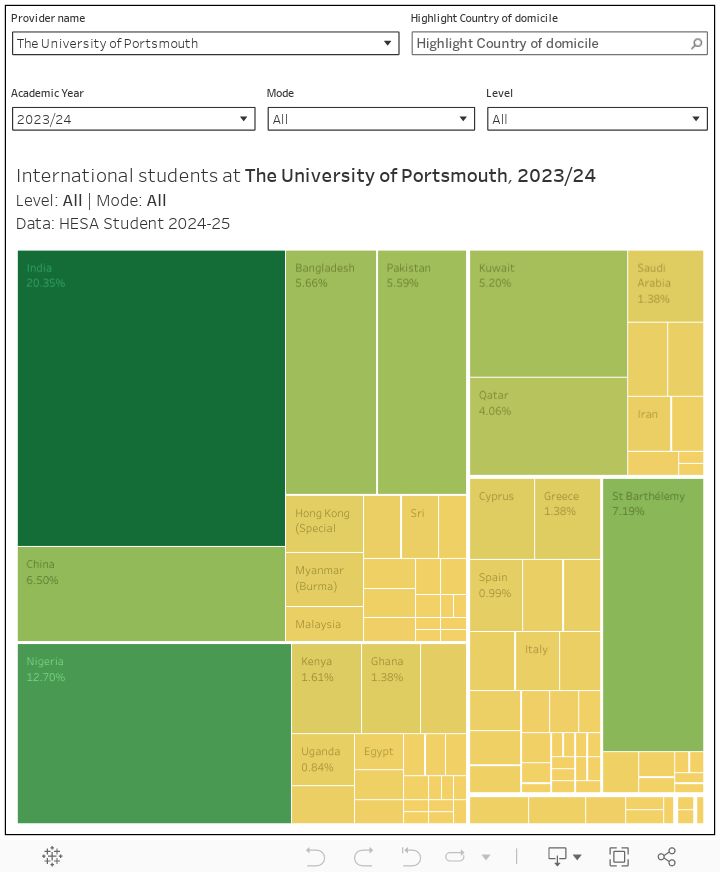
    Some represent a winding back from last year’s errors (we found 665 distance learning students at the University of Buckingham that should have been there last year), some are surprisingly big (the University of East London should have marked an extra 2,550 students as active), and some are just perplexing: the University of South Wales apparently doesn’t know where 1,570 students came from , the University of Portsmouth doesn’t actually have 470 students from the tiny Caribbean island of St Barthélemy.

    Access and participation

    It is surprising how little access and participation data, in the traditional sense, that HESA now publishes. We get an overview at sector level (the steady growth of undergraduate enrollments from the most deprived parts of England is notable and welcome), but there is nothing by provider level.

    [Full screen]

    One useful proxy for non-traditional students is entry qualifications. We get these by subject area – we learn that in 2025 a quarter of full time undergraduate business students do not have any formal qualifications at all.

    [Full screen]

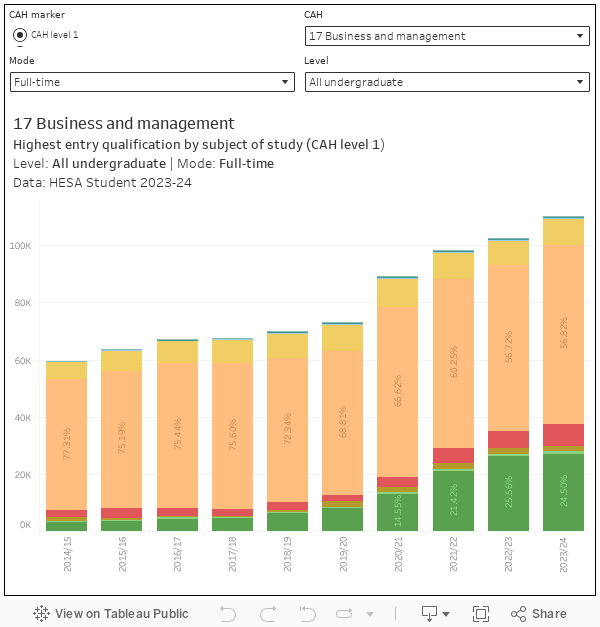
    With the UK’s four regulators far from agreement as to what should be monitored to ensure that participation reflects potential rather than privilege, it’s not really worth HESA publishing a separate set of UK wide statistics. The closest we get is SEISA, which is now official statistics. I look forward to seeing SEISA applied to UK-domiciled students at individual providers, and published by HESA.

    Student characteristics

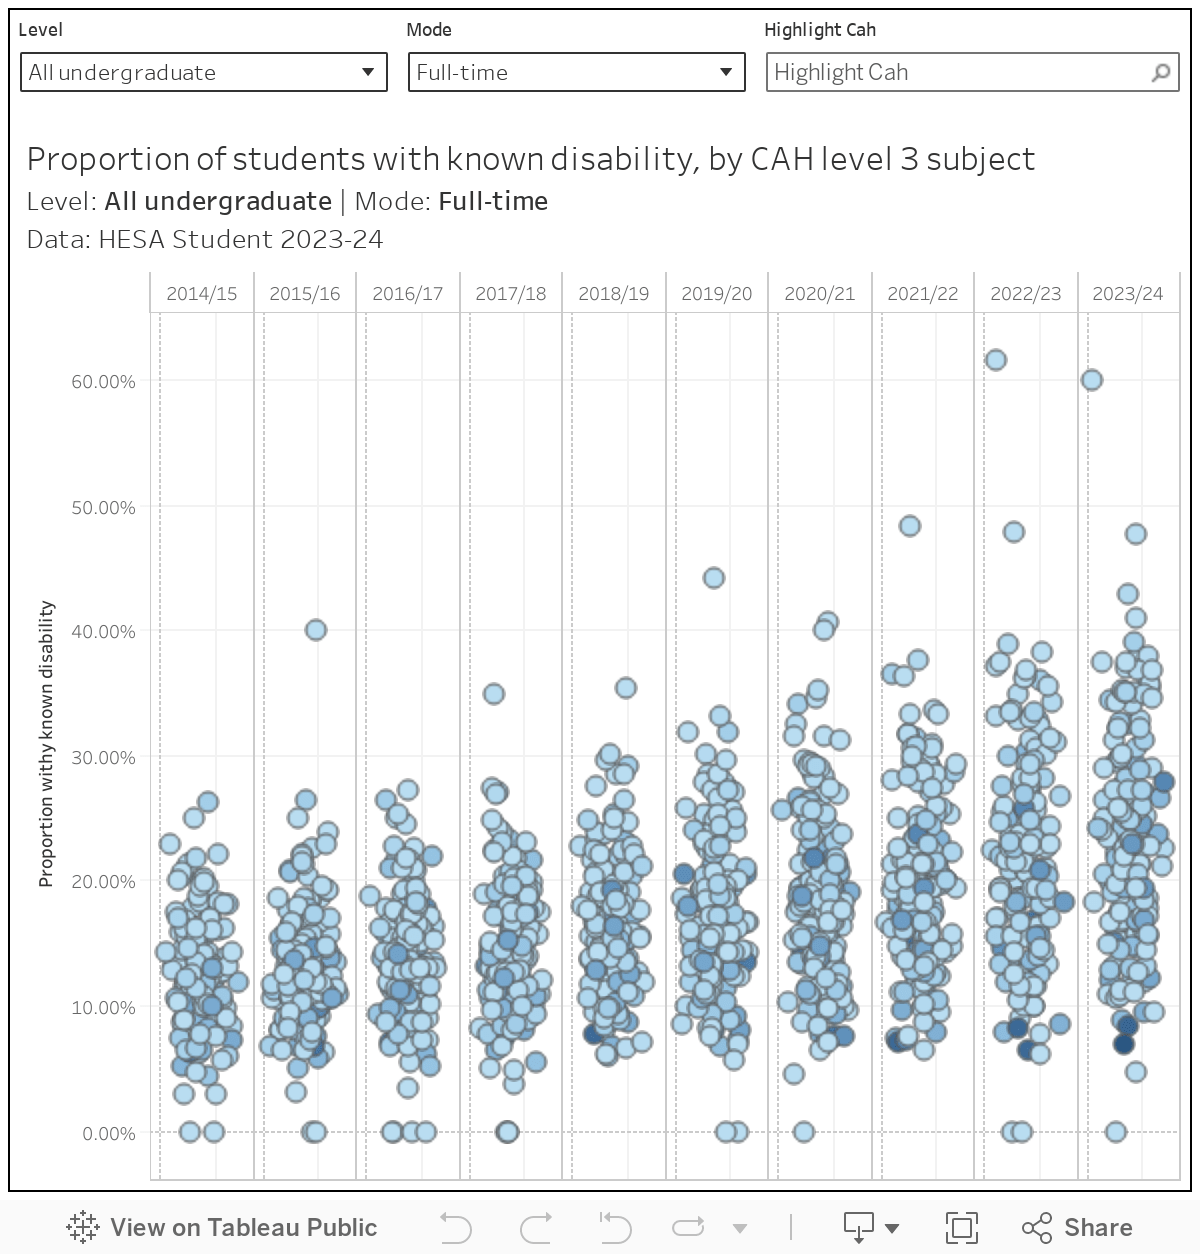
    We get by subject area data on disability (at a very general, “marker” – known disability – level) which I have plotted on a by year basis. The axis here is the proportion of students with a known disability – the colours show the total number of students. For me the story here is that creative subjects appear to attract students who disclose disabilities – art and creative writing in particular.

    [Full screen]

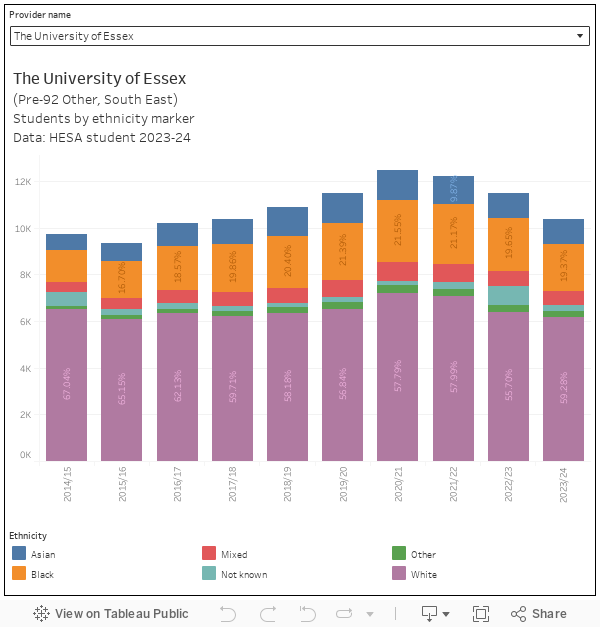
    I’ve also plotted ethnicity by provider, allowing you to see the ways in which the ethnic make up of providers has changed over time.

    [Full screen]

    Student domicile (UK)

    UK higher education includes four regulated systems – one in each of the four nations. Although in the main students domiciled in a given nation study at providers based in that same nation, there is a small amount of cross-border recruitment.

    [Full screen]

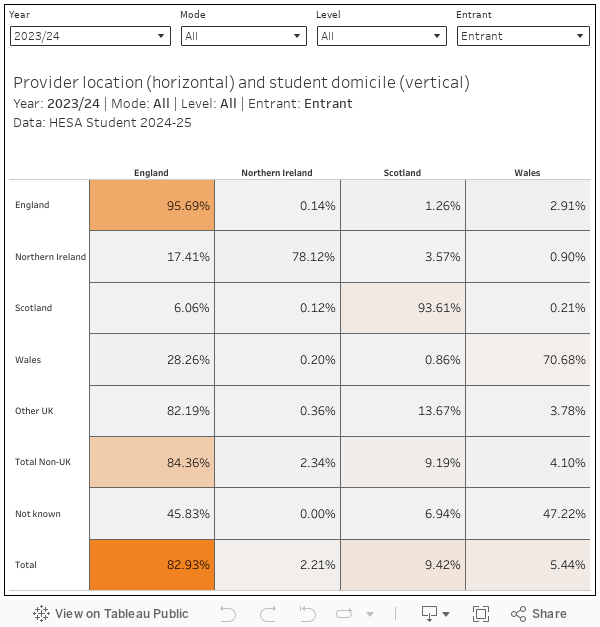
    Notably nearly three in ten Welsh students study at English providers, including more than a third of Welsh postgraduates. And two in ten Northern Irish students study in England. The concern is that if you move to study, you are less likely to move home – so governments in Wales and Northern Ireland (where there are student number controls) will be thinking carefully about the attractiveness and capacity of their respective systems to avoid a “brain drain”.

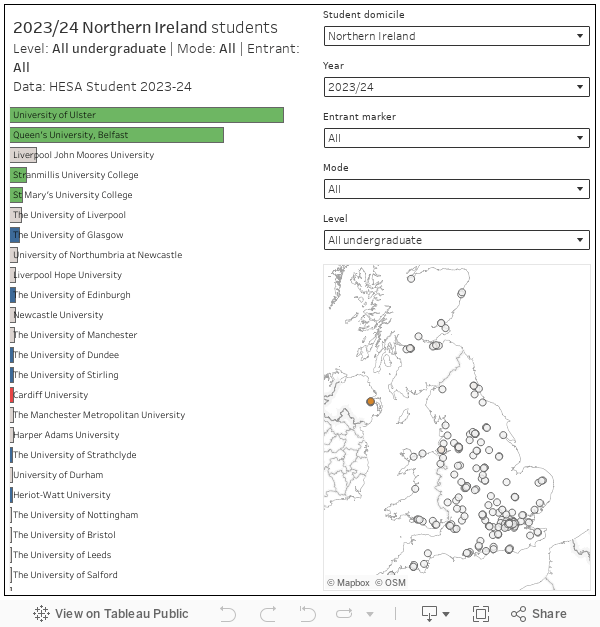
    Within these trends, particular providers have proven particularly efficient in cross-border recruitment. If you are a Northern Irish student studying in England chances are you are at Liverpool John Moores University, Liverpool, or Northumbria. If you are Welsh and studying in England your destination may well be UWE, Bristol, Chester – or again, Liverpool John Moores.

    There is a proximity effect – where students are crossing the border, they are likely to stay close to it – but also (if we look at Northern Ireland domiciled students looking at Glasgow or Newcastle) evidence of wider historic cultural links.

    [Full screen]

    Student domicile (international)

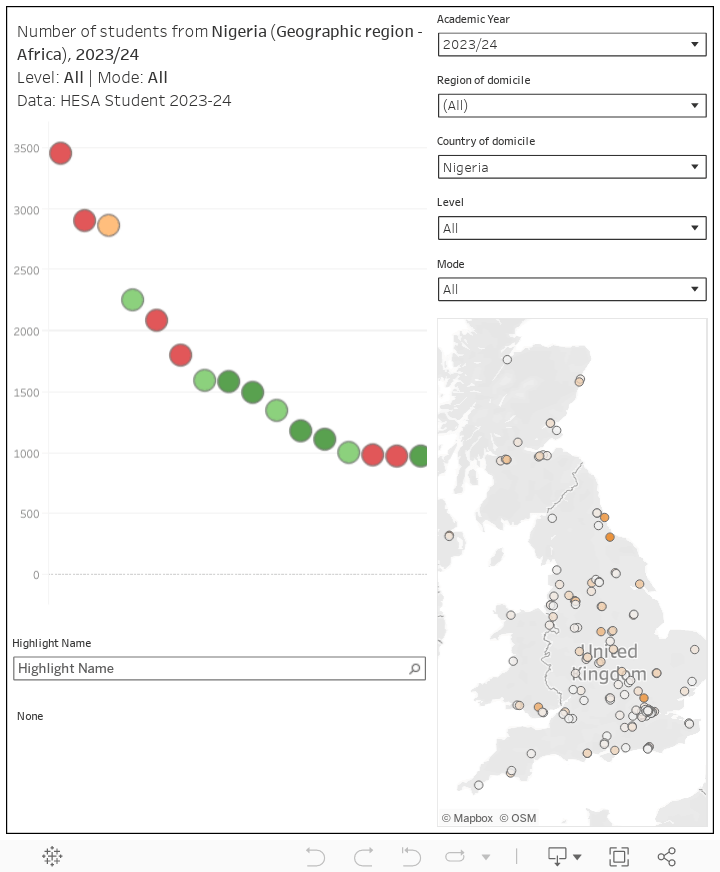
    Thinking about providers recruiting from Northern Ireland made me wonder about students from the Republic of Ireland – do we see similar links? As you might expect, the two larger providers in Northern Ireland recruit a significant share, but other winners include the University of Edinburgh and St Margaret’s. UCL has the biggest population among English providers.

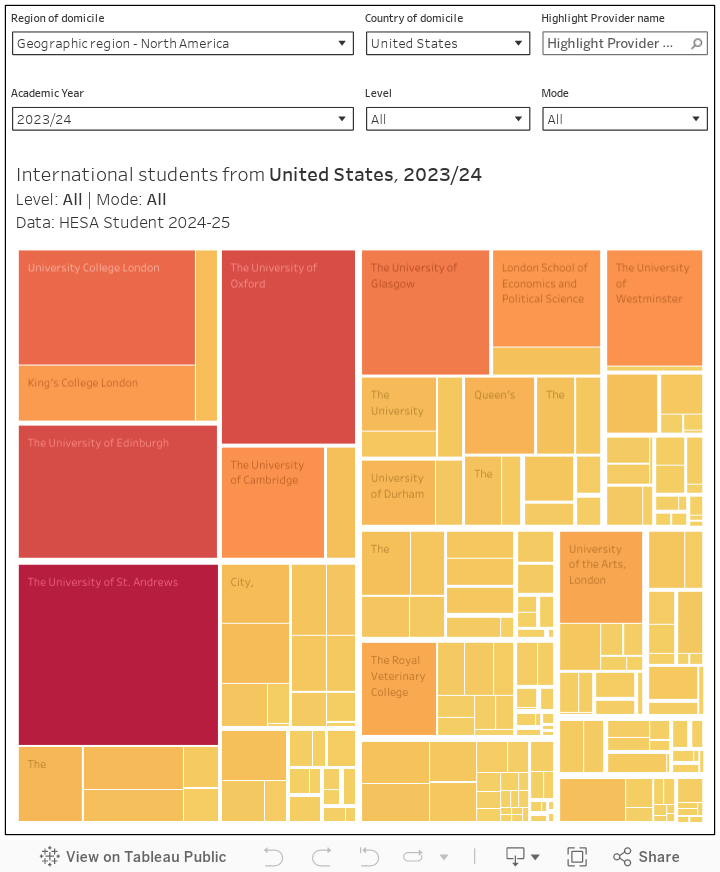
    You can use this chart to look at where students from any country in the world end up when they study in the UK (I do insist you look at those St Barthélemy students – literally all at the University of Portsmouth apparently).

    [Full screen]

    An alternate view lets you look at the international population of your institution – the established pattern (China in the Russell Group, India elsewhere) still holds up.

    [Full screen]

    What’s of interest to nervous institutional managers is the way international recruitment is changing over time. This is a more complicated dashboard that helps you see trends at individual providers for a given country, seen along with how your recruitment sits within the sector (mouse over an institution to activate the time series at the bottom.

    [Full screen]

    Source link

  • What’s driving low levels of full economic cost recovery in research?

    What’s driving low levels of full economic cost recovery in research?

    Media attention has emphasised that the financial issues facing universities continue to worsen. While research is a cornerstone and strength of the sector, it is often regarded as a cost, which leads to scrutiny as part of institutional savings targets. Despite calls to acknowledge the value of research, the focus understandably remains on research costs.

    The focus of universities on the volume and cost of unfunded research, or more accurately, internally funded research, is a question that must be addressed. Institutions are reflecting on and revising internal research allowances as part of their efforts to achieve a more sustainable financial position, as the cross-subsidy from international student fees is no longer as viable as it once was.

    The question of funded research, however, is a different matter. For quite some time, there have been questions about what constitutes the full economic cost (FEC) and how these costs are recovered when projects are funded. Both issues have once again come to the forefront in the current climate, especially as institutions are failing to recover the eligible costs of funded projects.

    As part of the Innovation & Research Caucus, an investment funded by UKRI, we have been investigating why the recovery of UKRI-funded research is often below the stated rates. To put it simply, if the official recovery rate is 80 per cent FEC, why is 80 per cent not being recovered on UKRI-funded projects?

    Understanding under-recovery

    We conducted a series of interviews with chief financial officers, pro vice chancellors for research, and directors of research services across mission groups, the Transparent Approach to Costing (TRAC) group, and various geographic regions. They identified several key reasons why universities are not recovering the funding to which they are entitled.

    Before exploring the causes of under-recovery on UKRI-funded projects, the project aimed to establish the extent to which TRAC data was curated and utilised. Notably, the study found that the data collected for TRAC does not exist within research organisations and would not otherwise be collected in this form if it were not for the TRAC reporting requirement.

    While scrutinising TRAC data was less of a priority when the financial situation was more stable, in many institutions, it is now of interest to the top table and serves as the basis for modelling, projections, and scenario planning. That said, such analysis did not always recognise TRAC’s limitations in terms of how it was compiled and, therefore, its comparability.

    In many of the research organisations consulted, the responsibilities for TRAC, project costing, and project delivery are distinct. Given the growing significance of TRAC data in influencing resource allocation and strategic decision-making, it is essential for research organisations to adopt a more integrated approach to compiling and utilising TRAC data to achieve improved outcomes.

    Drivers of under-recovery

    A wide range of factors explains why the cost recovered at the end of a funding grant is less than anticipated at the point of submission and award. Almost all respondents highlighted three factors as significant in low cost recovery:

    1. Equipment and facilities costs were consistently cited as a factor, including issues associated with allocating and costing overheads and estates. Several institutions highlighted the difficulty in realistically costing equipment and facilities shared between research projects or between research projects and teaching.
    1. Staff under-costing was frequently mentioned, as principal investigators (PIs) underestimated their own and their colleagues’ time commitment to projects. This ineffective practice was driven by a (mis)perception that lower costs will likely improve success rates – despite the emphasis being on value rather than cost within a specific funding envelope.
    2. Inflation has been identified as a factor affecting all cost elements – from staff costs related to pay settlements and promotions to the rising expenses associated with consumables, equipment, and energy. This reveals a growing gap in applications, delivery, and reporting.

    Beyond these top three, the report highlights the implications of the often “hidden” costs associated with supporting and administering UKRI grants, the perennial issues of match funding, and the often inevitable delays in starting and delivering projects – all of which add to the cost and increase the prospect of under-recovery.

    In addition, an array of other contributing factors were also raised. These included the impact of exchange rates, eligibility criteria, the capital intensity of projects, cost recovery for partners, recruitment challenges, lack of contingency, and no cost extensions. While not pinpointing the importance of a single factor, the interplay and cumulative effect were considered to result in under-recovery.

    Addressing under-recovery

    Universities bear the cost of under-recovery, but funders and universities can take several actions to improve under-recovery – some of which are low- or no-cost, could be implemented in the short term, and would make a real difference.

    Funders, such as UKRI, should provide clearer guidance for research organisations on how to cost facilities and equipment, as well as how to include these costs in research bids. Similarly, applicants and reviewers should receive clearer guidance regarding realistic expectations from PIs in leading projects, emphasising that value should be prioritised over cost. Another area that warrants clearer guidance is match funding, specifically for institutions regarding expectations and for reviewers on how match funding should be assessed. We are pleased to see that UKRI is already taking steps to address these points in its funding policies [editor’s note: this link will be live around 9am on Friday morning].

    In the medium term, research funders could also review their approaches to indexation, which could help mitigate the impact of inflation in driving under-recovery, although this is, of course, not without cost. Another area worth exploring by both research organisations and funders is the provision of shared infrastructures and assets, both within and across institutions – again, a longer-term project.

    We are already seeing institutions taking steps to manage and mitigate under-recovery, and there is scope to extend good practice. Perhaps the main challenge to improving cost recovery is better managing the link between project budgets – based on proposal costs – and project delivery costs. Ensuring a joined-up approach from project costing to reporting is important, but more important is developing a deeper understanding across these areas.

    A final point is the need to ensure that academics vying for funding really understand the new realities of cost and recovery. This has not always been the case, and arguably still is not the case. These skills – from clarifying the importance of realistic staff costs to accurately costing the use of facilities to effectively managing project budgets – will help close the cost recovery gap.

    The real FEC of research funding

    The current project has focused on under-recovery in project delivery. The next step is to understand the real cost to research organisations of UKRI grant funding.

    This means understanding the cost of developing, preparing and submitting a UKRI grant application – whether successful or not. It means understanding the costs associated with administering and reporting on a UKRI grant during and beyond the life of a project (think ResearchFish!).

    For more information, please get in touch – or watch this space for further findings.

    The Innovation & Research Caucus report, Understanding low levels of FEC cost recovery on UKRI grants, will be published on the UKRI site later today.

    Source link

  • McMahon confirmation as education secretary advances to full Senate

    McMahon confirmation as education secretary advances to full Senate

    This audio is auto-generated. Please let us know if you have feedback.

    Linda McMahon’s nomination for U.S. secretary of education advanced Thursday with the approval of the Senate Health, Education, Labor and Pensions Committee, which voted 12-11 along party lines.

    “We need a strong leader at the department who will get our education system back on track, and Ms. McMahon is the right person for the job,” said HELP Chair Bill Cassidy, R-La., before the vote.

    McMahon appeared before the committee Feb. 13 for a 2 ½ hour confirmation hearing where she spoke of her priorities for expanding school choice and skills-based learning, providing more decision-making power to local schools and parents, and protecting students from discrimination and harassment. 

    She also talked about her openness to making sweeping changes at the U.S. Department of Education, including moving programs like special education oversight and civil rights investigations to other federal agencies.

    We are failing our students, our Department of Education, and what we are doing today is not working, and we need to change it,” McMahon said at the time. McMahon formerly served as administrator of the Small Business Administration for two years in President Donald Trump’s first administration. She was previously president and CEO of World Wrestling Entertainment.

    Trump and the temporary Department of Government Efficiency, or DOGE, have already made major alterations to Education Department activities, including by attempting to freeze funding to states, canceling research contracts, halting diversity, equity and inclusion funds and programming, and calling for the end of “radical indoctrination” in K-12 schools.

    Trump has also said his goal is to close the Education Department — a move that would need congressional approval. 

    At Thursday’s HELP executive session, which lasted about 15 minutes, Sen. Tim Kaine, D-Va., said he was opposing McMahon’s nomination. “I find areas of agreement [with McMahon], but I can’t vote for somebody who will willfully engage in the destruction of the very agency she wants to lead. That is disqualifying,” Kaine said.

    Ranking member Bernie Sanders, D-Vt., also voted against McMahon’s nomination and criticized what he said was a move toward an authoritarian society where “all power is resting in the hands of a few in the White House.”

    “It doesn’t really matter who the Secretary will be, because he or she will not have the power,” Sanders said.

    Sen. Markwayne Mullin, R-Okla., before voting in favor of the nomination, said U.S. education has fallen in global rankings. “If we really say we’re for the kids, then let’s try something drastic,” Mullin said. “Let’s actually make a change, because we’re doing nothing but going backwards, and our test scores haven’t improved since 1979. They’ve just continued to fall.”

    A full Senate vote on McMahon’s confirmation is forthcoming.

    Source link