Tag: Growth

  • The Graduate Route — the most undervalued tool at the Treasury’s disposal to drive growth in the UK.

    The Graduate Route — the most undervalued tool at the Treasury’s disposal to drive growth in the UK.

    The HEPI blog was kindly authored by James Pitman, Chair of IHE and Managing Director U.K. and Ireland, Study Group

    The Graduate Route has been extraordinarily powerful in driving international education value in the UK. Although all the surveys show students choose universities and courses for their reputation or fit, the opportunity to translate this into a first job in another country to strengthen English language skills as they earn is evidenced by what happens as soon as that is taken away.

    The correlation between removing the Post Study Work Visa scheme on the back of statistically invalid analysis and the drop in international students choosing the UK in 2012 is irrefutable. This is strengthened by the significant international student growth linked to the re-introduction of the Graduate Route in 2021.

    Why is the graduate route visa such a powerful incentive for some international students to come and study in the UK? The simplest explanation came from an agent in India, who explained:

    ‘An Indian student can recoup much of their investment in a UK degree over a few years of employment in the UK when it would take several decades to do the same back in India.’

    International students contribute a net £100,000 to the UK economy during their degree study. A degree is required to enter the Graduate Route. Therefore, one could consider the ‘entry ticket’ for a Graduate Route visa to be a £100,000 investment in the UK – which may be worth up to £30,000 to the exchequer. From a Treasury growth perspective, international students drive employment and economic benefit in every constituency of the UK, especially in university towns and cities. I doubt the mandarins at the Treasury could think of a more cost-effective measure that seeds prosperity right across the country while building connections and loyalty that last a lifetime amongst the very group who will, in years to come, shape societies and build companies.

    Oxford Economics concluded that every 10 international students supports 6 jobs, with half in Higher Education and half in the local economy. If this remains accurate, the reported loss of approximately 10,000 jobs in Higher Education last year, mainly attributed to the decline in international students, should correspond to a similar loss in local economies across the country.

    And yet this is economic harm proactively driven by policy choices which raised uncertainty regarding the future of the Graduate Route.  If you were thinking of making a £100,000 investment, uncertainty would not exactly be conducive to choosing to invest in the UK. As one local businessman in Sheffield put it, “If you walk past a shop window swinging a baseball bat for a couple of weeks, it doesn’t matter if you never hit it, the people inside will still get worried.” Even just the threat of future policy changes creates “a massive amount of uncertainty, and uncertainty for students is a big problem.” 

    Subsidising the domestic tax payer

    Students on the Graduate Route, like all international students, pay the Immigration Health Surcharge (currently £776 p.a. for students and £1035 p.a. for graduates on the Graduate Route).  The actual costs according to the Department of Health and Social Care in 2018 were £480 p.a. including dependants.  Given the restrictions on dependants, a shift in the mix (until recent restrictions) to shorter PG courses, the prevalence of private insurance that many students have and the reality of waiting times for treatment, this is a subsidy to the NHS.

    Another subsidy is less well known, but any student on the Graduate Route employed at any salary level, high or low, is actually subsiding the UK tax payer. In comparison with a domestic employee at the exact same level of remuneration, international students pay the same income tax and National Insurance, but critically, they can only access less than half of the services that those taxes pay for. International students on the Graduate Route are barred from benefiting from services provided in the areas of Education, Social Protection, and Housing, and they already subsidise the NHS, as shown above. Those four areas account for c.65% of public sector expenditure on services (PESA 2023/4).  Another way of putting this is that international students employed on the Graduate Route are effectively paying income tax at double the rate of a domestic equivalent worker.  

    The dependants dilemma — a third way

    However, the Migration Advisory Committee has argued that there is a subsidy element for international students. This seems to be based on the fact that international students could, until last year, bring unlimited numbers of dependants and that any child dependants had access to free education at the UK taxpayer’s cost. This option was then removed with a devastating knock-on impact for university finances.

    However, it is instructive to note that the options considered around this issue were binary — either close the dependants route (the approach taken for any students other than for those on research-intensive PG courses) or leave the system as was. What was not considered was adapting the dependants’ visa by removing access to free childhood education but leaving the route, which would have caused far less damage to international student recruitment in 2024. Instead, removing the dependant’s route caused significant damage that disadvantaged female students and students from cultures where chaperones are required. I know the options considered, because the Home Office responded to an FOI on this matter. Let us also remember that dependants have always been (as the name implies) dependant on the international student that they accompany, not the UK tax payer.

    Cost-benefit analysis

    In reality, in economic terms, international graduates are more akin to tourists, having no recourse to public funds (apart from the historical significant exception of child dependants) and bringing resources into the UK to sustain themselves. However, unlike tourists, they do have to pay the Immigration Health Surcharge.

    To give an indicator of the cost to the UK of restricting international students coming to study in the UK over that period, I compared the government-published data on value and growth rates of international education from 2010 to 2024 to the equivalent global international student mobility value growth rates published by Holon IQ (part of the QS Quacquarelli Symonds, group).  It is only an indicator, but against the UK having been permitted by government to grow at the same growth rate as the global market (which I doubt many in the sector would have bet against), cumulative loss to GDP over that period was £66 billion, implying a cumulative loss of income to the exchequer of £23 Billion. How many hospitals, schools and roads would be in better shape today if that scale of investment had been funded by international education?  What a wasted opportunity, and for what purpose?

    Now, the Prime Minister tells us his priorities are security and growth. On both, international students can be a key part of a progressive policy shift. And yet it is sad to say that our new government, whilst saying the right things, has not yet done anything to undo the damage of the past. If reports are to be believed, they are even being tempted to impose even more restrictions on international students in the Immigration White Paper to be published this month, preceding the new iteration of the International Education Strategy in April.  

    Once again, it appears that those who are tasked with reducing immigration are acting in direct opposition to the avowed growth agenda of the Treasury, the Department of Business and Trade, the Department for Education and others and, quite frankly, considering the above, against the demonstrable interests of the UK.

    Rethinking terms

    I have a clear understanding of the root cause of this ambivalence towards international students, and I direct any interested readers to the HEPI blog ‘When is an Immigrant not an Immigrant’. Allpolling of the general public (most recently by Public Future) shows that they recognise international students are not immigrants, and a strong majority cannot comprehend why they are categorised in the same way. If our government is serious about growth, I urge them to separate international students from immigration immediately.

    Finally, again, to demonstrate the value of international students, we should consider the increasingly dangerous situation we find ourselves in and the government’s commitment to ramp up defence spending. That incremental 0.2% GDP or £6 billion spend, announced recently, could have avoided the contentious cut in the overseas budget.  

    Why didn’t the Treasury consider international education instead? With no investment needed beyond the political will to enhance the UK’s international education offering, we could provide high-quality education to an additional 175,000 international students (that’s merely, on average, 1,250 per university). At current rates, this would generate around £6 billion for the exchequer from each cohort while also supporting the creation of approximately 50,000 jobs in higher education and another 50,000 jobs for hard-pressed families in local communities across the UK. Furthermore, it would significantly enhance the UK’s soft power in the long term.

    Many in the international education sector believe that our ability to welcome students is, in financial terms, as near as our country can get to a golden goose, although not one that will live forever. The Graduate Route is a key golden lever in its nest.  International students bring huge investments in order to access the benefits of the Graduate Route, subsidise the UK taxpayer while they are on it and can only remain in the UK after that with another category of visa.

    Source link

  • College Application Surge: Underrepresented Students Lead Growth in 2024-25 Admissions Cycle

    College Application Surge: Underrepresented Students Lead Growth in 2024-25 Admissions Cycle

    According to Common App’s latest “Deadline Update” report released Thursday, college applications for the 2024-25 admissions cycle continue to show strong growth, particularly among underrepresented and first-generation students.

    The report, which analyzes application data through March 1, 2025, reveals that 1,390,256 distinct first-year applicants submitted a total of 8,535,903 applications to 863 returning Common App member institutions—marking a 4% increase in applicants and a 6% increase in total applications compared to the same period last year.

    One of the most significant trends is the substantial growth among underrepresented minority applicants, which increased by 12% over last year. Specifically:

    • Latinx applicants rose by 13%
    • Black or African American applicants increased by 10%
    • The share of domestic applicants identifying as Black or African American grew from 13.3% to 14%
    • White applicants’ share of the applicant pool continued its long-term decline, dropping from 48.2% to 45.7%

    First-generation college students showed remarkable growth, with a 13% increase in applicants while continuing-generation applicants remained flat. Similarly, applicants eligible for Common App fee waivers increased by 9%, compared to just 2% for non-eligible students.

    Students from lower-income communities also made strong gains:

    • Applicants from ZIP codes with below-median household incomes increased by 8%
    • Applicants from above-median income ZIP codes grew by only 3%

    The report highlights several notable geographic patterns:

    • The Southwestern region experienced the fastest growth at 34%
    • Texas led state-level growth with a 37% increase in applicants
    • District of Columbia applicants grew by 18%
    • For the first time since 2019, domestic applicant growth (5%) outpaced international applicant growth, which declined by 1%

    Applications to public institutions grew at 10%, significantly outpacing the 2% growth rate for private institutions. Additionally, less selective institutions (those with admit rates above 25%) saw application growth of 6-7%, while the most selective institutions (admit rates below 25%) experienced the slowest growth at 4%.

    For the first time since the 2021-22 season, applicants reporting test scores (up 11%) outpaced those not reporting scores (down 1%). This reversal comes despite minimal change in the proportion of institutions requiring test scores (increasing only from 4% to 5% of member schools).

    This comprehensive report offers valuable insights into college application trends as institutions finalize their incoming classes for the 2025-26 academic year. A more detailed analysis is expected in August when Common App releases its full end-of-cycle report.

    Source link

  • How to Unlock Graduate Enrollment Growth [Webinar]

    How to Unlock Graduate Enrollment Growth [Webinar]

    Your graduate programs should be thriving, but if you’re relying on outdated outreach tactics, you’re leaving enrollments on the table. Today’s grad students expect more personalization, relevance, and connection. And if you’re not aligning with their needs, another institution will. The only way to meet them where they are is by asking the right questions and getting real answers. That’s exactly what Collegis Education and UPCEA did, and now we’re pulling back the curtain to share what we found.

    Unlock Graduate Enrollment Growth
    Proven Strategies for Engaging Graduate Students
    Date
    : April 8, 2025
    Time: 2:00 pm (Eastern) / 1:00 pm (Central)

    Tracy Chapman

    Chief Academic Officer

    Collegis Education

    Headshot of Bruce Etter

    Bruce Etter

    Senior Director Research & Consulting
    UPCEA

    Join Tracy Chapman, Chief Academic Officer at Collegis Education, and Bruce Etter, Senior Director of Research & Consulting at UPCEA, for their upcoming webinar “Unlock Graduate Enrollment Growth: Proven Strategies for Engaging Graduate Students.” In this session, they’ll reveal some surprising discoveries about graduate enrollment and the factors that drive impact and growth.

    • Graduate student needs and expectations
    • Why grad students disengage during their enrollment journey
    • What information grad students are willing to give you and when
    • How to best communicate and reach graduate students actively evaluating programs
    • Presidents
    • Provosts
    • Enrollment leaders 
    • Marketing leaders

    At the end, we’ll leave room for questions and conversion, and all attendees will receive a copy of the entire research report. 

    See you on April 8! 

    Source link

  • International Student Aspirations Increasingly Align With The Skills Needed To Propel UK Growth, ApplyBoard’s Internal Data Shows

    International Student Aspirations Increasingly Align With The Skills Needed To Propel UK Growth, ApplyBoard’s Internal Data Shows

    • Justin Wood is Director, UK at ApplyBoard.

    Millions of international students have used the ApplyBoard platform to search for international study opportunities.[1] For many of these students, searching for courses in Australia, Canada, Ireland, the United Kingdom, and the United States is one of the first steps in their study abroad journey. This proprietary search data reveals a leading indicator of changing student preferences.

    What UK Fields of Study did International Students Search for in 2024?

    After the Sunak Government announced the tightening rules on international student dependants and a review into the graduate route, the UK saw a significant contraction in interest from international students in 2024—applications declined by 14% year-over-year, while dependant applications dropped by 84%. The good news for a struggling sector is that early signs point to positive momentum in 2025, with higher enrolments for many of the institutions that offer a January intake. Enroly data suggests a 23% increase in January 2025 compared to January 2024, and ApplyBoard has experienced growth at three times this rate.

    ApplyBoard’s search trends reinforce these early signs: interest in UK courses jumped 25% in 2024 vs. 2023. With search behaviour often signaling future application trends, this surge suggests the UK’s positive momentum in early 2025 could continue throughout the year. Beyond this overall growth, shifting field-of-study preferences highlight how international applicants are adapting to the UK’s changing landscape:

    Health fields saw the largest proportional increase among UK searches, climbing nearly four percentage points to 12.8% of all searches. This growing interest aligns with the UK’s expanding healthcare sector, which is projected to add 349,000 jobs by 2035, growing 7% from 2025. Likewise, the information technology sector is expected to grow 8% over the next decade, which aligns with shifting student preferences—ApplyBoard platform data shows Engineering and Technology accounted for 17% of searches in 2024, up two percentage points year-over-year.

    Interest in the Sciences also expanded, rising from 13% in 2023 to 16% in 2024. Alongside the gains in Health and Engineering and Technology, this shift underscores how international student priorities are increasingly aligning with long-term global workforce demands.

    How International Students are Navigating UK Study Fields

    This alignment comes at a time when interest in UK courses is rising. Interest in UK courses grew significantly among several key student populations in 2024, with searches from students in Bangladesh, Sri Lanka, Ghana, and Saudi Arabia doubling year-over-year. Meanwhile, student searches from Nigeria and Pakistan saw substantial gains, rising 66% and 40%, respectively. However, searches from Nepalese students experienced the most dramatic increase, with searches tripling compared to 2023.

    Further supporting the possibility that the UK’s positive momentum in January 2025 will continue throughout the year, searches from most key student demographics reached an all-time monthly high in either December 2024 or January 2025.

    The graphic below illustrates how major student populations explored different fields of study in the UK on the ApplyBoard platform last year:

    Student interest in Health fields was strongest among Ghanaian (22%), Nigerian (20%), and Saudi Arabian students (16%). Compared to the previous year, the share of searches for this field rose by six percentage points among Ghanaian students and five percentage points among Nigerian students. Additionally, the proportion of Health searches among Sri Lankan students doubled over this period.

    By comparison, the Sciences were a priority across all nine student populations, making up at least 14% of UK course searches. Students from Pakistan (18%), Saudi Arabia (18%), and Bangladesh (16%) had the highest proportion of Science-related searches. Notably, seven of the nine key student populations devoted a greater share of their searches to the Sciences in 2024 than in the previous year.

    Engineering and Technology also accounted for at least 14% of searches among these major student populations, although Sri Lankan (29%), Saudi Arabian (26%), and Chinese (23%) students showed the highest engagement in this field. Additionally, eight of the nine key student populations allocated a larger share of their searches to Engineering and Technology in 2024. As student interest in UK courses continues to grow, institutions can strengthen their appeal by aligning their portfolio with evolving student priorities and workforce needs.

    The UK’s Edge: Where Student Interest Outpaces Canada and the US

    Understanding where the UK sees higher proportional interest in key fields of study compared to Canada and the US can reveal important competitive advantages for institutions and better inform strategic recruitment strategies. This interactive visualization allows you to explore student interest by field and destination, filterable by top student populations:

    Health-related fields accounted for 25% of searches for UK institutions among Filipino students—three percentage points higher than their searches for Canada and the US. Likewise, 22% of Ghanaian students were interested in UK-based Health courses, outpacing the interest shown for both Canadian (21%) and American (20%) options.

    In Engineering and Technology, 29% of Sri Lankan students’ searches for UK courses were in this field—matching their interest in US study but well surpassing their searches for Canada (24%).

    Social-related fields like Law, Social Sciences, and Teaching captured 10% of Pakistani searches for the UK, outpacing that for Canada (6%) and the US (7%). A similar trend occurred among Bangladeshi students, with 10% of their UK-based searches occurring for social-related fields compared to 7% of Canada and 6% for the US.

    Leveraging Search Trends to Shape Future Recruitment

    Search trends serve as a leading indicator of shifting student interest, often signaling future application patterns. The surge in searches for UK courses—particularly in high-demand fields like health, engineering, and sciences—suggests a growing alignment between student priorities and workforce needs. By analysing these trends, institutions can proactively refine course offerings and recruitment strategies to attract top international talent. As demand continues to evolve, leveraging real-time search insights enables institutions to stay ahead of market shifts, ensuring they meet student expectations while strengthening their global competitiveness. Understanding where the UK holds a competitive edge will be key to optimizing outreach and course development in 2025 and beyond.


    [1] In the past, ApplyBoard platform search data was generated based on button clicks on a page, while the new search data is generated by any changes made to the page’s filters (destination, field of study, etc.) As a result, the new search count, if tallied using the previous search data approach, would be significantly inflated compared to the original search count. To make the search counts more comparable, we changed our methodology as of August 2024 to use unique entries per user within each hour.

    Source link

  • Spring 2025 Inclusive Growth and Racial Equity Thought Leadership Lecture Series (Howard University)

    Spring 2025 Inclusive Growth and Racial Equity Thought Leadership Lecture Series (Howard University)

    Scheduled for Feb 20, 2025. The Spring 2024 Inclusive Growth and Racial Equity Thought Leadership Lecture Series will feature a fireside chat with Dr. Ibram X. Kendi, Andrew W. Mellon Professor in the Humanities, Professor of History, Director of the BU Center for Antiracist Research, and National Book Award-winning Author.


    Source link

  • Embracing a growth mindset when reviewing student data

    Embracing a growth mindset when reviewing student data

    Key points:

    In the words of Carol Dweck, “Becoming is better than being.” As novice sixth grade math and English teachers, we’ve learned to approach our mid-year benchmark assessments not as final judgments but as tools for reflection and growth. Many of our students entered the school year below grade level, and while achieving grade-level mastery is challenging, a growth mindset allows us to see their potential, celebrate progress, and plan for further successes amongst our students. This perspective transforms data analysis into an empowering process; data is a tool for improvement amongst our students rather than a measure of failure.

    A growth mindset is the belief that abilities grow through effort and persistence. This mindset shapes how we view data. Instead of focusing on what students can’t do, we emphasize what they can achieve. For us, this means turning gaps into opportunities for growth and modeling optimism and resilience for our students. When reviewing data, we don’t dwell on weaknesses. We set small and achievable goals to help students move forward to build confidence and momentum.

    Celebrating progress is vital. Even small wins (i.e., moving from a kindergarten grade-level to a 1st– or 2nd-grade level, significant growth in one domain, etc.) are causes for recognition. Highlighting these successes motivates students and shows them that effort leads to results.

    Involving students in the process is also advantageous. At student-led conferences, our students presented their data via slideshows that they created after they reviewed their growth, identified their strengths, and generated next steps with their teachers. This allowed them to feel and have tremendous ownership over their learning. In addition, interdisciplinary collaboration at our weekly professional learning communities (PLCs) has strengthened this process. To support our students who struggle in English and math, we work together to address overlapping challenges (i.e., teaching math vocabulary, chunking word-problems, etc.) to ensure students build skills in connected and meaningful ways.

    We also address the social-emotional side of learning. Many students come to us with fixed mindsets by believing they’re just “bad at math” or “not good readers.” We counter this by celebrating effort, by normalizing struggle, and by creating a safe and supportive environment where mistakes are part of learning. Progress is often slow, but it’s real. Students may not reach grade-level standards in one year, but gains in confidence, skills, and mindset set the stage for future success, as evidenced by our students’ mid-year benchmark results. We emphasize the concept of having a “growth mindset,” because in the words of Denzel Washington, “The road to success is always under construction.” By embracing growth and seeing potential in every student, improvement, resilience, and hope will allow for a brighter future.

    Latest posts by eSchool Media Contributors (see all)

    Source link

  • Rachel Reeves and the Oxford-Cambridge Arc: Right time. Right place. Long live the Growth Corridor!

    Rachel Reeves and the Oxford-Cambridge Arc: Right time. Right place. Long live the Growth Corridor!

    The idea of a growth corridor between Oxford and Cambridge announced today is not new. Our region was fortunate with the announcements today: being ready, and in the right place at the right time armed with a good piece of policy background from Public First and Rachel Wolf.   

    While it has had many changes of name and cast, the idea of connecting this region has been around for at least 25 years. The idea has waxed and waned as it has acted as the poster child for Coalition, Tory and now Labour governments. It is estimated the Corridor could boost the economic contribution of the region by up to £78 billion, so has formed the centrepiece of the speech on growth given by Chancellor, Rachel Reeves. The Chancellor is going for growth in the Oxford-to-Cambridge Growth Corridor (formerly known as the Corridor, Arc, Region and now Corridor) with the ingredients of world-class companies with world-class talent and research and development.  

    It may even feel as if the Arc Universities Group – ‘working together towards inclusive and sustainable economic growth in an area of designated national economic significance’ – was formed in 2018 in anticipation of such a moment. This is a very long-term project which promises to bear fruit in 30-to-50 years. Universities are able to understand and span such timeframes. My own involvement, for a mere seven years, is transitory and many others have come and gone.  

    The universities in our region, and the relationships that they enjoy with industry and others, have played a pivotal role. There are several reasons for this, including:  

    1. We have been able to act as the honest broker and use our convening power to bring together people and conversations.  
    2. There has been a lot to learn as we face adaptive and existential challenges and these are the stock of universities.  
    3. We are largely independent in our actions, able to tell it how it is, free from the pressures of the electoral cycle or the vicissitudes of policy change. 
    4. Our universities have maturity of governance and stability of leadership, with vice-chancellors serving for at least five years, whereas Secretaries of State sometimes last only a few weeks. 
    5. The region, like many others, hosts a great diversity of institutions. The missions of our members are complementary  in their offering.  
    6. There is significant scale and influence with universities often being the biggest employers. With the benefit of money from the Higher Education Innovation Fund (HEIF), we have been able to act quickly and take risks that others have not and we have been able to hold the space while other processes catch up. 
    7. We have developed a great interface with industry and the private sector. 
    8. Partnerships: Perhaps the most valuable outcome of working in the wings for so many years is the alliances that have been formed between actors. We have formed a strategic alliance with East West Rail, with the private sector and with the sub-regional transport body, as well as the pan-regional partnership.  
    9. More recently we have cemented the relationship between universities and the private sector, in the formation of the Supercluster Board. 

    As our Chair, Alistair Fitt, the Vice-Chancellor of Oxford Brookes University and Chair of the Arc Universities Group, has reflected: 

    This region hosts a great diversity and scale of universities. Together we offer a wide range of key contributions: globally renowned research brilliance, the powerhouse of skills provision provided by cutting edge teaching, world-class knowledge transfer and commercialisation. Our universities, working in close partnership, in alliance with others – particular the private sector – are organised into the Arc Universities Group. We stand ready for the challenge. We welcome the oversight and experience that the leadership of Sir Patrick Vallance brings to the region, and we look forward to helping deliver the Chancellor’s aspirations for growth.

    The Supercluster Board (SCB) has been formed to ensure the UK can achieve its ambition to become a science and technology superpower. The SCB comprises a group of globally recognised scientific enterprises, investors and world-leading universities alongside the local enterprise partnerships, all of which have a vested interest in the region and will seek to work constructively with a wide range of stakeholders, including the UK Government, to deliver on the ambition for the Oxford-Cambridge Growth Corridor. 

    There is significant representation on this new group, with four university representatives on the main board, including Alistair Fitt, and with an expert panel comprising all the vice-chancellors or their near proxy. It is the private sector voice that has succeeded in landing the message about the region’s potential with Rachel Reeves.  

    I’m grateful to the many colleagues who have kept the faith. It is not always been easy, especially given the recent financial constraints, but the future looks promising and we can be greatly encouraged by the Chancellor’s recognition of the potential. The next challenge will be to see how we all deliver under the sudden power of the spotlight that will inevitably follow the announcements.  

    The photo accompanying this blog on the HEPI website is taken from https://www.gov.uk/government/publications/oxford-cambridge-arc/oxford-cambridge-arc

    Source link

  • Understanding Digital Marketing Strategy and Costs to Effectively Budget for Growth

    Understanding Digital Marketing Strategy and Costs to Effectively Budget for Growth

    In today’s digital-first world, higher education institutions are increasingly turning to digital marketing to educate, engage, enroll, and retain students. However, one of the key challenges that the campus decision-makers face is understanding the potential costs associated with digital marketing and how to effectively budget for growth.

    As someone deeply immersed in the world of digital strategy, I often find myself having the same conversation with campus leaders: how do we set realistic expectations about what it really costs to do effective digital marketing? And more importantly, how do we directly link those costs with your institution’s growth objectives? In this blog, I will highlight the key data-driven strategies for assessing ROI and how these strategies inform a strategic budget plan that strengthens your institution’s overall portfolio and drives sustainable growth.

    The importance of setting realistic expectations

    Success in higher education landscape, particularly when managing a large portfolio, is driven by a disciplined, metrics-oriented approach. From my experience, the institutions that excel are those that rely on crisp numbers, rigorously evaluate their plans ahead of time, and understand the value of projections and estimations. By leveraging detailed forecasts and aligning resources accordingly, we can navigate the complexities of enrollment growth with precision and confidence, always mindful that incremental progress, evaluated at every stage, is key to achieving long-term goals.

    Setting expectations means recognizing that significant results take time and careful planning. This translates to setting realistic growth expectations based on an understanding that reaching your enrollment goals will take multiple academic terms. When I am collaborating with our partners, we adopt a structured five year growth trajectory where Year 1 serves as the “foundational” phase, establishing the core infrastructure and strategic alignment. Year 2 is focused on “scaling,” optimizing initial investments to drive measurable growth. Years 3 and beyond are dedicated to “sustained value creation,” with a continuous focus on refining processes and maximizing returns through ongoing optimization and strategic enhancements. This phased approach allows for calculated risk-taking and ensures a clear path to long-term, scalable success.

    Chart showing 5-year projected growth for digital leads with 20%YoY growth

    Once we’ve set realistic expectations for our digital strategy, it’s crucial to ensure that every tactic -whether paid digital marketing, SEO, or creative content, all work together seamlessly to achieve your goals. These elements don’t function in isolation; rather, they complement each other to drive greater visibility, engagement, and, ultimately, enrollments. A well-rounded strategy that integrates SEO to boost discoverability, paid digital marketing for targeted reach, and compelling content to engage prospective students will create a strong foundation for success. By understanding how these components interrelate, you’ll be better equipped to assess their effectiveness and make data-driven adjustments as needed.

    From here, let’s dive into how digital strategy translates into budget planning and ROI. Understanding the interconnectedness of these key elements will help you allocate resources more efficiently and set a clear path for measuring the success of your investments.

    Connecting strategy to ROI and crafting a strategic budget plan for growth

    The connection between strategy and ROI is grounded in the ability to align your digital marketing efforts with measurable outcomes, and it all starts with the establishment of clear and precise enrollment goals. Prioritizing top programs ensures that marketing resources are directed toward the areas with the highest demand or growth potential, improving overall program performance. The right channel mix is crucial to reaching the right audience, maximizing visibility, and efficiently converting interest into applications. Monitoring data and optimizing it in real-time ensures that marketing efforts are continuously adjusted for maximum effectiveness, enhancing the likelihood of meeting targets and improving ROI. Finally, effective allocation based on application timing, seasonality projections, and market revisions allows for strategic adjustments in campaigns to account for fluctuating demands, ensuring marketing spend is optimized throughout the enrollment cycle. Collectively, these elements create a robust framework for maximizing ROI, ensuring that marketing investments lead to increased applications, conversions, and, ultimately, student enrollment.

    Graphic of connecting digital marketing strategy to ROI: Enrollment Goal Mapping, Program Prioritization, Channel Mix Strategy, Monitor&Optimize, App Deadlines and Scaling UpGraphic of connecting digital marketing strategy to ROI: Enrollment Goal Mapping, Program Prioritization, Channel Mix Strategy, Monitor&Optimize, App Deadlines and Scaling Up

    How do you craft a budget that supports your growth goals? Whether you are the decision-making authority or a decision influencer, here are the essential steps to craft a budget plan that aligns with your institution’s growth objectives and maximizes your enrollments:

    1. Define your enrollment goals in detail

    When you think of marketing costs, what comes to mind first? How much will it cost to meet your enrollment goals, right? So, your first step in planning a budget is to have your overall Enrollment goal (and, for graduate or online programs, a goal for every program) in front of you. With the goal (or program-level goals) in hand, determine what that means in terms of percentage growth from the current state. You may also have subsidiary goals like enhancing brand awareness, building more brand equity, or engaging alumni. If these are going to be part of your plan, they should also have tangible goals for what you are trying to do. Defining your enrollment goals helps you allocate your budget accordingly and measure ROI effectively.

    STRATEGY TIP

    Develop a “Goal Mapping” Scenario or you can say a Reverse Funnel (for each program). After you set enrollment goals (for the year or the term) you then need to understand the lead to enroll ratio. This will help you work backwards to determine how many accepted apps/admits will be needed, how many completed apps, how many submitted apps, and finally how many qualified leads will be needed. Based on the program category, dig deeper into what the Cost per Leads (CPL’s) are, based on industry benchmarks. That will help you calculate the estimated ad spend needed to generate those qualified leads.
    Goal Mapping for digital marketing: 1. Qualified Inquiry 2. Submitted Application 3. Completed Application 4. Admitted StudentGoal Mapping for digital marketing: 1. Qualified Inquiry 2. Submitted Application 3. Completed Application 4. Admitted Student

    A note on program-level goals: If you don’t have program-level enrollment goals for your online and graduate programs, finalize those as soon as possible. Until then, focus marketing on building brand awareness. It is likely that people in your own backyard could be less familiar with your program than you may think they are. Brand advertising will ensure that awareness rises so that when you have your program goals, you can build your campaigns on a higher level of familiarity with your institution. However, given that Google reports that 75 percent of graduate and online program searches don’t include an institution name, remember that branding alone will not be enough to fill your classes.

    Institutional example: When we began work with one of our partners nearly two years ago, they had not established program-level goals. So, in year one, we focused the largest portion of the budget on institutional awareness, with mini-campaigns focused on specific programs of importance to the institution. By the beginning of the second year, the institution had set program-level goals based on a greater understanding of market conditions. At that point, we began transitioning our campaigns to focus (ultimately 80 percent of the budget) on the programs with the “mini campaign” focused on continuing the brand equity efforts.

    2. Prioritize your programs

    It is highly unlikely that most institutions can spend marketing dollars on every program they offer. This means that in order to maximize the ROI of your marketing budget, you must prioritize your programs. But how? Take a data-driven approach, prioritizing programs for which you a) know there is market demand both among students and employers, and b) understand the competitor environment. These are the “cash cows” that will demonstrate the best ROI on your marketing spend and support the programs that, while not demonstrating significant market demand, are critical to the institutional mission.

    STRATEGY TIP

    Spreading a $100K marketing budget across 15 -20 programs will only dilute the ad spend, by spreading it too thin. Instead, identify the top 5-7 programs that have the greatest market demand and focus on them. Note that sometimes, the programs that seem most in need of a “marketing boost”, really aren’t. They are struggling because their market demand situation is not what it once was.

    Institutional example: A partner institution recently commissioned RNL to conduct a Program Prioritization and Positioning study focused on their current program mix. The goal was to take a data-driven deep dive into 12 programs vying for marketing dollars, with a focus on understanding student demand and employer needs in the region. The results indicated that while one of the programs they had planned to prioritize came out on top, two others that they hadn’t been planning to focus on also demonstrated strong demand, and one of the programs that they had questioned was confirmed as having weak local market demand.

    3. Determine your channel strategy

    Once you have prioritized your programs for marketing ROI, setting your channel strategy is pivotal. Personas (at the graduate and online levels developed for each program) dictate the channels on which you should focus. You don’t want (or need) to be present on every single channel just for the sake of “eyeballs.” Be mindful of the budget and how best to use it in order to maximize return, which can only be accomplished if you apply the personas that will inform you where your target student spend their “digital time.” So, for example, not every program may benefit from marketing on LinkedIn. Since it is expensive with a $10 minimum ad spend, a persona-based approach may indicate that other platforms are a much better match. But you can only do this if you know the characteristics of your audience, and that comes from the program personas.

    STRATEGY TIP

    The critical element in increasing marketing ROI is to engage the right students at the right time on the right channel, without spreading your budget too thin. In contrast, being too invested in any single channel exclusively or too long is also almost always the wrong strategy. There is always a point of diminishing returns as students cycle to different platforms, and you want to be sure to know where to go next before you approach that point by being able to tap into the next new thing.
    Chart of program and channel performance for different degrees and channels.Chart of program and channel performance for different degrees and channels.

    Institutional example: One of our prestigious campus partners was struggling with recent market shifts that resulted in an overall decline in applications. We dug into market and performance data to help them prioritize programs that had the highest lead-to-enroll ratios, lowest cost per acquisition, and good search volume with an eye to increasing marketing ROI and overall success. This approach not only helped regain their momentum at the top of the funnel but also generated strong conversion volume that exceeded goals and sustainably reduced cost per conversion. These changes benefited not only the marketing operation but were also felt by the call center, and further down the funnel where we saw an increase in applications.

    Talk with our digital and enrollment experts

    We’re to help you find the right digital marketing and recruitment strategies. Let’s set up a time to talk.

    Contact us

    4. Analyze data regularly and optimize with agility

    If (quality) content is king, data is queen! Sustained growth can only occur when data and insights are continuously incorporated into strategy. Analyzing performance data is crucial to understanding which programs and channels are yielding the largest numbers of applications and enrollments and, hence, generating the best return on ad spend (ROAS). This type of analysis allows for a data-driven approach to strategic pivots on how the marketing budget is allocated to ensure the highest ROI (or ROAS) across channels and the program portfolio. As the cost of marketing has risen, so has the need for marketers to make an effective case to senior leadership for additional marketing dollars. You can only do this if you can demonstrate that you are the best possible stewards of current resources.

    STRATEGY TIP

    As you continue to increase your campaign efficiency and success with the focus on ROI, your cost per lead will gradually start to go down – on average by 5 – 10 percent in year 2 and beyond. So, campaigns can generate more qualified leads efficiently over the years (for the same cost), thereby maximizing the return on your ad spend (ROAS). This helps you not just grow but also helps in building forecasts and projections for growth compounded over several years – and it also provides a strong ROI-driven basis for any requests you may need to make for additional funds elsewhere.
    Cost-per-lead trends over one year, showing how current CPL has been greatly reduced from the previous year.Cost-per-lead trends over one year, showing how current CPL has been greatly reduced from the previous year.

    A note on analytics platforms: The fact that resources have become increasingly scarce at the same time as marketing costs have skyrocketed has resulted, out of necessity, in more sophisticated tracking of ROI. If your internal systems are set up in the correct manner (or if you are working with a strategic partner like RNL) every lead can be tracked to its source, thereby allowing for the assessment of just how effectively each marketing dollar has been used.

    Institutional example: A prestigious campus partner was having challenges with converting leads to applications and enrollments. We reviewed their full-funnel data (compete with attribution percentages) and realized something wasn’t working. The top of the funnel was healthy, with good lead volume. However, down the funnel we saw that a disproportionate number of leads were not converting to apps and enrollments. As a result of the review and data analysis, we made a bold strategic pivot to shift significant budget allocations to the channel (Google search) that we could see was producing the greatest numbers of applications and enrollments. Without the data, solving the challenge would have been impossible. With the data, it was easy. Since we made this change, applications, and enrollments have consistently increased each academic period.

    Graphic showing two circle charts and the reallocation of channel spend from Facebook as the largest channel to Google Search as the largest channelGraphic showing two circle charts and the reallocation of channel spend from Facebook as the largest channel to Google Search as the largest channel

    Making sure that the top of the funnel strategy is guided by down funnel numbers is the KEY! Effective strategy must evolve through ongoing optimizations with thoughtful placements across diverse media platforms that are informed by performance data. Remember that the path to enrollment is rarely linear and an integrated media strategy allows you to provide a personalized message in the right place at the right time.

    5. Understand and account for seasonality/application timings/expansion

    Another aspect of the dynamic nature of the marketing process relates to the seasonality of lead flow – and subsequent enrollment. This requires flexibility to adjust your strategies based on real-time performance data collected throughout the year. For any program or institution, there are times of the year during which more or fewer leads are generated. Fully understanding these trends takes time; you can make preliminary judgments on when the lead volume is highest and lowest within one year, but multiple years will allow for greater certainty. As you build your capacity to track lead generation – and conversion throughout the funnel – by program and source – you can create visualizations that map these factors by month. They can be used to build monthly budget allocations like those presented below.

    Bar chart showing budget allocation over the year for search, social, display, retargetingBar chart showing budget allocation over the year for search, social, display, retargeting

    Institutional example: For one campus partner we used the annual performance data in an innovative way. Our data insights indicated that there was more market share to capture, by having the program leverage low cost per conversion at the top of the funnel at certain points in the year, and low cost per acquisition at the bottom at other points of the year. There was time to scale up both applications and enrollments. We developed a forecast plan to address the potential areas of opportunity, calculated the cost, and pitched it to the partner. Once approved, we moved with agility, and implemented additional ad spend on the top champion programs and frontloaded the budgets for the academic periods yielding the highest number of applicants and enrollments. With this, we were not only able to meet the qualified lead goal but also exceeded the enrollments by 19% for the following academic period.

    The lifetime value of the student

    As you budget for growth, it’s crucial to consider the lifetime value (LTV) of a student. LTV refers to the total revenue a student generates throughout their academic journey and beyond. This value encompasses tuition fees, ancillary revenues (like housing and meal plans), alumni donations, and increasingly in our era lifelong learning opportunities.

    Talk with our digital and enrollment experts

    We’re to help you find the right digital marketing and recruitment strategies. Let’s set up a time to talk.

    Contact us

    Source link

  • 2024 Growth & Innovation | Collegis Education

    2024 Growth & Innovation | Collegis Education

    As 2024 draws to a close, the holiday season inspires gratitude and reflection. Personally, I’m very grateful for the incredible partners and colleagues I’ve had the privilege to work with this year. Together, we accomplished so much.

    • We collaborated with our partners throughout the year to deliver great experiences for their students, alumni, and staff.
    • We collectively navigated some of higher education’s biggest challenges, driving partner growth and enabling impact.
    • We pushed the boundaries of innovation, embracing the power of data-enabled technologies.

    I’m so proud of the positive impact the Collegis team generated with our partners across the entire student lifecycle, from the moment prospective students first inquire about a program to the day they graduate.

    Let’s look back at some of 2024’s meaningful results

    Recruitment and Enrollment Growth

    We supported double-digit year-over-year (YoY) enrollment growth –– as high as 57% –– for many partner institutions in first-year, program-specific, transfer, and graduate populations. Engagement from our enrollment teams was instrumental in connecting students with the right programs and guiding them through the admissions process.

    IT Managed Services and Student Support

    Our IT team ensured seamless operations, providing reliable technology solutions that empower students and faculty. Some of my favorite examples from 2024 include:

    • Integrating systems to drive process improvement across enrollment, financial aid, academics, and career services.
    • Modernized campus infrastructures and networks to drive student engagement at a college’s main hall.
    • Significantly improved student experience by implementing a user-friendly, single sign-on (SSO) solution across student-facing systems.
    • Led an institution through a critical component of its digital transformation journey by migrating its on-premise, legacy ERP to a cloud-based, next-generation solution.

    Innovative Learning Experiences

    Our instructional design team enabled partners to grow their online course offerings on platforms such as Brightspace, Canvas, Coursera, and Blackboard Ultra, including course and online library development, course migrations, maintenance, faculty support, and term start/end deployment activities.

    We collaborated with the nursing program at one partner to revamp the entire library of online courses to meet new accreditation standards. Another partner was able to add 200 online courses to fill the needs of 13 online programs at three schools.

    Marketing Impact

    Our web team conducted a user survey and other research to refine a partner’s website, which increased clicks to inquire by 82%, the request for information (RFI) click rate to 71%, and clicks to apply by 7.5%.

    Another shining example was uncovering a way to target a healthcare provider’s employees who are eligible for a tuition discount. Because of healthcare regulations, the partner could not provide an audience list, so Collegis addressed this niche audience using in-platform targeting tools available on social media platforms. The return on ad spend (ROAS) is 2.2:1 overall in 2024 with plans to expand the program next year.

    Student Success

    Our student support team provided essential services to help students thrive and continue to pursue their academic goals.

    • At a public, four-year institution in Ohio, Collegis Student Success Coaches helped new students with the registration process, driving admit-to-enroll numbers and YOY growth of +66% in Fall 2024.
    • At a private, four-year institution in Texas, Fall retention was 97%, with a 90% retention rate since the partnership launched.
    • At a private, four-year institution in New York, term-over-term retention from Summer to Fall is 96%, with a 91% average retention rate since the partnership launched.
    • At a public, two-year institution in the Pacific Northwest, Collegis helped drive the sixth consecutive term of enrollment growth, with Fall enrollment trending toward +8%.

    Research and Portfolio Planning

    Because we are ingrained in every step of the student lifecycle, partners often ask us to assist with forward-looking strategies. For example, our team helped a partner understand the pros and cons of expanding their full-time Accelerated Bachelor of Science in Nursing (ABSN) with a part-time program. With our marketplace analysis, recommendations for how to offer courses, and a marketing launch plan, the institution is currently accepting applications for Summer 2025.

    Another institution asked for Collegis’s assistance to develop a multi-year strategic approach to graduate enrollments. The partner’s team lead noted that, “[Collegis] led productive brainstorming and strategic planning sessions with the team. Their deep knowledge of graduate enrollment trends, market analysis for graduate programs and expertise in leading our team from conceptualization to the delivery of specific recommendations on our next steps were invaluable.”

    Strategic Innovation and Workshop Design

    Our strategy and solutions team helped colleges and universities unpack complex problems and find innovative, human-centered solutions. We architected and facilitated numerous design thinking workshops, guiding leadership teams through critical strategic discussions about the future of their institutions. I’ll let some of the participants of the workshops explain the value they got out of the sessions:

    • “Collegis didn’t just help us evaluate our processes — they led us on a journey to uncover areas of improvement we hadn’t even considered. Their expert guidance illuminated the path forward, empowering us to create a more positive, streamlined, and truly enjoyable student experience.”
    • “My team and I were thoroughly impressed with your ability to take what essentially was a speck of an idea and collaboratively ideate possibilities for [the university] to offer new academic programs and training to underserved high school populations.”
    • “Collegis took the time to meet with leadership prior to the sessions and came prepared to tackle the challenges at the college. The activities were well thought-out and allowed individuals time to really think about the core issues. Thanks to Collegis, I am hopeful that our college can make key changes that will benefit our student experience and lighten our faculty/staff workload.”

    Looking Forward

    As you can see, 2024 has been a year of growth, innovation, and collaboration. We are grateful for the opportunity to work with our partners and look forward to even greater achievements in the years to come.

    I’d like to extend my sincere gratitude to my Collegis colleagues, who amaze me with their creativity, expertise, and dedication to delivering exceptional results. I can’t wait to see what you do in 2025 to continue inspiring each other and driving growth for our partners.

    Happy Holidays and best wishes for a prosperous New Year!

    — Kim Fahey, CEO Collegis Education

    Source link

  • Slowing Growth and Uncertainty: A Look at IIE’s Open Doors Report 2024 and What the Future Might Hold

    Slowing Growth and Uncertainty: A Look at IIE’s Open Doors Report 2024 and What the Future Might Hold

    Bryce Loo, Associate Director of Higher Education Research

    International students navigate a landscape of uncertainty and opportunity, as the 2024 IIE Open Doors Report highlights shifting trends in U.S. enrollment and global migration.

    The Institute of International Education’s (IIE) annual Open Doors Report on International Education Exchange (Open Doors, for short),[1] along with its companion Fall Enrollment Snapshot Survey (Fall Snapshot Survey, for short),[2] was released only a few weeks after a consequential presidential election in which former president Donald Trump defeated Vice President Kamala Harris. Trump’s win will significantly shift the landscape around international students in the U.S.

    Open Doors is a retrospective report on international enrollment and other student data in the U.S., focused on the previous full academic year—in this case 2023-24.[3] The Fall Snapshot Survey provides insights into the current fall term. But uncertainty abounds in this new environment with the return of Trump, known for his tough stances on immigration, which may affect non-immigrant residents such as international students and temporary workers. This is happening against a backdrop of global uncertainty, in a year with a tremendous number of important elections around the world, many armed conflicts, and growing climate change. At the same time, there are bright spots for the U.S. as a host of international students and for global student migration in general.

    In this article, I also compare results from Open Doors and the Fall Snapshot Survey against recently released data from SEVIS (the Student Exchange and Visitor Information System), maintained by the Department of Homeland Security (DHS), for Fall 2024.[4] This dataset captures all students with a record in SEVIS, the U.S. government database in which all international students are required to be registered by their hosting U.S. institution. Data are organized monthly, with the most recently released is for November 2024, and they vary little month-to-month within a given term, such as a fall semester. For consistency, I compare November 2024 with November 2023. Such data help us to gain a fuller picture of current international enrollment trends this fall.

    What the data tell us: Continued but leveling growth

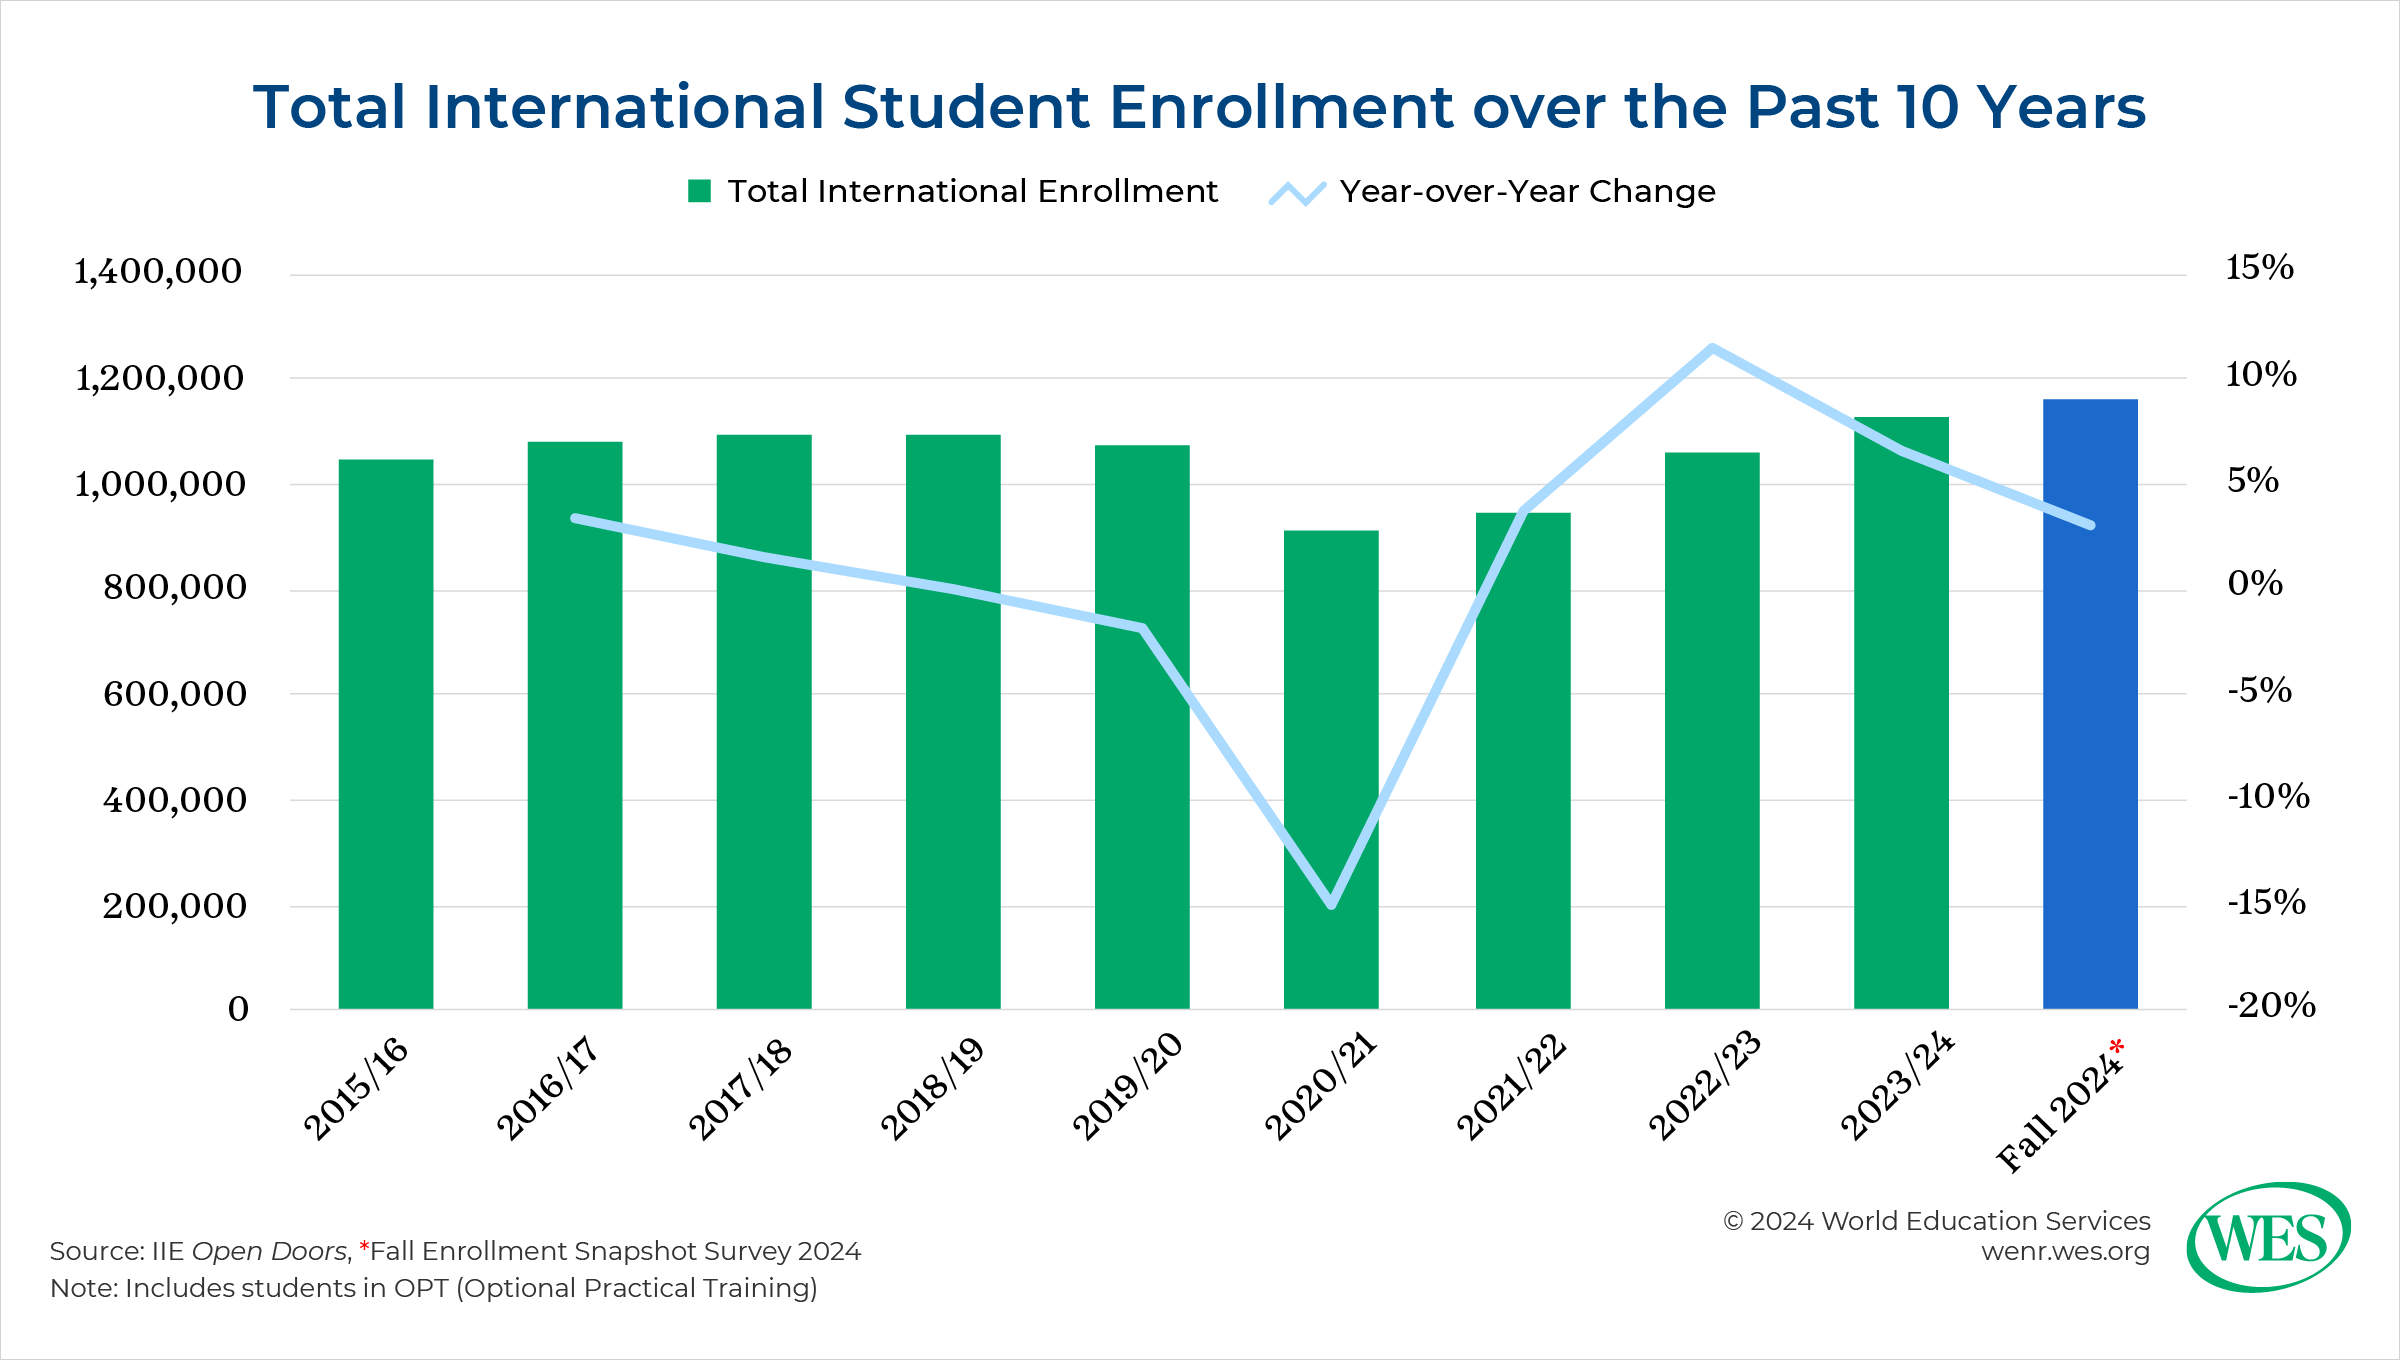
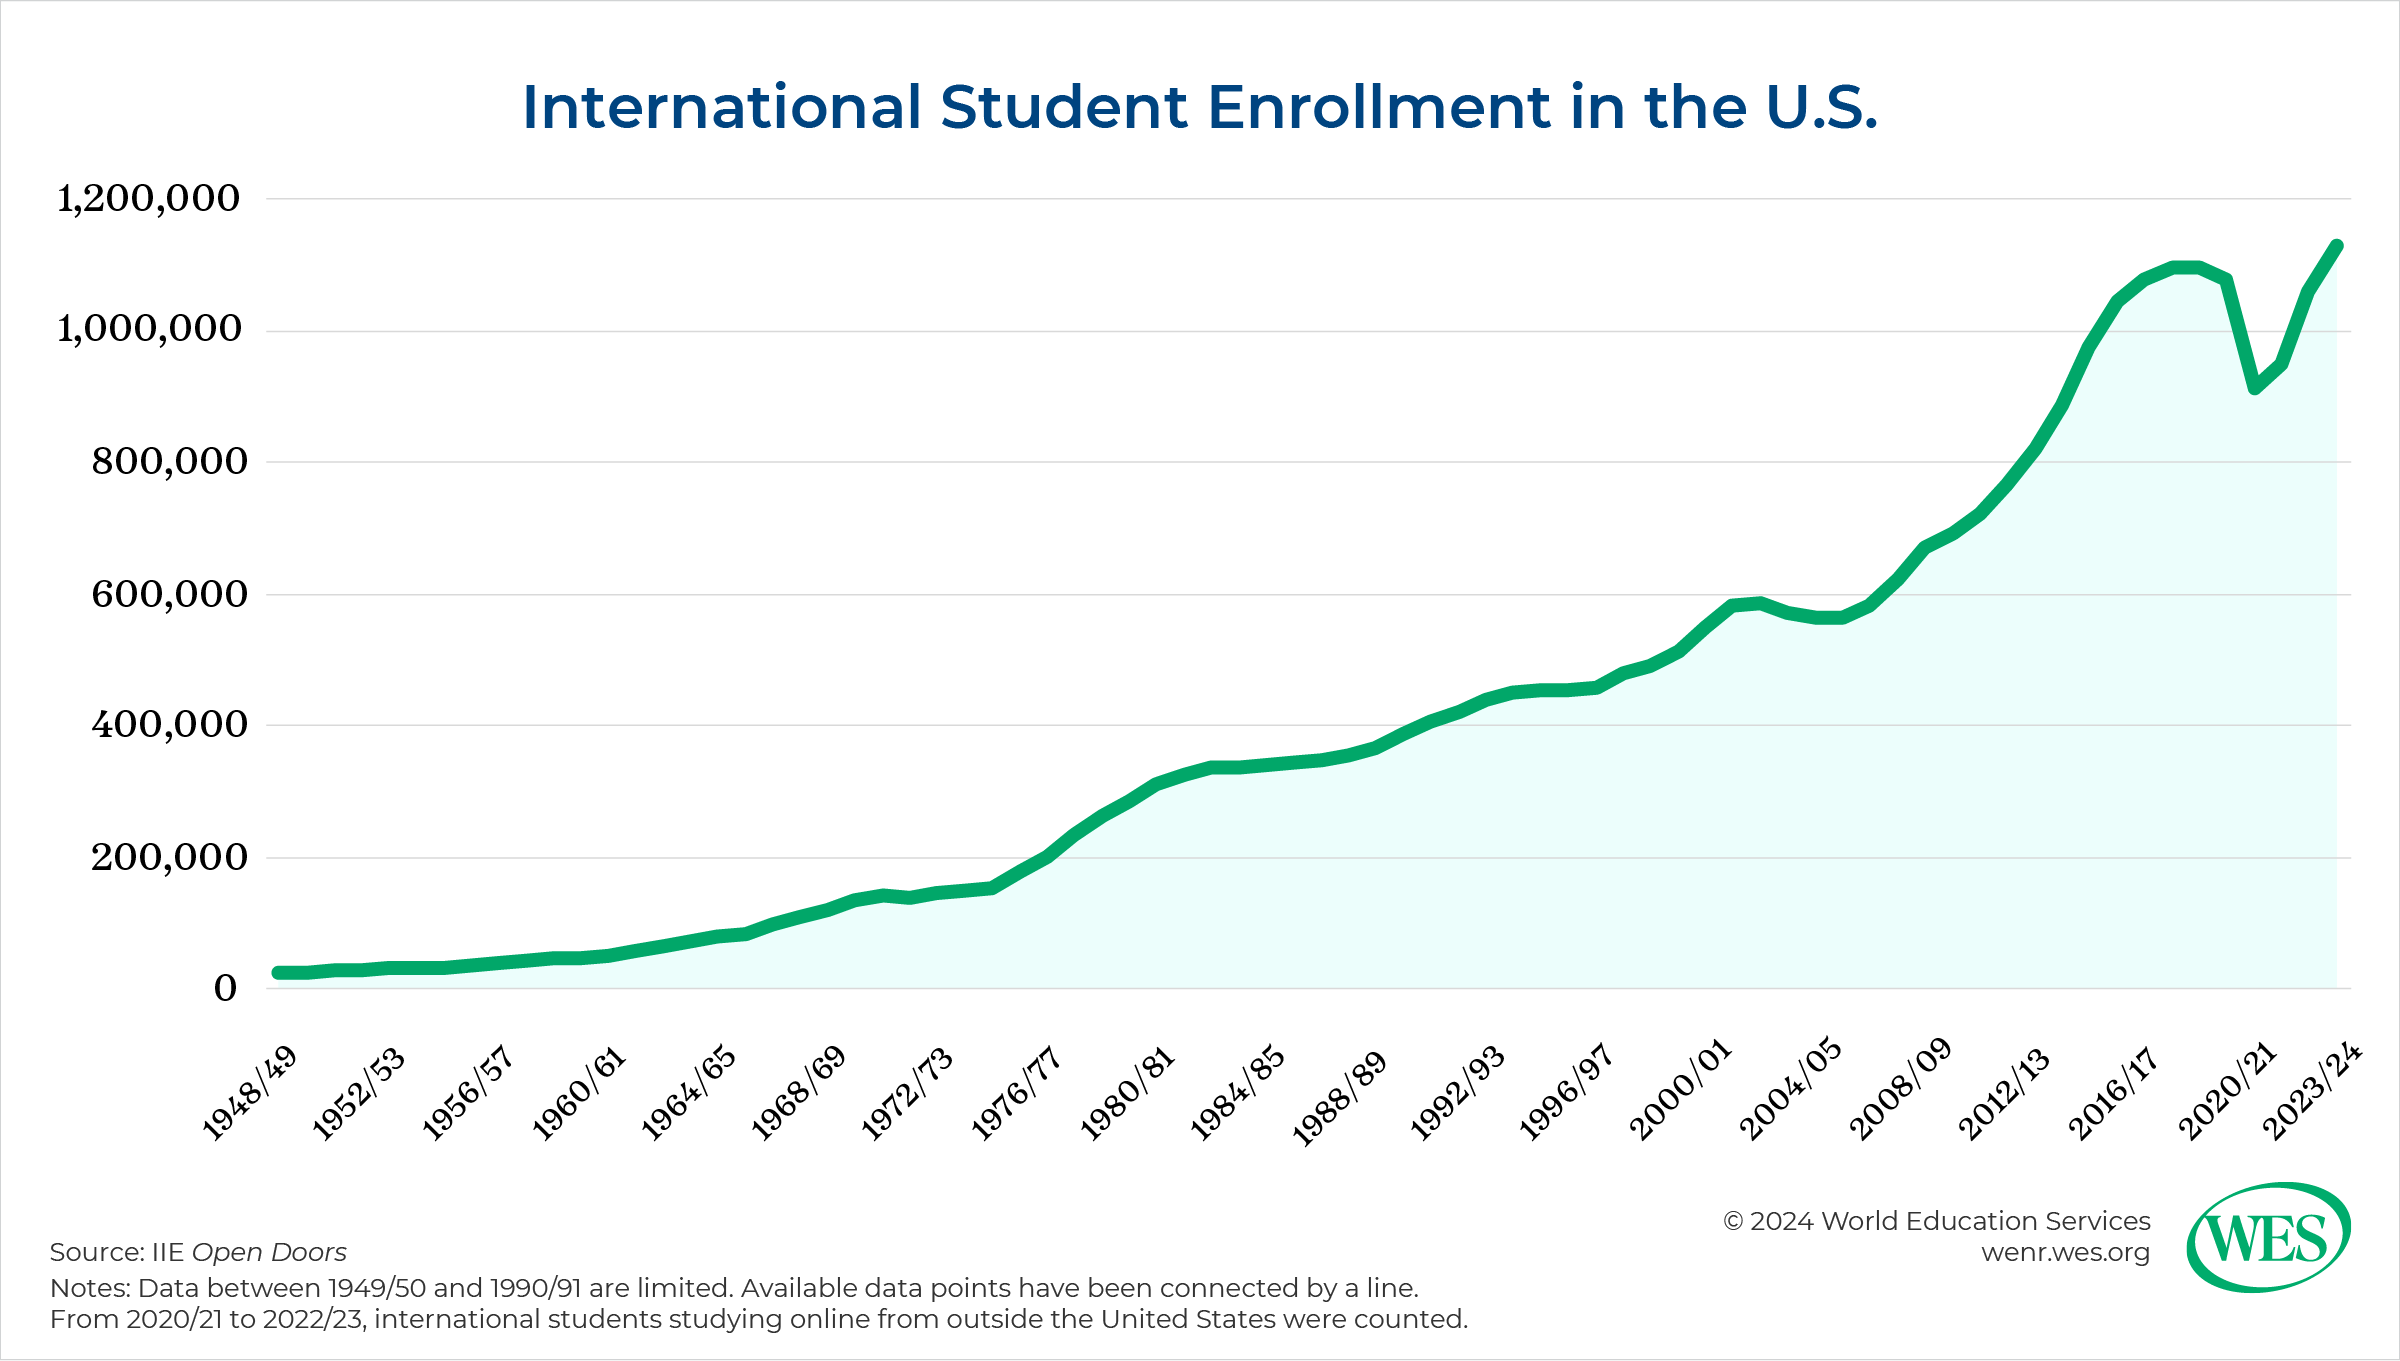
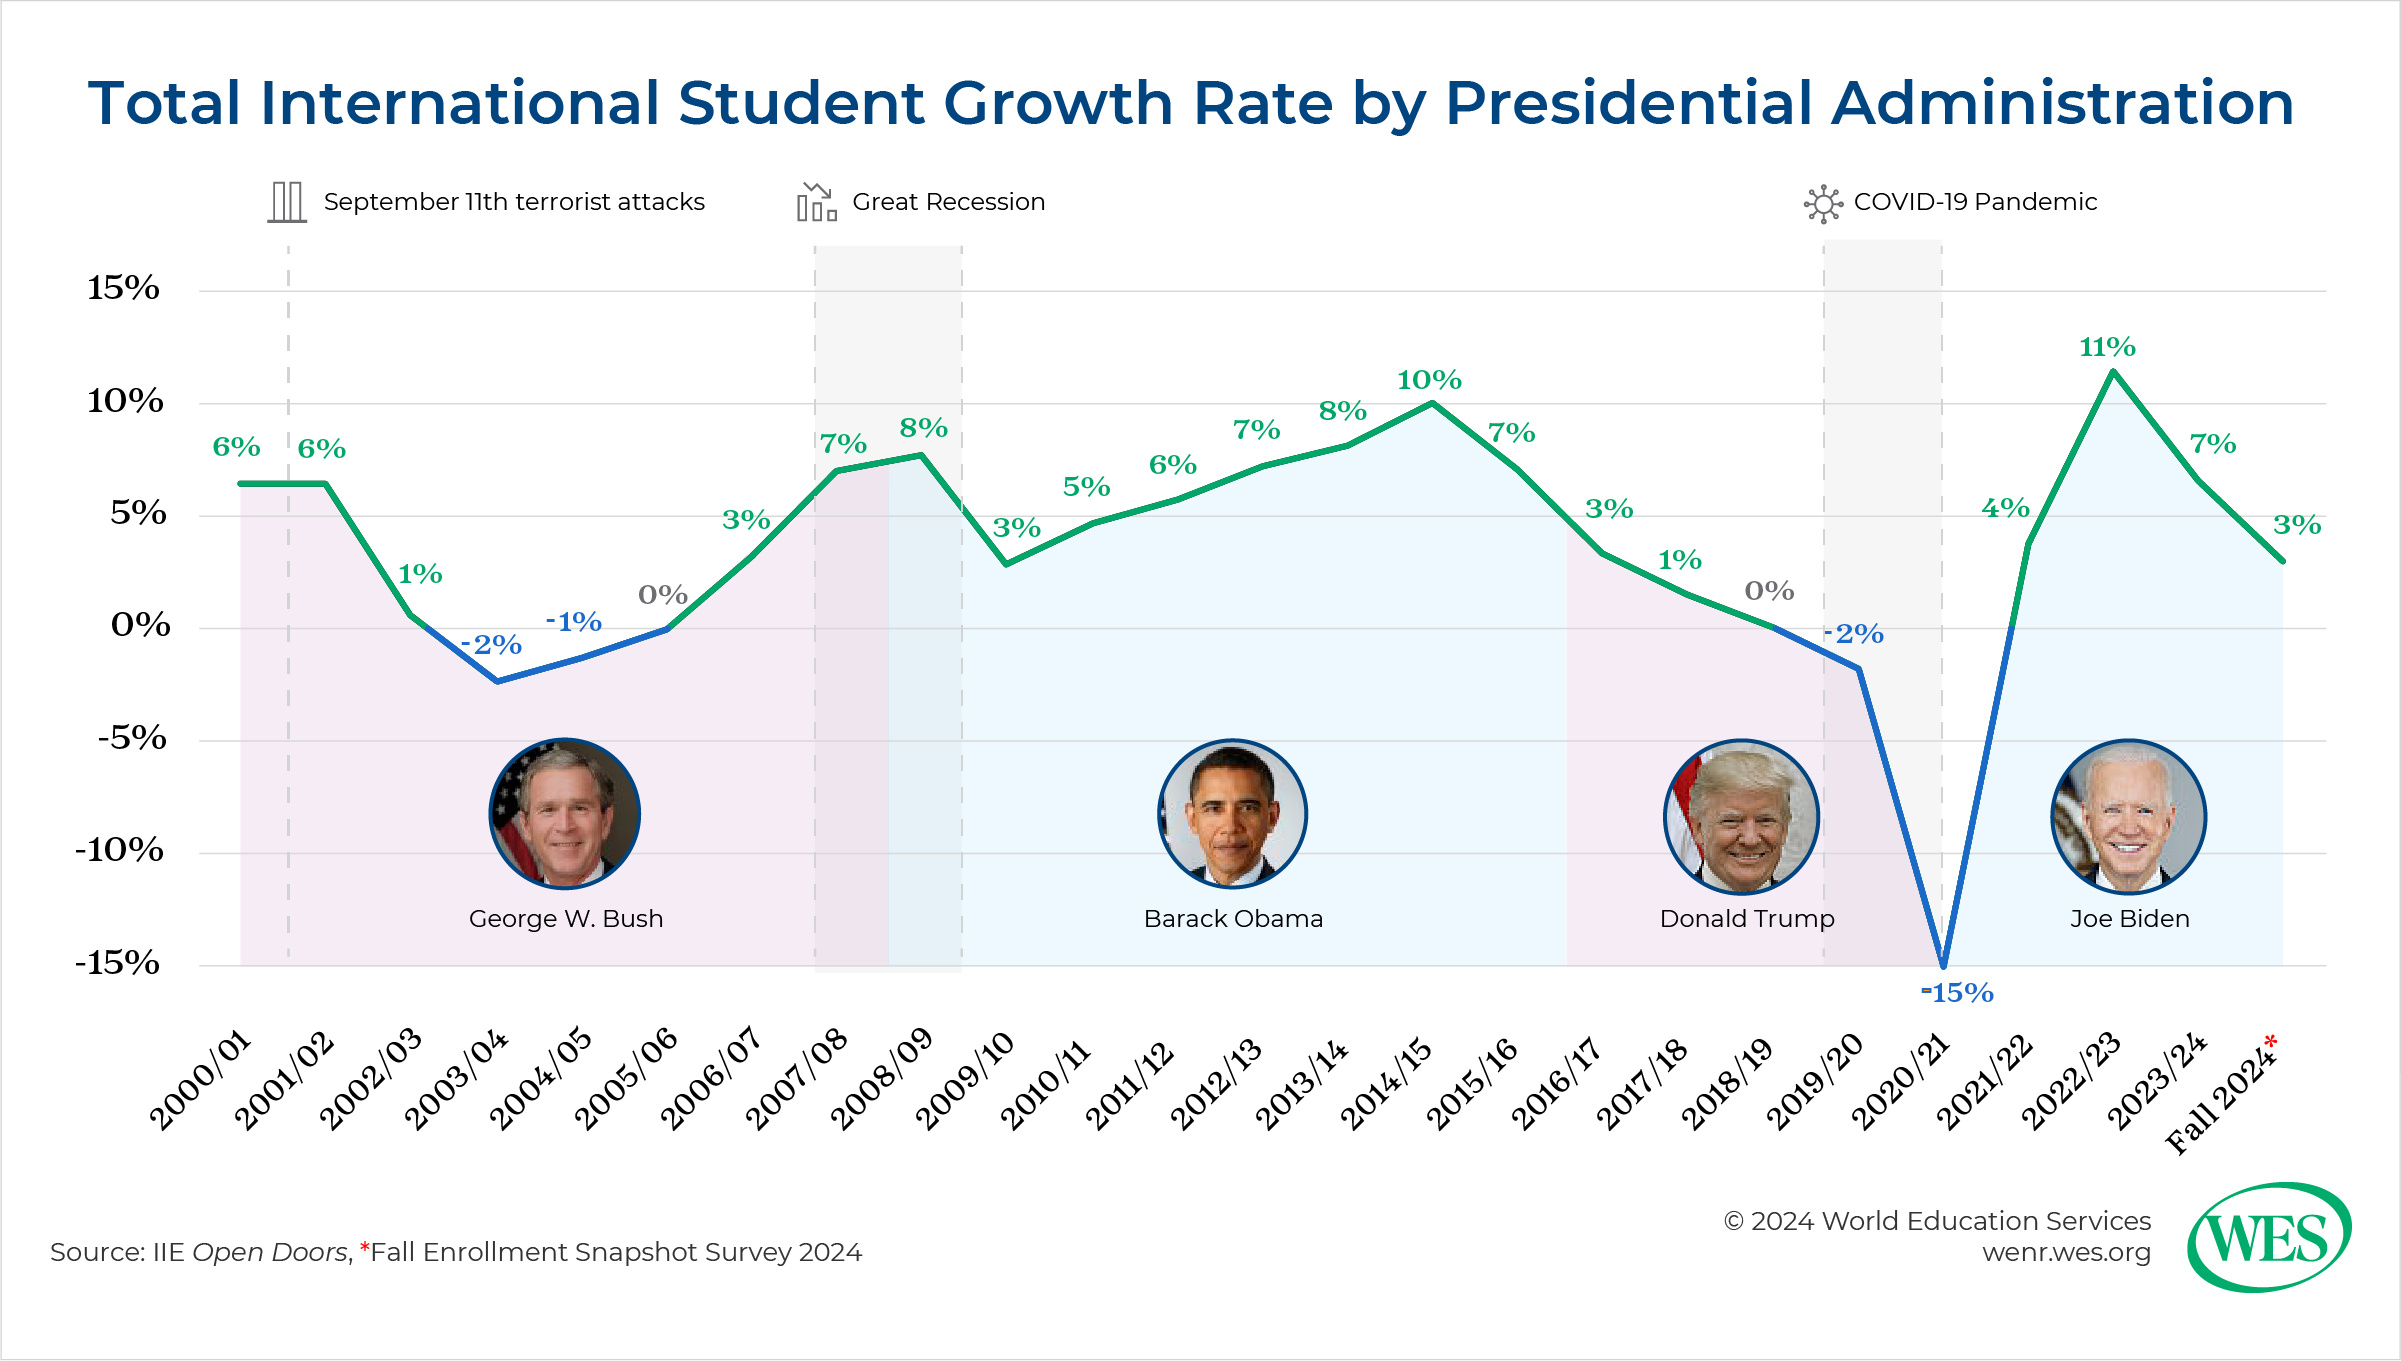
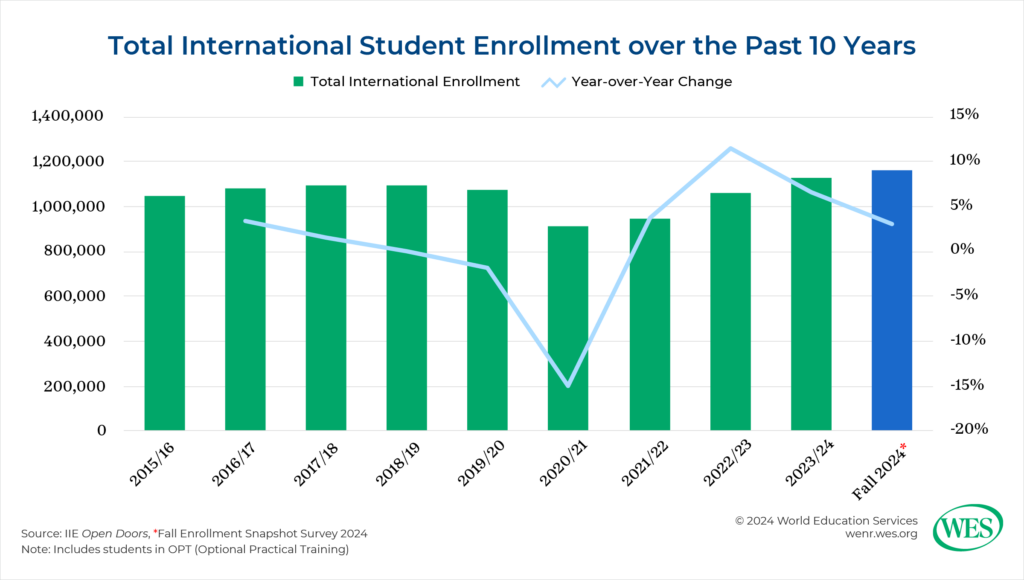
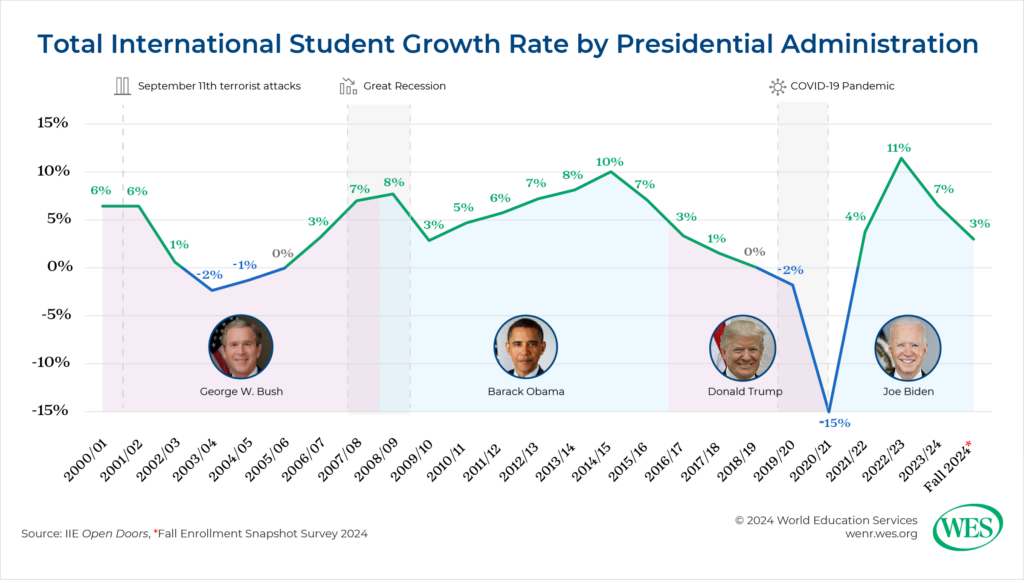
    Total international student enrollment in the U.S. hit an all-time high of 1,126,690 in 2023–24, a growth rate of 6.6 percent from the previous year. This has followed a few years of recovery following the dramatic enrollment decrease during the COVID-19 pandemic. The post-pandemic growth rate peaked in 2022-23 at 11.5 percent.

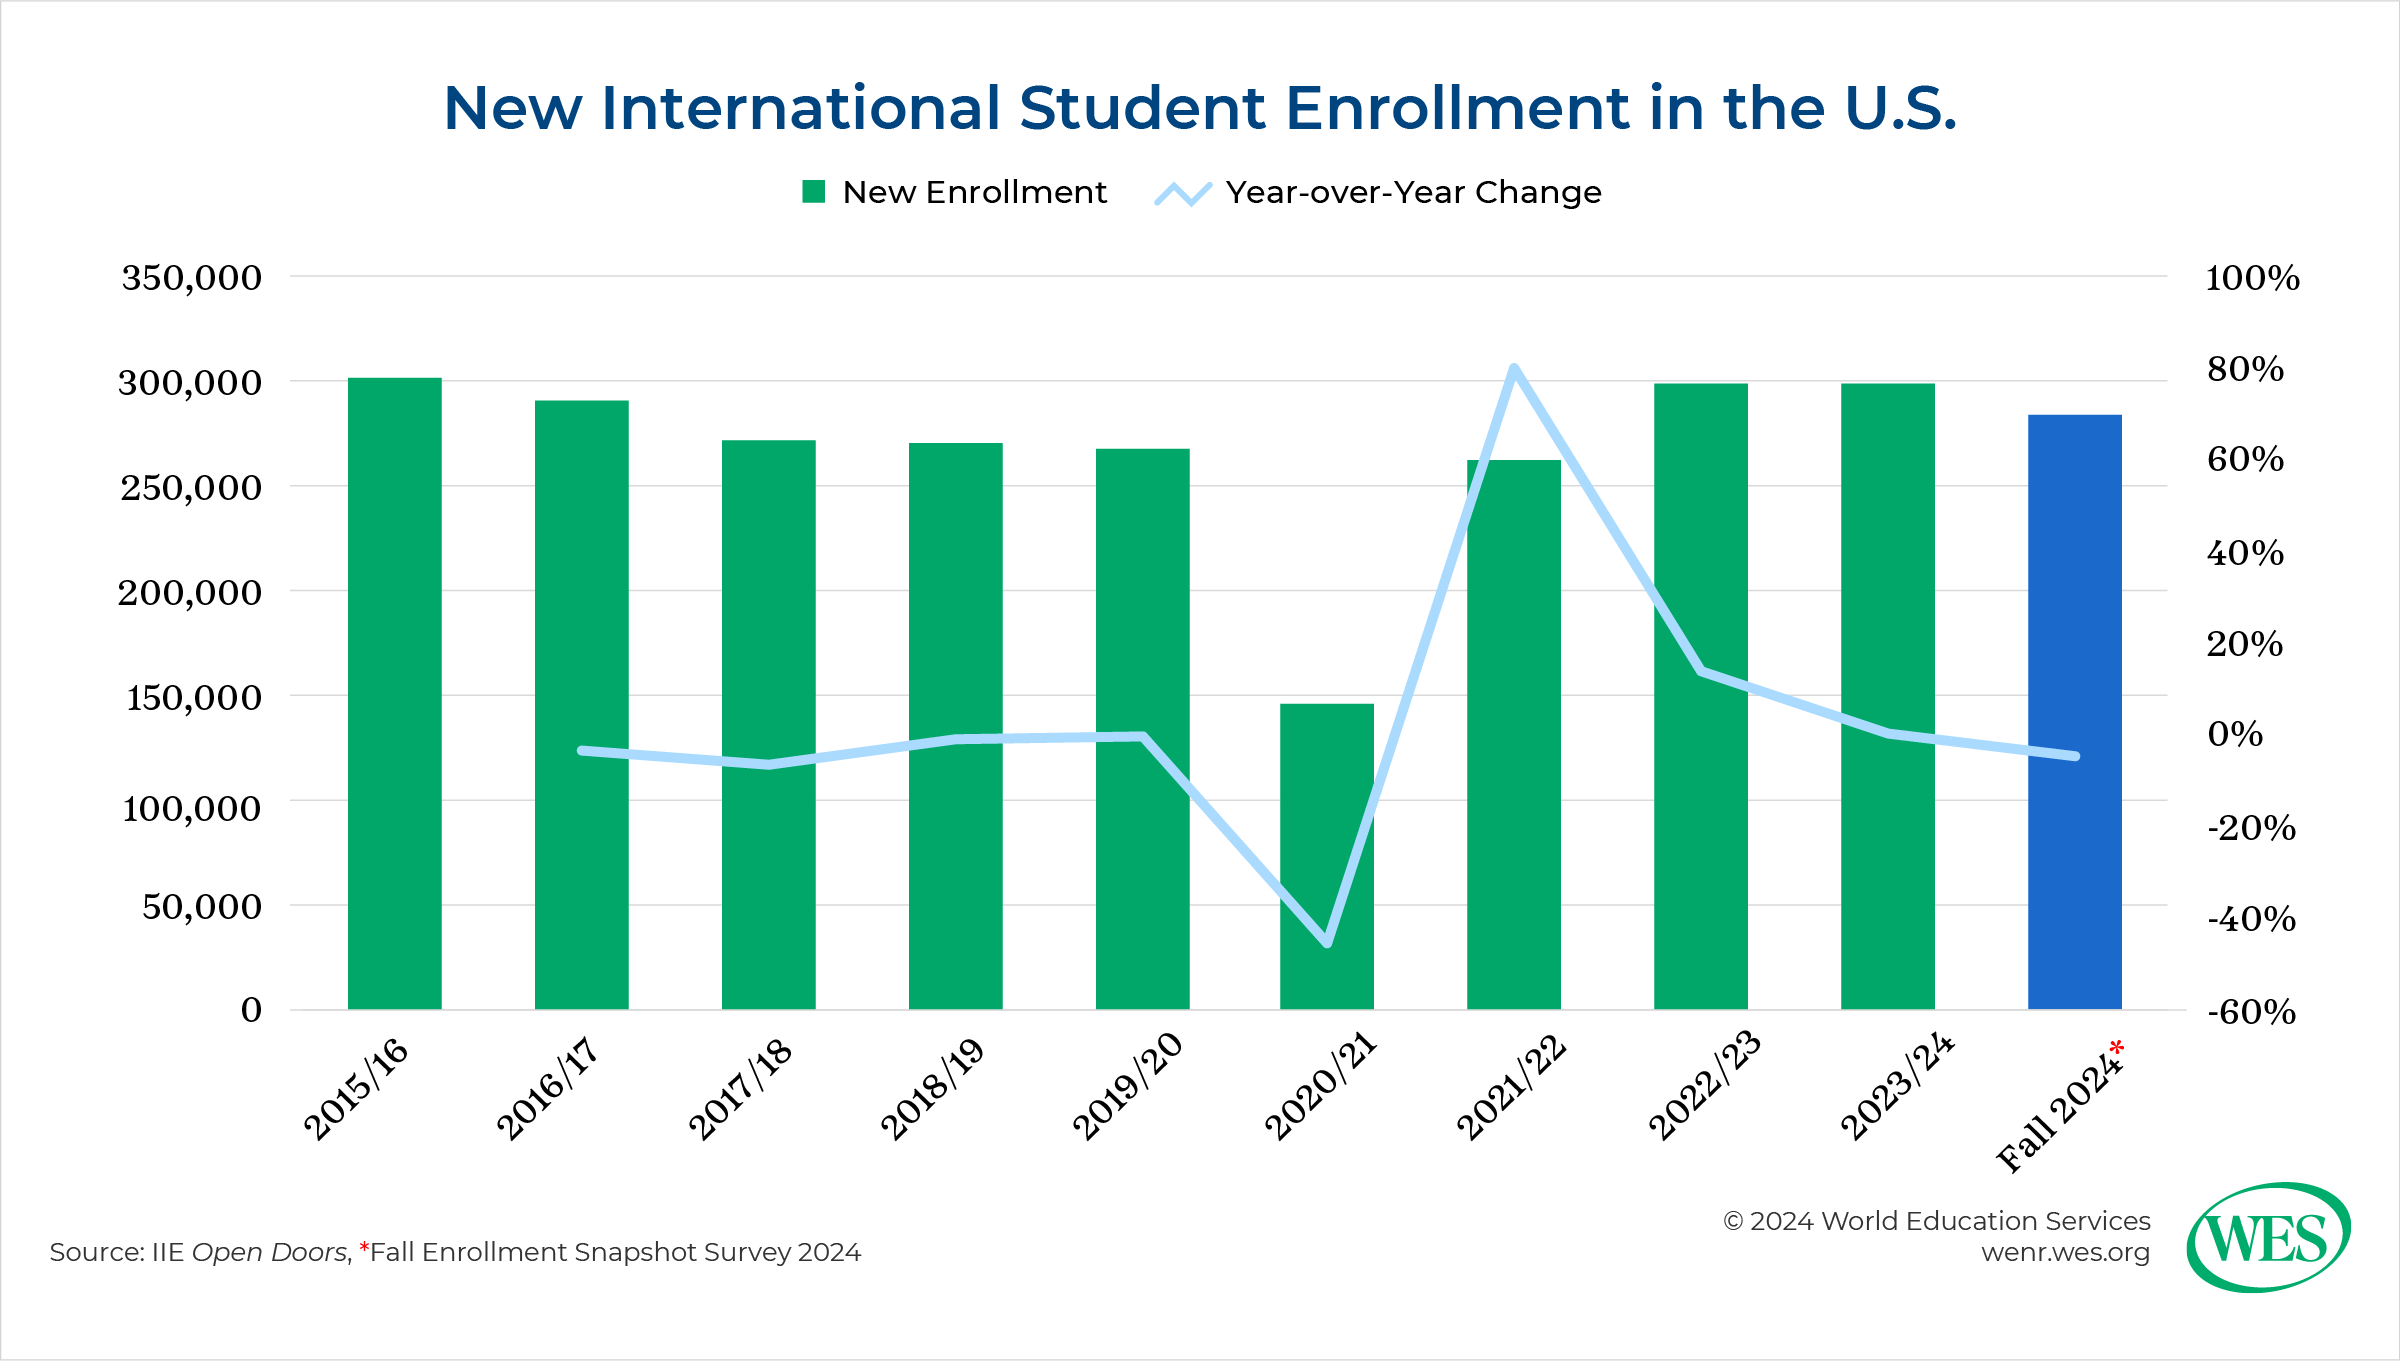
    However, growth is slowing. While this year’s Fall Snapshot Survey indicates a 3 percent growth rate in fall 2024, analysis of the SEVIS data indicates a drop in overall enrollment. International enrollment is down to 1,091,190 students in November 2024, a 10 percent decrease from the previous November, according to SEVIS records.[5] IIE’s data confirms slowing growth, too. New international student enrollment slowed to only 0.1 percent in 2023-24. Additionally, the Fall Snapshot Survey indicates a 5 percent decrease in new students this fall.

    This recent slowdown, which happened prior to the presidential election results, is tricky to diagnose. One likely culprit, though certainly not the only one, is economics: An education in the U.S. has become particularly expensive, due largely to a combination of inflation and a strong U.S. dollar. A more expensive U.S. education particularly impacts many students from South Asia and sub-Saharan Africa, the two regions showing the strongest rise in U.S. international enrollment in recent years, who are particularly price sensitive.

    Changing trends in South Asia and East Asia

    International enrollments in the U.S. from South Asia, driven dominantly by India, continued growing at a rapid rate in 2023–24. In 2023–24, India became the top country of origin among international students in the U.S. and by a substantial margin, at 331, 602 students. There was about a 23 percent increase in Indian students from the previous year, accounting for almost 30 percent of all international students in the U.S.

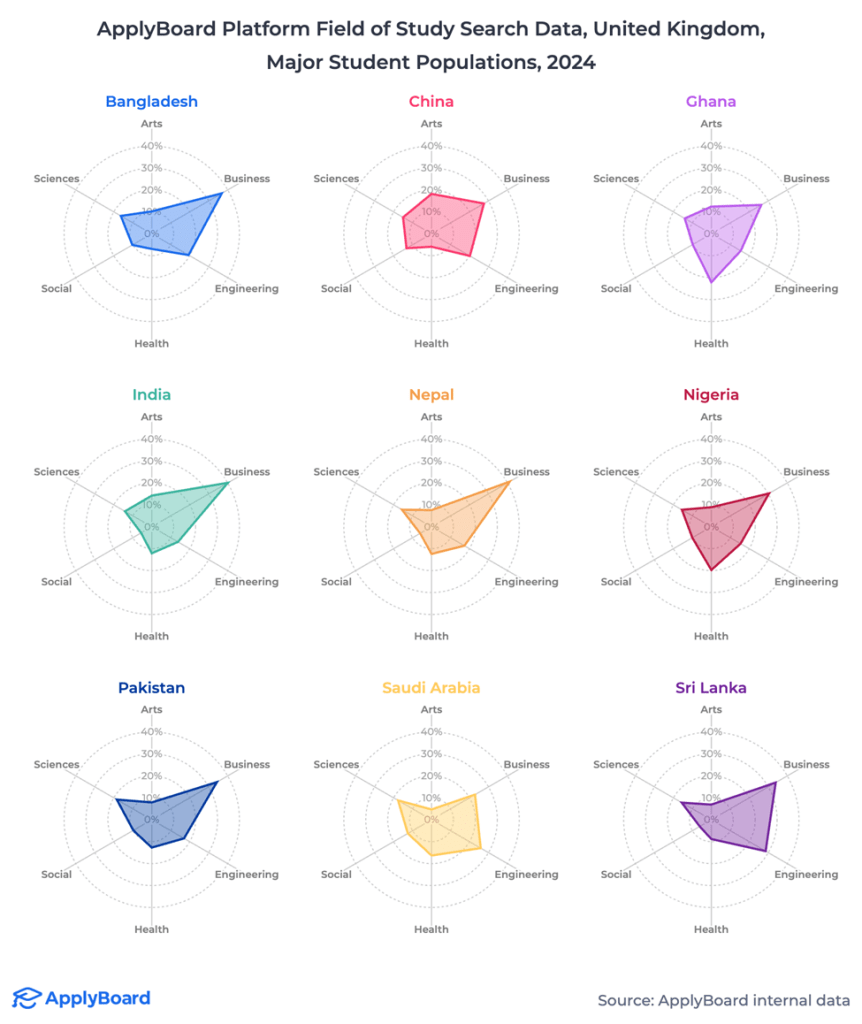
    In 2023-24, South Asia firmly dominated among regions of origin for U.S. international students and its numbers continue to rise. South and Central Asia (which IIE groups together as one[6]) account for one-third (34.3 percent) of all U.S. international students, just ahead of East Asia. South and Central Asia’s sending numbers grew 22 percent over the last year, more than those of any other region. Beyond India, there continues to be robust enrollment growth from Bangladesh (26 percent), Nepal (11 percent), Sri Lanka (10 percent), and Pakistan (8 percent). Bangladesh and Nepal broke into the top 10 countries of origin in 2023-24.

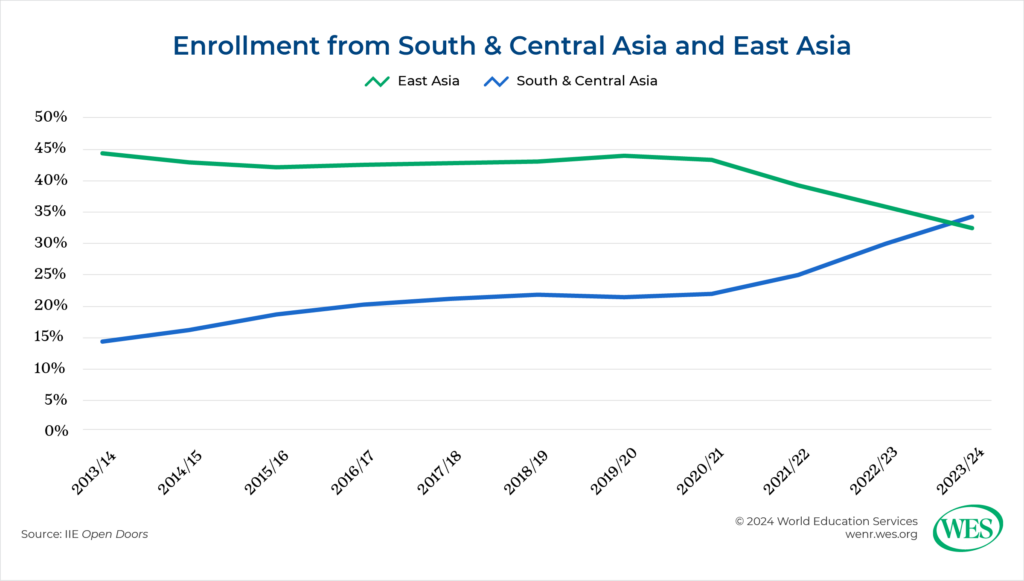
    By contrast, the number of Chinese students in the U.S. declined more than 4 percent to 277,398 during the same period and accounted for less than 25 percent of all U.S. international students. Overall, numbers from East Asia are declining steadily (by nearly 4 percent last academic year). Numbers from South Korea (-2 percent) and Japan (-13 percent) continued to drop. The one bright spot among major East Asian nations was Taiwan, which saw a 6 percent rise from the previous year and was the fifth largest sending country. Students from East Asia have been decreasing in the last few years, and forecasts suggest further steady decline.

    For many East Asian students, the calculus about studying in the U.S. and in Western countries has changed in recent years. Holding a degree from a highly ranked U.S. or Western institution holds less cachet than it once did. In both China and South Korea, local universities have become more prestigious and offer students the opportunity to connect directly with the local job market, putting those studying far afield at a disadvantage. For Chinese students, geopolitical tensions and strict policies against Chinese students and scholars largely enacted by the first Trump Administration, many of which were continued by the Biden Administration, may make studying in the U.S. feel riskier. There has also been growing intra-regional mobility, with many East Asian students choosing to go to another country in the region. According to the British Council, for example, there are more Japanese students in China than in any anglophone country.

    Despite the recent increases in enrollment from South Asia, the SEVIS data show a rapid reversal of trends heading in Fall 2024. Indian enrollment in the U.S. this fall has declined by 24 percent, and overall South Asian enrollment has fallen at a similar rate. Meanwhile, Chinese and overall East Asian enrollment has flatlined, each with a barely perceptible decrease. As a result, however, China has become the top country of origin once again, with 263,523 students in the U.S., followed by India (25,5443), in Fall 2024. Likewise, East Asia has returned to the top spot among region of origin, with modest enrollment increases from Japan and South Korea.

    A slowdown of enrollment growth from South Asia likely is attributable to rising costs in the U.S., particularly given currency exchange rates, as noted earlier. Safety, a frequent concern for Indian students and their families, could also be a factor. Many Indian media outlets, such as The Economic Times and The Indian Express, have recently reported on increasing safety issues for Indian students in the U.S.

    That said, these declines from India and South Asia do not necessarily foretell a long-term trend. Many prominent models, notably that of HolonIQ, predict growth from India into 2030.

    Graduate students continue to dominate. For now.

    International student growth in the U.S. continues to be driven at the graduate level, particularly among master’s degree students. Graduate students made up almost 45 percent of all U.S. international enrollment in 2023-24. Total international student graduate enrollment increased by 7.6 percent in 2023-24, while undergraduate enrollment fell by 1.4 percent and non-degree enrollment fell by 11.5 percent. These trends are somewhat parallel with new international student enrollment. India has driven much of this growth in grad students, as have South and Central Asian students in general. More Chinese students came to study at the graduate level that year, too.

    This growth of international graduate students does not appear to be holding into 2024-25, however. The Fall Snapshot Survey indicates a slight decrease of about 2 percent in international grad students this fall and an increase (6 percent) in international undergrad students. The SEVIS numbers show decreases for both, including a significant decrease of 15 percent among international grad students. (International undergrad enrollment declined by 3 percent.) However, international graduate enrollment is still greater than undergraduate enrollment currently.

    The decrease in international graduate students appears to be driven by Indian students and South Asian students overall. Indian students account for about 40 percent of all U.S. international student graduate students, and 60 percent of Indian students in the U.S. are studying at the graduate level, according to Open Doors. Per the SEVIS data, Indian graduate enrollment in the U.S. declined by almost 26 percent in Fall 2024. Additionally, South and Central Asian and East Asian student together account for nearly three-quarters of all international graduate students. Chinese graduate enrollment in the U.S. decreased about 4 percent this fall, according to the data from SEVIS.

    U.S. universities and colleges continue to focus heavily on India and to a lesser extent China for their international student recruitment, according to the Fall Snapshot Survey. India is the top country of focus for both graduate students (81 percent of respondents) and undergrads (65 percent). China was second top country of focus for grad students and third for undergrads (just after Vietnam). Given the volatility of enrollment from India and steady declines from China, U.S. institutions may wish to ensure diversity of countries from which they recruit.

    What could impact international enrollment in the near future?

    The Trump Administration

    When it comes to potential impacts on international student enrollment in the U.S., a primary factor will be the incoming Trump administration. Donald Trump will take office with a decisive agenda, having campaigned and won with a tough-on-immigration stance. This stance seemed to resonate with many voters, along with concerns about the economy and inflation.

    The first Trump administration may provide a useful look at what could happen in the second one. Trump’s first term brought a decline in international student enrollment, due in part to policies like the 2017 travel ban and a slowdown in visa processing. This trend reversed somewhat during the Biden administration but could resume under the policies of a second Trump term.

    Going forward, much will depend on the incoming administration’s policies as well as rhetoric. Trump’s immigration agenda is mostly focused on asylum, primarily at the U.S.-Mexico border, and on undocumented immigrants, whom he has pledged to deport at unprecedented rates. The extent that he will focus on international students and immigrants with specialty occupations, notably the H1-B visa program under which some international students seek to remain in the U.S., is unclear. In June 2024, Trump, known for making offhand comments, proposed on a podcast hosted by Silicon Valley investors that international students who graduate from U.S. institutions, including community colleges, should receive a green card (permanent residency). He and his team later walked back that remark, and many commentators see such policy as highly unlikely given Trump’s overall immigration stance. In fact, reports suggest the administration is likely to limit pathways to H1-B visas, international students’ primary means of staying in the U.S. beyond Optional Practical Training (OPT), effectively making such visas virtually inaccessible.

    Policy changes under Trump’s second administration could also affect OPT and “duration of status,” the length of time students with visas have been allowed to stay in the U.S. without needing to renew. Such changes were attempted in the first Trump administration but did not succeed. His first administration also tried to eliminate STEM OPT, the 24-month extension of OPT for those graduating with a degree in fields related to science, technology, engineering, or mathematics. Indian students in particular may be concerned about such changes if they are proposed again, as they are often drawn to the U.S. by opportunities to gain work experience. Toward the end of that term the administration also put forward a rule to limit duration of status to a finite period of two or four years, rather than allow the time needed to finish earning a degree, after which a student would be required to pay a fee and renew.

    Still, it is possible to overestimate the attitudinal impact of a presidential administration, and recent survey research by Intead and Studyportals found a majority of prospective international students this fall were “indifferent” to the election outcome and how it might affect their plans to study in the U.S., according to The PIE News. There is certainly no monolithic view of President-elect Trump or U.S. politics among international students. If any declines in numbers happen again under Trump, it will likely be in response to policies that specifically impact international students or rhetoric aimed at individuals from their home country or region of origin. It may also be driven in part by visa delays and denials caused by administration policies.

    Policies and politics in other major host countries

    One other major factor is current policy changes in other major host countries, driven largely by politics and public opinion, which might actually boost the attractiveness of the U.S. The other three Big Four predominantly anglophone destinations—Australia, Canada, and the United Kingdom—have had massive international student enrollment in recent years, particularly as a percentage of total higher education enrollment. According to IIE’s Project Atlas, Canada’s international enrollment rate in 2023 was 30 percent, Australia’s was 24 percent, and the U.K.’s was 22 percent. (By contrast, only 6 percent of U.S. higher education students were international, although overall size of its system makes the U.S. numerically the top enroller of international students.) Canada’s enrollment in particular has seen explosive growth, a rise of nearly 70 percent from 2019 to 2023. Many Canadian locales have struggled to accommodate such an influx, often viewed as a way to fill provincial funding gaps yet sometimes lacking steps to ensure students’ well-being.

    Additionally, international students have been ensnared in broader immigration debates within these three countries, often being unfairly blamed for systemic housing and employment challenges, among other issues. As in the U.S., immigration has been a major political topic in many Western countries and in recent elections in France and the U.K.

    As a result, the other three Big Four countries have begun implementing policies designed to rein in international enrollment growth and limit access to opportunities to work and stay after graduation. Canada, which according to IIE’s recent Open Doors briefing just overtook the U.K. to become the second most popular international student destination, adopted new policies in rapid-fire succession from late 2023 to fall 2024. The most consequential is a cap on the number of study permits (required in Canada for international students) granted per province, particularly meant to limit growth in higher-enrollment provinces, in 2024 and 2025. Other new policies include a significant hike in the financial resources international students are required to demonstrate, restrictions on work permits for spouses, limits on permission to work during study, and stricter requirements for obtaining the popular post-graduation work permit (PGWP), which allows graduated students to work in Canada and often transition to permanent residency.

    The Australian government is strongly considering similar caps on international student enrollment in an attempt to reduce overall migration to the country. Already it has stricter visa regulations for international students, including stronger “tests” to ensure that prospective students are coming with the intention of studying, not working, as well as a significant increase in the visa fee. In the U.K. a new regulation enacted by the Conservative Party prohibits international students at all levels except postgraduate from bringing family members starting in 2024, in order to “slash migration and curb abuse of the immigration system,” according to the U.K, government. The new Labour government has opted not to reverse the policy.

    The effects of these changes are already evident. The three other Big Four countries are all seeing declining applications for relevant visas and permits. Preliminary analysis of Canadian study permit application data shows the number of approved study permits will likely come in below the actual caps for 2024. The U.K. reported a 16 percent drop in student visa applications in summer 2024 compared to the same time period in 2023, and in Australia, the decrease in such applications has been particularly steep, nearly 40 percent from October 2023 to August 2024.

    So far, the prospective beneficiary of these changes has been the U.S., according to both prospective student surveys and media reports. For example, in IDP Education’s Emerging Futures Report for 2024, a prominent series based on prospective student survey data, the U.S. came in second place (at 23 percent) as destination of choice for survey takers, just behind Australia (24 percent). Interest in the U.S. increased four percentage points; Australia’s percentage point declined by one. By contrast, interest in the U.K. and Canada decreased 1 percent and 9 percent respectively, dropping them to third and fourth places. In media coverage of the restrictions, Indian outlets such as Business Standard and The Indian Express note that many Indian students are switching focus to the U.S, although some, including the Express, also report students are looking beyond the Big Four to other study destinations entirely.

    Still, President-elect Trump may introduce cuts or caps of his own, which, depending on their scope, may cause the U.S. to lose its developing enrollment edge. If all Big Four destinations have policies significantly cutting student influx, that could alter the student mobility landscape, shifting enrollments to other countries—notably, smaller anglophone destinations such as Ireland, New Zealand, and Singapore and non-predominantly anglophone countries in continental Europe and Asia—where English-taught programs have increased greatly in recent years.

    Student mobility in an uncertain world

    The incoming Trump administration and policy changes in other countries are only two factors apt to impact movement to the U.S.; internal issues in other countries and regions also come into play. For example, while U.S. policies and tensions with China have affected the number of Chinese students coming to the U.S., factors within China also played a role, as we examined in a recent series in WENR.

    Worldwide, uncertainty and systemic challenges lie ahead. Several major conflicts, notably Russia’s war in Ukraine and escalated fighting in the Middle East, threaten to spiral into bigger geopolitical crises. Authoritarianism is rising around the globe, creating more potential crises, as is the threat of climate change, with 2024 recently declared the hottest year on record. Among its many effects, climate change will likely continue spurring global migration, including, increasingly, the forcibly displaced. In fact, all these factors will likely increase global migration. Luckily, U.S. institutions are well-placed to take in students from affected regions and offer them pathways for academic and professional growth.

    In general terms, there is reason for optimism. Global student migration will continue and most likely rise, increasing economic and social opportunities for many globally mobile young people. International students also benefit their host societies, communities, and institutions, including domestic students, by bringing diverse international perspectives as well as economic benefits. By some estimates, international students will increase worldwide from about 6 million in 2023 to 10 million in 2030. The U.S. could host as many as 2 million, a still significant capacity compared to other destinations.

    Despite domestic and international pressures, U.S. institutions can continue to demonstrate the value of a U.S. education and what unique value they in particular offer. They can continue to make clear, through channels like the #youarewelcomehere campaign, that international students are both accepted and embraced. Institutions can continue to show that international education benefits not only students and institutions but communities and the nation. For example, huge numbers of U.S.-based entrepreneurs and  STEM professionals came to the U.S. as international students and have been an asset for U.S. business and research and development. And international educators can advocate for policies at local, state, and federal levels (for example, via NAFSA: Association of International Educators) that continue to make the U.S. a hospitable place for students from abroad.

    Most important, U.S. institutions can and should take proactive steps to ensure inclusion and integration of their international students. This means initial support in everything from securing good housing to culturally sensitive mental health resources to campus career services that recognize international students’ unique needs. It may mean assisting students with financing in any way possible. It also means more efforts toward academic and social integration, which involves educating faculty, staff, and domestic students as well.

    Looking to the future, U.S. policymakers, educators, and institutions must work together to create an environment that remains welcoming, inclusive, and responsive to the needs of international students. By doing so, the U.S. can maintain its position as a global leader in higher education and continue to benefit from the diverse perspectives and talents that international students bring.


    [1] Open Doors is an annual census of international students (those on a nonimmigrant student visa) enrollment in U.S. higher education institutions, as well as U.S. students who studied abroad two academic years prior.

    [2] The Fall Snapshot Survey is sent to all institutions that report data to IIE for Open Doors. This year, IIE collected 693 valid responses.

    [3] Open Doors always tracks data from the previous full academic year.

    [4] The SEVIS data released by DHS is usually the most up-to-date data available. Open Doors, however, provides more analysis and a greater breakdown of data compared with what is provided by SEVIS.

    [5] Usually, IIE’s Fall Snapshot Survey aligns with current data trends from SEVIS and is a strong predictor of numbers that appear in the following year’s Open Doors Report. This year, however, the data between the Fall Snapshot Survey and SEVIS are quite different, though both indicate slowing growth in international enrollment in the U.S.

    [6] Central Asia, which includes mostly former Soviet republics in Asia (such as Kazakhstan and Uzbekistan), only accounts for about 1 percent of total enrollment from the overall South and Central Asia region, according to my analysis of IIE Open Doors data.

    Source link