Tag: HESA

  • Summer 2025 | HESA

    Summer 2025 | HESA

    So. This is the last blog of the academic year. Service resumes Tuesday, 2 September.

    It’s been a long year. I’m pretty tired. How about you?

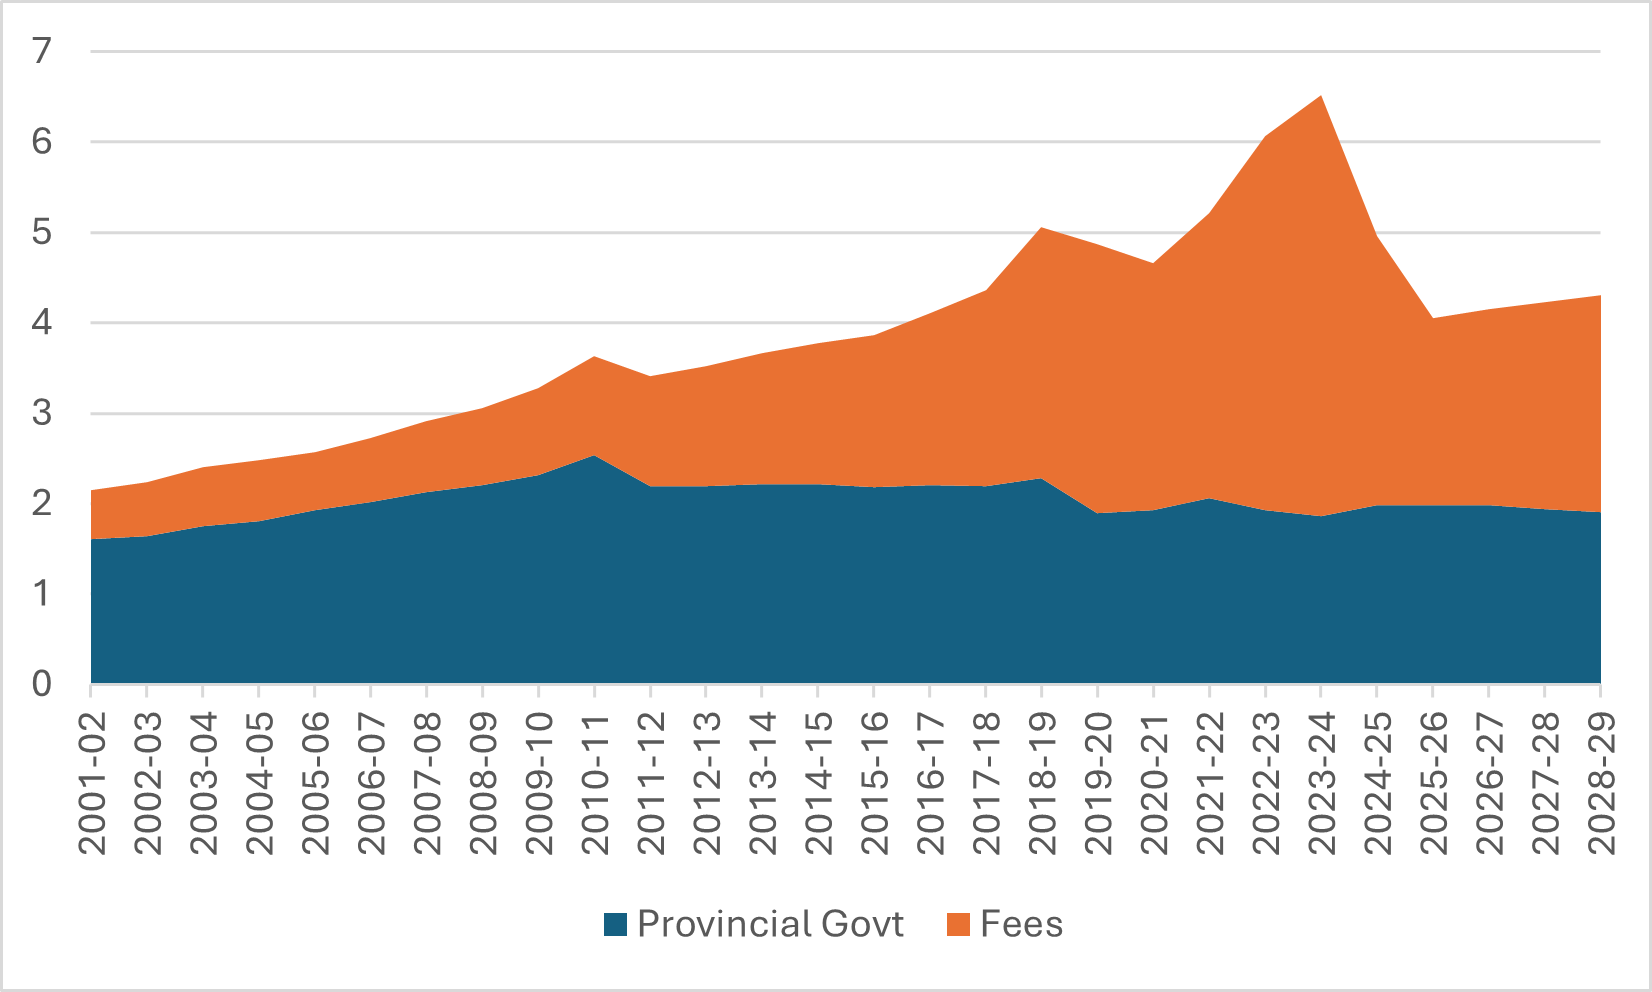
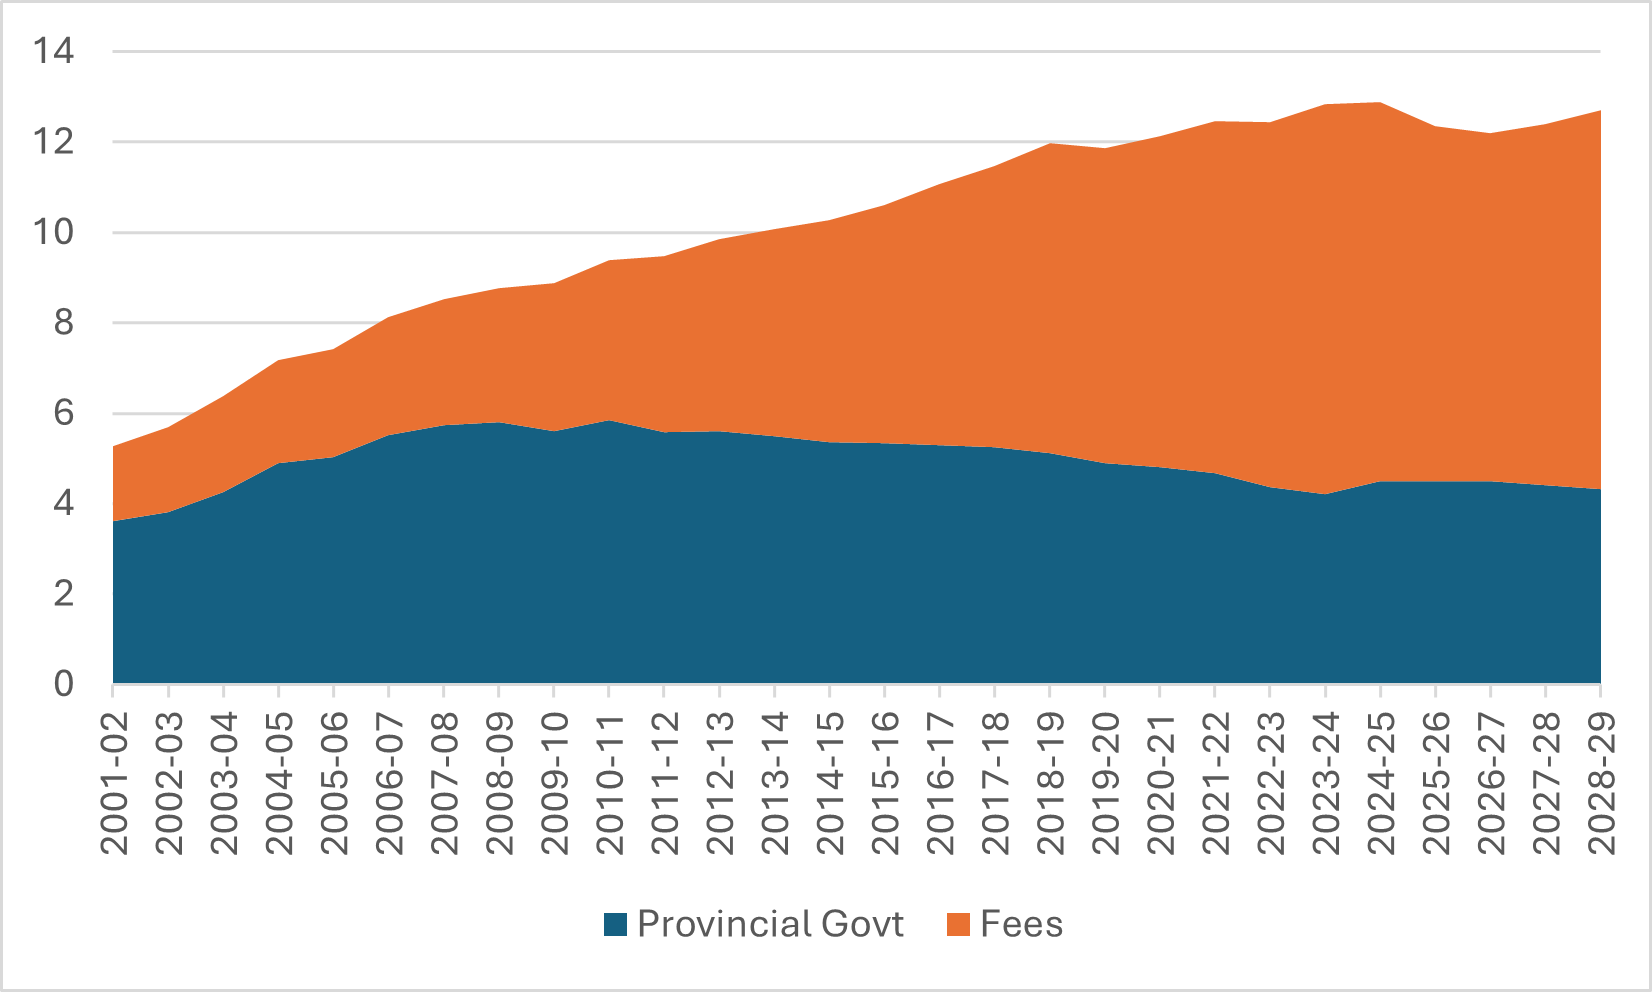
    This was the year it all kind of came crashing down: not just here in Canda, but everywhere else too. It’s too long to go through and my more faithful readers already know the story. It’s not just in Canada. In France, Australia, and the UK, we saw institutions having similar problems: all these fantastic higher education institutions we’ve collectively built and, quite simply, nobody wants to pay for it. Not through public funds, not through private fees. Nobody wants to pay for it.

    And then there’s American higher education would probably be going through something similar this year, only a greater catastrophe arrived first. I’ll pass over this in silence.

    Here in Canada, the sector is increasingly friendless. Parents and students seem less convinced that universities in particular represent good value. And governments are simply indifferent, not because they dislike universities necessarily, but because they dislike or distrust the knowledge economy universities are built to serve.

    Unfortunately, I think it is going to get worse. Not a single government in Canada released a budget this year which took into account the effects of US tariffs. The result? Allegedly healthy federal and provincial balance sheets are going to get pounded this year and next (and the especially unhealthy ones — BC and Quebec in particular — are going to be especially ugly). Deficits as far as they eye can see. As the saying goes, no one is coming to save us.

    I have no doubt that community colleges will find ways to get through this, because they have so far through this crisis mostly shown themselves to have the ability to do what it takes to right the ship. They might not look too good after another round or two of cuts, and it’s not impossible that a few rural colleges might disappear or shrink radically because what they get from governments and domestic tuition fees just isn’t enough to properly serve their communities, but on the whole, I think they will be ok.

    Universities, on the other hand. Well, that’s a different story.

    About a year ago, I said that the biggest change universities were going to have to undergo in this new financial age was shifting from a belief that every problem had a revenue-side solution to one in which every problem has a cost-side solution. Institutions can no longer solve their short-term problems by just recruiting another hundred international students. They actually have to change the way they do business. They have to change processes. They have to think about production functions and work processes in a way they haven’t before. And they have to do it while trying to pivot to new missions that give them more traction with government and the public.

    I am here to say that I don’t think it’s going so well.

    The message that “there is no one coming to save us” has, thankfully, penetrated fairly deeply in universities. Maybe not quite everywhere (hello, VIU!), but in most places. But what I am not sure has penetrated quite so deeply is the corollary that actual change is necessary. My (admittedly limited) vantage point on the sector is that:

    • I still see universities spending inordinate amounts of time trying to come up with new revenue-based solutions. It’s a habit they have a hard time kicking.
    • Universities are deeply resistant to doing more than the bare minimum of restructuring to meet immediate financial needs. The idea that deep structural change might be necessary remains pretty much anathema. This bare minimum approach means that when the next round of government cuts come – due to recession, or national re-armament or whatever – they are just going to have to cut again, and again, and again. There is very little sign of anyone trying to get ahead of the curve to make both big cuts and big investments in new areas that will help them survive the turmoil.
    • I still hear, distressingly often, senior people in universities utter the worst seven words in all of higher education: “we just gotta tell our story better”. Universities are reluctant to face the possibility that governments and the mass public don’t love them the way they are and that they may need to actually, you know, change.

    We need to stop acting like the research university of today – which in Canada is really only a creature of the 1970s or perhaps 1960s — is eternal. Universities can die, and have done so rather frequently across history. Universities are the product of particular configurations of social and economic forces. And now, at the moment when the western world is basically re-considering the entire post-WWII order, the idea that universities are going to be uniquely immune to change is bananas. Past performance — which I think has been pretty good — is not a guarantee of future safety.

    I am not saying here that universities shouldn’t fight for their own corner: they should! Often more vigorously than they currently do (see my piece on Bill 33, or on how they need to gear up for a fight with Bay Street over whether temporary residents will be international students or TFWs). But they can’t do it by digging in on the status quo.

    And so, I will end the academic year by repeating something I said a few months ago. To survive this coming period, universities are going to need:

    1. Ambition. Don’t waste time doing small things.
    2. Experimentation. The worst possible thing right now is an addiction to “the way we’ve always done things”
    3. Dissemination. No one institution got us into the mess. No one institution is going to get out of it alone, either. Institutions need to commit to sharing the results of their experimentation.

    I know every university in Canada can, if it chooses, commit to those three things. I have faith. And I believe that if they do, our university sector will come out as strong or stronger than any system in the world.

    But any institution that chooses not to commit to them…well, I think they are going to have some issues in the next three years. Serious ones.

    It’s up to us. Rest up this summer. Re-charge. We’re all going to need it in ‘25–’26.

    Source link

  • Book Report Summer 2025 | HESA

    Book Report Summer 2025 | HESA

    Morning everyone.  The days are getting long, so that means it’s getting close to the time when I need to wrap up this blog for the (northern hemisphere) summer.  And that, in turn, means book report time, where I round up everything I’ve read on higher education for the past six months.

    (If you’re looking for non-higher education recommendations: Terry David Martin’s The Affirmative Action Empire: Nations and Nationalism in the Soviet Union 1923-1939 will re-wire your thinking about what the early Stalinism actually looked like, and Ashoka Mody’s India is Broken will probably do the same for post-Independence India.  Can’t give you much on the fiction side because most of what I have read is pretty meh, but if you’re into the detective genre, I can recommend Inspector Imanishi Investigates by Seicho Matsumoto.  Not quite as good as his earlier Tokyo Express – which is the most brilliant novel-length thriller based on train timetables ever written – but still pretty good.)

    Let’s start with institutional histories, of which I read two: A European University: The University of Helsinki 1640-2010 and A History of Temple University Japan: An Experiment in International Education.  The first is an absolute doorstopper (over 800 pages – down from about 1500 in the original Finnish) but from a scholarly perspective it is genuinely top-notch.  Because fundamentally it is not just a history of the university, but an intellectual history of the country as a whole.  In that sense, it recalls my favourite book of last year Université de Montréal: une historie urbaine et internationale, but also to some extent Martin Friedland’s history of the University of Toronto.  The Temple Japan was also pretty interesting.  Branch campuses don’t often get their own histories, and this one is a doozy: a roller-coaster story which shows exactly how hard it is to lay down roots in a country where you don’t really speak the language, where government is mostly hostile, and your partners – even where they are legitimate (which not all of Temple’s were) – don’t always have similar goals in mind.  Great stuff.

    Searching for Utopia: Universities and Their Histories by Hanna Holborn Grey is a good short book with a misleading title.  It’s not actually about the histories of the American university, but a history of the ideas that animate them and how these ideas echo across a century or more, animated for the most part by the words of Robert Hutchins (U Chicago) and Clark Kerr (U California). 

    I was in Japan for a bit back in March, and so decided to pick up Shigeru Nakayama’s Science, Technology and Society in Postwar Japan. It’s at least 25 years out of date but it is a pretty interesting read as a kind of pre-history of the modern Japanese scientific enterprise and helpful to understand why university science is such a small part of the overall equation.  I also read Grant Black’s Education Reform Policy at a Japanese Super Global University, a book about Tsukubu U, from Routledge.  It reads like a Master’s thesis and is mostly pretty banal, but it does have just enough interesting nuggets about how top-tier institutions in Japan are re-imagining their offerings in the early twenty-first century to make it worth a skim at least.

    Two books I read focusing specifically on American university finances were Let Colleges Fail: The Power of Creative Destruction in Higher Education by Richard K. Vedder and Joshua Travis Brown’s Capitalizing on College: How Higher Education Went from Mission-Driven to Margin-Obsessed.  You can skip the Vedder book; over his career he has written a lot of useful stuff about college cost structures but now in his 80s this (apparently) farewell book contains far too much “colleges are woke so fuck ‘em” for my taste.  Capitalizing on College is a lot more interesting, containing as it does eight case studies of religious colleges and how the various financial strategies they have adopted to stave off financial decline have worked out.  The answer – mostly pretty badly except for the one who traded God for Mammon – might not sound riveting or surprising, but the routes that each institution takes towards the bottom of the canyon are varied and collectively tell a pretty interesting story, all of which come down to “nobody really wants to pay for higher education”.  Thought-provoking even if it is 50-100 pages longer than it needed to be and is too casual with use of the term “neoliberal”.

    Sticking with the theme of books with lots of institutional case studies, I also polished off two books that are heavy on case studies: Inside College Mergers: Stories From the Front Lines (Mark La Brance, editor) and Strategic Mergers in Higher Education by Ricardo Azziz, Guilbert Henschke, Lloyd Jacobs and Sonita Jacobs.  The former is seven first-person accounts of mergers, some of which worked and some of which didn’t (which is great because failure cases are always underexplored in the literature), while the latter is a more analytical look at university mergers over time.  The latter is arguably the more significant book both because of its attempts at theory-building (its typology of mergers is particularly helpful, I think) and because in many ways its checklists of how to run a merger right are actually applicable to all universities at all times!  Its inclusion of European and Canadian experiences are commendable, even if they get some of the details wrong and is awkwardly-placed in a book which is fundamentally America-focused.  Two thumbs up anyway.

    Tenure Tracks in European Universities, (free download at the link) is a collection of essays edited by Elias Pekkola and Taru Siekkinen.  Following the introduction of global rankings, there was a widespread desire to copy this North American invention partly in order to incentivize greater productivity, but also to make researcher careers more attractive to international scholars (broadly speaking, the old European systems were nicer to early career academics and much harder on mid-career academics than the North American system).    Generally speaking, tenure never replaced the old hierarchy but rather now sits uneasily beside it, but the specific manner in which reform was implemented differed from place to place, and this book is a very helpful overview.

    Two books on UK higher education to look out for.  The first was The Secret Lecturer by…well, it’s a secret (the idea is a play on a series of articles and books in the Guardian called The Secret Footballer, in which a professional talked a lot about what goes on behind the scenes on a professional soccer team…the footballer was never named but most people think it was Dave Kitson).  It was interesting in many ways, showing what day-to-day life in a UK university looks like, and it is in many ways very disappointing.  It’s a bit blighted by the lecturer’s insistence on centering his own views about the relationship between universities and the arms trade, but that’s a minor quibble: I sure would like a Canadian equivalent.  The second was Higher Imagination: A Future for Universities by British/Australian policy wonk Ant Bagshaw, which was…intriguing.  Some bits of it will probably enrage a lot of faculty – in particular the bits about being relentlessly focused on programs as “products”, but the bits stressing that one of the key outputs of universities should be “joy” are pretty original (and, IMHO, true, even if it would be madness for any institution to say stuff like this out loud).

    Education, Skills and Technical Change: Implications for Future US GDP Growth is a book I should have read when it came out a few years ago.  It’s a series of quite technical economic papers from some of the biggest names in US economics, not about higher education itself, for the most part, but mostly about returns to skills.  Of the two which are more specifically about institutional production functions, the one by Caroline Hoxby is interesting, the other one, about the rise in college costs, is garbage (as the article’s discussant in the book, Sandy Baum, ably points out).  It’s one of those books where you don’t necessarily need to buy all the results, or believe that the results hold outside the United States, but you do just sort of stand slack-jawed in wonder at how many different ways they have to analyze a problem thanks to a system of economic and institutional data collection which doesn’t suck the way Canada’s does.

    The Promise of Higher Education: Essays in Honour of 70 Years of the International Association of Universities(also availableas a free download here) is a boatload of short ideas on the idea of higher education written on the occasion of the International Association of Universities.  Most of the individual articles are forgettable – the way to best experience this book is as a kind of mood music in favour of higher education’s greatest kumbaya themes.  But a couple are superb: in particular Simon Marginson and Lili Yang’s dissection of Chinese versus Western conceptions of institutional autonomy, as well as Pedro Teixera and Manja Klemencic’s article on the Civic Role of universities (also of interest is Daniel Levy’s screed against management-led institutional activism, which might be the politest and most substantive critique of institutional DEI approaches ever written). 

    The Learning-Centered University, whose author Steven Mintz I interviewed back here, is a book that was somewhat let down by poor editing.  The subject is interesting and Mintz is well-informed on the subject, but while the material is good, it’s presented in a somewhat disorganized fashion, which undermines the point a bit.  Knowledge Towns: Colleges and Universities as Talent Magnets, by David Staley and Dominic Endicottis…almost interesting.  That is to say: it has an interesting thesis about how cities can use educational institutions to re-define themselves, especially in periods of demographic change, but it is marred by some wishful thinking about the flexibility of institutional forms and a bunch of wishful thinking about things like “micro-colleges”.  Finally, there was Polarized by Degrees: How the Diploma Divide and the Culture War Transformed American Politics by Matt Grossman and David Hopkins, which is probably of more interest to political scientists studying voting patterns than it is to educationists trying to work out how to de-polarize the sector in the current environment of wild right-wing vandalism.

    On the subject of science more generally, I read Science of Science by Alexander Krauss (open access version available here), which is an interesting approach to the subject without being anywhere near as revolutionary as the author claims.  His central insight, though – that the history of science is to a very large extent a history of methodologies and the measurement tools that permit new methodologies to sprout – is pretty interesting and I am looking forward to the companion volume coming out later this year called The Motor of Scientific Discovery.  In the history of science category, I also picked up Scientific Babel: the Language of Science from the Fall of Latin to the Rise of English  by Michael Gordin which is about how over the course of two centuries English won out over German, French, Russian and a plethora of constructed languages like Volapuk, Esperanto and Ido (many of which, to my surprise, were actually constructed with the specific intention of being languages for the transmission of sciences) to become the lingua franca of sciences.  It’s terrific and I heartily endorse it.

    I think that’s it.  Hope you get some good reading this summer and if you find anything you think I need to read, drop me a line!

    Source link

  • Provincial Budgets 2025-26 | HESA

    Provincial Budgets 2025-26 | HESA

    Ok everyone, all the provincial budgets are in and so it’s time for our annual look at what another round of irresponsible pan-partisan political leadership has wrought for our sector for the next twelve months.

    Figure 1 shows the province-by-province breakdown of this year’s budgets, showing the change in transfers to institutions in real dollars over 1 year and 5 years for each of the ten provinces. In most provinces, collecting this data is pretty easy—you just look at the Main Estimates. In Ontario it is more difficult because due to the Ministry of Finance’s crapulous incompetence, it is the one province in the country where Estimates do not appear on the day of the budget (it takes them several months to put out the detailed data; and while prior to 2018 the Ministry of Colleges and Universities was able to give out actual expenditure data on the day of the Budget, the Government no longer chooses to provide such information because shovel, manure, mushrooms, etc.). So in Ontario what you have to do is collect the previous year’s data, add the announced changes in expenditure, and then make some assumptions about the way funds are phased in (because the communications jackals who have taken over public budgeting in this province insist on phrasing spending as “$750 million over five years” to make numbers as big as possible, rather than explaining how the $750 million will be phased in on an annual basis). Which is all to say, these numbers are all pretty accurate except for Ontario, where there is a bit of a margin of error.

    Figure 1: 1-year and 5-year Changes to Budgeted Provincial Transfers to Institutions, Canada, 2025-26 Budget Year

    The one province that shows big change for 2025-26 is Prince Edward Island, which dropped a lot of money on UPEI this year in order to start a new medical school. Five other provinces (British Columbia, Alberta, Manitoba, Ontario, and Newfoundland and Labrador saw real increases (that is, increases greater than the rate of inflation) this year of between 1 and 4%. Four other provinces (Saskatchewan, Quebec, New Brunswick, and Nova Scotia) saw real declines of between 1% and 3%. Altogether, that combined nationally for real growth in provincial spending of about 0.9%.

    Over a five-year horizon, things are a bit different. The oil provinces—Alberta, Saskatchewan, and Newfoundland and Labrador—have all shown double digit declines in real expenditures (19%, 11%, and 18%, respectively), the “big two” (Quebec and Ontario) are down seven and six per cent respectively, while Nova Scotia and New Brunswick are down eight and two percent respectively. The only provinces that are up are Manitoba, where just before leaving office the Tories reversed a huge portion of their cuts of the previous eight years or so, British Columbia, which build a new med school at Simon Fraser and decided to give hefty wage increases to university and college staff (which did not, in the end, leave universities and college much better off—see Vancouver Island University for evidence), and the afore-mentioned PEI. Nationally, the drop in spending after inflation was 4%, and obviously would have been much higher without that anomalous BC result.

    So what does the overall picture look like nationally? Well, take a look at Figure 2. Basically, the picture is one of long-term stagnation.

    Figure 2: Total Budgeted Provincial Expenditures on Post-Secondary Education, 2006-07 to 2025-2025, in Billions of Constant 2025 dollars

    I suppose I should also update some charts I first made available earlier this year, looking at expenditures on post-secondary education as a percentage of total government expenditures, which I do below in Figure 3. Across the country, these percentages are down a long way over the past fifteen years, particularly in Alberta, which has gone from being by far the biggest spender in 2008 to being below the national average now.

    Figure 3: Budgeted Provincial Expenditures on Post-Secondary Education as a Percentage of Total Budgeted Provincial Expenditures, Canada and selected provinces, 2006-07 to 2025-26.

    Now, your brain might be whirring a bit trying to would out how Figures 2 and 3 can both be true. Overall spending is down only gently, but PSE expenditures as a percentage are crashing? It’s easy to explain, but not intuitive if you believe all the left-wing CBC nonsense about how governments are in austerity mode. This is nonsense: Canadian provincial governments are absolutely NOT in austerity mode. In most provinces, overall spending is wayyy up. It’s just that they are not choosing to spend any of that on postsecondary education. Since COVID, overall government expenditure is up 20% after inflation; since 2008-09, when post-secondary education peaked as a percentage of total expenditures, it’s up 59% after inflation.

    Figure 4: Real Change in Total Provincial Expenditures vs. Provincial Expenditures on Post-Secondary Education 2006-07 to 2025-26 (2006-07 = 100)

    Got it? Provinces are still spending. They just aren’t spending on postsecondary education.

    Anyways, just to finish things off, figure 5 shows changes in overall provincial spending on student assistance programs. It’s up a bit this year mainly because of Ontario. Unclear why there has been a rise, though I suspect it has something to do with the ongoing crappiness in the youth job market (something I will get back to in a blog next week) and the need for student aid to backfill.

    Figure 5: Total Budgeted Provincial Expenditures on Student Financial Assistance, Canada 2006-07 to 2025-26, in Billions of Constant 2025 Dollars

    So that’s your 2025-26 budget round up. Not as bad as some previous years but man, our sector is in a bit of a whole and just can’t get out of it. The message, as always, is: no one is coming to save us.

    Source link

  • What the latest HESA data tells us about university finances

    What the latest HESA data tells us about university finances

    The headlines from the 2023-24 annual financial returns were already pretty well known back in January.

    Even if you didn’t see Wonkhe’s analysis at the time (or the very similar Telegraph analysis in early May), you’d have been well aware that things have not been looking great for the UK’s universities and other higher education providers for a while now, and that a disquieting number of these are running deficits and/or making swingeing cuts.

    What the release of the full HESA Finance open data allows us to do is to peer even deeper into what was going on last academic year, and start making sense of the way in which providers are responding to these ongoing and worsening pressures. In particular, I want to focus in on expenditure in this analysis – it has become more expensive to do just about everything in higher education, and although the point around the inadequacy of fee and research income has been well and frequently made there has been less focus on just how much more money it costs to do anything.

    Not all universities

    The analysis is necessarily incomplete. The May release deals with providers who have a conventional (for higher education) financial year – one that matches the traditional academic year and runs through to the end of August. As the sector has become more diverse the variety of financial years in operation have grown. Traditional large universities have stayed with the status quo – but the variation means that we can’t talk about the entire sector in the same way as we used to, and you should bear this in mind when looking at aggregate 2023-24 data.

    A large number of providers did not manage to make a submission on time. Delays in getting auditor sign off (either because there was an audit capacity problem due to large numbers of local authorities having complex financial problems, or because universities themselves were having said complex financial problems) mean that we are down 18 sets of accounts. A glance down the list shows a few names known to be struggling (including one that has closed and one that has very publicly received a state bailout).

    So full data for the Dartington Hall Trust, PHBS-UK, Coventry University, Leeds Trinity University, Middlesex University, Spurgeon’s College, the University of West London, The University of Kent, University of Sussex, the Royal Central School of Speech and Drama, The Salvation Army, The London School of Jewish Studies, Plymouth Marjon University, the British Academy of Jewellery Limited, Multiverse Group Limited, the London School of Architecture, The Engineering and Design Institute London (TEDI) and the University of Dundee will be following some time in autumn 2025.

    Bad and basic

    HESA’s Key Financial Indicators (KFIs) are familiar and well-documented, and would usually be the first place you would go to get a sense of the overall financial health of a particular university.

    I’m a fan of net liquidity days (a measure showing the number of days a university could run for in the absence of any further income). Anything below a month (31 days) makes me sit up and take notice – when you exclude the pension adjustment (basically money that a university never had and would never need to find – it’s an actuarial nicety linked to to the unique way USS is configured) there’s 10 large-ish universities in that boat including some fairly well known names.

    [Full screen]

    Just choose your indicator of interest in the KFI box and mouse over a mark in the chart to see a time series for the provider of your choice. You can find a provider using the highlighter – and if you want to look at an earlier year on the top chart there’s a filter to let you do that. I’ve filtered out some smaller providers by default as the KFIs are less applicable there, but you can add them back in using the “group” filter.

    I’d also recommend a look at external borrowing as a percentage of total (annual) income – there are some providers in the sector that are very highly leveraged who would both struggle to borrow additional funds at a reasonable rate and are likely to have substantial repayments and stringent covenants that severely constrain the strategic choices they can make.

    Balance board

    This next chart lets you see the fundamentals of your university’s balance sheet – with a ranking by overall surplus and deficit at the top. There are 29 largeish providers who reported a deficit (excluding the pension adjustments again) in 2023-24, with the majority being the kind of smaller modern providers that train large parts of our public sector workforce. These are the kind of universities who are unlikely to have substantial initial income beyond tuition fees, but will still have a significant cost base to sustain (usually staffing costs and the wider estates and overheads that make the university work).

    [Full screen]

    This one works in a pretty similar way to the chart above – mousing over a provider mark on the main surplus/deficit ranking lets you see a simplified balance sheet. The colours show the headline categories, but these are split into more useful indications of what income or expenditure relates to. Again, by default and for ease of reading I have filtered out smaller providers but you could add them in using the “group” filter. For definitions of the terms used HESA has a very useful set of notes below table 1 (from which this visualisation is derived)

    There’s very little discretionary spend within the year – everything pretty much relates to actually paying staff, actually staying in regulatory compliance, and actually keeping the lights on and the campus standing: all things with a direct link to the student experience. For this reason, universities have in the past been more keen to maximise income than bear down on costs although the severity and scope of the current pressure means that cuts that students will notice are becoming a lot more common.

    What universities spend money on

    As a rule of thumb, about half of university expenditure is on staff costs (salaries, pensions, overheads). These costs rise slowly but relatively predictably over time, which is why the increase in National Insurance contributions (which we will see reflected in next year’s accounts) came as such an unwelcome surprise.

    But the real pressure so far has been on the non-staff non-finance costs – which have risen from below 40 per cent a decade ago to rapidly approach 50 per cent this year (note that these figures are not directly comparable, but the year to date includes most larger providers, and the addition of the smaller providers in the regular totals for other years will not change things much).

    What are “other costs”? Put all thoughts of shiny new buildings from your mind (as we will see these are paid for with capital, and only show up in recurrent budgets as finance costs) – once again, we are talking about the niceties of there being power, sewage, wifi, printer paper, and properly maintained buildings and equipment. The combination of inflationary increases and a rise in the cost of raw materials and logistics as a result of the absolute state of the world right now.

    [Full screen]

    Though this first chart defaults to overall expenditure you can use it to drill down as far as individual academic cost centres using the “cc group” and “cc filters”. Select your provider of interest (“All providers” shows the entire sector up to 2022-23, “All providers (year to date)” shows everything we know about for 2023-24. It’s worth being aware that these are original not restated accounts so there may be some minor discrepancies with the balance sheets (which are based on restated numbers).

    The other thing we can learn from table 8 is how university spending is and has been split proportionally between cost centres. Among academic subject areas, one big story has been the rise in spending in business and management – these don’t map cleanly to departments on the ground, but the intention to ready your business school for the hoped-for boom in MBA provision is very apparent.

    [Full screen]

    That’s capital

    I promised I’d get back to new builds (and large refurbishment/maintenance projects) and here we are. Spending is categorised as capital expenditure when it contributes to the development of an asset that will realise value over multiple financial years. In the world of universities spend is generally either on buildings (the estate more generally) or equipment (all the fancy kit you need to do teaching and research).

    What’s interesting about the HESA data here is that we can learn a lot about the source of this capital – it’s fairly clear for instance that the big boom in borrowing when OfS deregulated everything in 2019-20 has long since passed. “Other external sources” (which includes things like donations and bequests) are playing an increasingly big part in some university capital programmes, but the main source remains “internal funds” drawn from surpluses realised in the recurrent budget. These now constitute more than 60 per cent of all capital spend – by contrast external borrowing is less than ten per cent (a record low in the OfS era)

    [Full screen]

    What’s next?

    As my colleague Debbie McVitty has already outlined on the site, the Office for Students chose the same day to publish their own analysis of this crop of financial statements plus an interim update giving a clearer picture of the current year alongside projections for the next few.

    Rather than sharing any real attempt to understand what is going on around the campuses of England, the OfS generally uses these occasions to complain that actors within a complex and competitive market are unable to spontaneously generate a plausible aggregate recruitment prediction. It’s almost as if everyone believes that the expansion plans they have very carefully made using the best available data and committed money to will actually work.

    The pattern with these tends to be that next year (the one people know most about) will be terrible, but future years will gradually improve as awesome plans (see above) start to pay off. And this iteration, even with the extra in year data which contributes to a particularly bad 2025-26 picture, is no exception to this.

    While the HESA data allows for an analysis of individual provider circumstances, the release from OfS covers large groups of providers – mixing in both successful and struggling versions of a “large research intensive” or “medium” provider in a generally unhelpful way.

    [Full screen]

    To be clear, the regulator understands that different providers (though outwardly similar) may have different financial pressures. It just doesn’t want to talk in public about which problems are where, and how it intends to help.

    Source link

  • Post-COVID University Surpluses (Deficits) | HESA

    Post-COVID University Surpluses (Deficits) | HESA

    Ok, everyone, buckle up. For I have been looking at university financial statements for 2023-24 and the previous few years, and I have Some Thoughts.

    In this exercise, I examined the financial statements from 2017-18 onwards for the 66 Canadian universities which are not federated with a larger institution and had income over $20 million. L’Université du Québec was excluded from the analysis below because it has yet to release financial statements for 2023-24.

    Figure 1 shows the average net surplus (that is, total income minus total expenditures as a percentage of total income) across all institutions for the fiscal years 2017-18 to 2023-24. As is evident from the graph, fiscal years 2018 through 2021 were all pretty good, apart from 2020 (the stock market did its COVID tank right at the end of the fiscal year and radically reduced investment returns that year), and overall surpluses were in the 6% range, which is not bad. But post-COVID, things got a bit rough, and the returns dropped to about 4%. Note, though, that there is a significant gap between the “big beasts” of the Canadian university scene and everyone else. In the good years, U15 institutions, which in financial terms represent about 60% of the system, saw surpluses about two percentage points higher than non-U15 institutions. Since 2022, the gap has been about three percentage points.

    Figure 1: Average Surpluses as a Percentage of Total Income, Canadian Universities, Fiscal Years 2018 to 2024

    Why have surpluses shrunk in the past few years? No surprise here: it is simply that costs have increased by about 7% in real terms for the past five years (that is about 1.4% above inflation each year), while revenues have only grown 3.7% (0.75% above inflation each year). Income growth has been pretty similar across U15 and non-U15 institutions, but expenditure growth has been significantly larger at non-U15 institutions.

    Figure 2: 5-year real change in Income and Expenditure, Canadian Universities, 2018-19 to 2023-24

    It is worth pointing out here, though, that all of this data is from before any of the effects of the international student visa cap of 2024 come into play. In eight out of ten provinces, it has been income from students that has driven universities’ revenue growth over the past five years. Only in Quebec and British Columbia has government spending been the main driver (and yes, I know, the idea that revenue from students is declining in British Columbia was a bit shocking to me too, but I triple-checked and its true—this is the one part of the country where international student revenue was falling even before Marc Miller started swinging his axe around).

    Figure 3: 5-year real change in Income by Source and Region, Canadian Universities, 2018-19 to 2023-24

    If you assume that international student numbers overall drop by 40% over three years (which is roughly what the government says it wants to achieve), then what we are likely is a decrease of about 11% in total university revenues between now and 2027 (assuming no other changes in enrolment or tuition fees, and an annual increase in government expenditures of inflation plus 1% which is what we saw in last year’s budget cycle but I wouldn’t necessarily bet on it for the future). Meanwhile, if we keep expenditures increasing at inflation plus 1.5%, we will see an increase in expenditures of about 6% by 2028. The result is what I would call a trulyyawning financial gap over the next four years. And it is precisely this that keeps senior admins up at night.

    Figure 4: Projected changes in Income and Expenditure, Canadian Universities, 2017-18 to 2027-28, Indexed to 2017-18

    Now to be clear, I don’t expect the sector to be posting multi-billion dollar gaps implied by Figure 4 (for clarity: while Figure 4 displays changes in projected income and expenditure in index terms, if the gap that opens up between 2024 and 2028 is as depicted here, the change in net position for universities will be equal to about $7 billion in 2028, which given current surpluses of $2 billion/year implies aggregate deficits of about $5 billion/year or about 11% of total income). The income drop will probably not be quite this bad, both because I expect institutions to raise fees on international students, and because I suspect international student numbers will not fall quite this far because provinces will re-distribute spots going unused by colleges (due to the reduction in enrolments that will ensure from last fall’s changes to the post-graduate work visa program). Similarly, the increase in expenditures won’t be this high either because institutions are going to do all they can to “bend the curve” in anticipation of a fall in revenues. But bottom line: there’s a looming $5 billion income gap that has to be closed just to stay in balance, and larger if we want the system to have at least some surpluses for rainy (rainier?) days in future.

    Anyways, back to the present. We can, of course, drill down to the institutional level, too. At this point in the exercise, I have chosen to exclude two more institutions from my calculations. The first is Concordia because it has a unique (and IMHO really irritating) practice of splitting its financial reporting between the institution and its “Foundation” (don’t ask), with the result that the institution’s financial statements alone tend to show the institution as worse off than it really is. The second is Royal Roads, which uniquely took a stonking great write-down on capital investments in 2024 and so frankly looks a lot worse than I think it should.

    So with our sample now down to just 63 institutions, Table 1 shows that in fact most universities have been doing OK over the past few years. Of the institutions included in this part of the analysis, 39 have been deficit-free since 2021-22, and 28 have not shown a deficit in any of the last five years. However, there are three institutions where it might be time to start worrying: Carleton, which has posted three consecutive deficits, and St. Thomas and Vancouver Island University, which have posted deficits in each of the past five years. Carleton is a little bit less worrisome than the other two because it socked away some huge surpluses in the years prior to 2022 and so has a little bit more runway. I’ll come back to the other two in a moment.

    Years in deficit Since 2019-20 Since 2021-22
    5 2
    4 0 n/a
    3 6 3
    2 13 7
    1 16 16
    0 28 39

    Figure 5, below, shows combined net surplus over the past five fiscal years (2019-20 to 2023-24) as a percentage of total revenues. There are eight institutions which have net losses over the past five years, and another eight with surpluses between 0 and 2% of total revenues, which I would characterize as “precarious.” There are another 29 institutions with combined five-year surpluses, which are between 2 and 5% of total revenues, which are not great but not in the immediate danger zone either. Finally, there are 18 institutions with surpluses of 5% or more, which I would characterize as being “safe,” including two (Algoma and Cape Breton) which have five-year surplus rates of over 20% (this is what happens when your student body is 75%+ international)

    Figure 5: Distribution of 5-year aggregate net surpluses, Canadian Institutions, 2019-20 to 2020-24

    But note the right-hand side of that graph. There are two institutions that have five-year deficits equal to more than 4% of their total revenues. And those two are the same two that have posted deficits for each of the past five years: St. Thomas University in New Brunswick and Vancouver Island University in British Columbia. I’ll talk about them in a bit more depth tomorrow.

    Source link

  • HESA has published full student data for 2023–24

    HESA has published full student data for 2023–24

    The 2023-24 HESA student data release was delayed by three rather than six months this year.

    We’re clearly getting better at dealing with the output (and the associated errors) of data collected through the HESA Data Platform. While there are not as many identified issues as in last year’s cycle the list is long and occasionally unnerving.

    Some represent a winding back from last year’s errors (we found 665 distance learning students at the University of Buckingham that should have been there last year), some are surprisingly big (the University of East London should have marked an extra 2,550 students as active), and some are just perplexing: the University of South Wales apparently doesn’t know where 1,570 students came from , the University of Portsmouth doesn’t actually have 470 students from the tiny Caribbean island of St Barthélemy.

    Access and participation

    It is surprising how little access and participation data, in the traditional sense, that HESA now publishes. We get an overview at sector level (the steady growth of undergraduate enrollments from the most deprived parts of England is notable and welcome), but there is nothing by provider level.

    [Full screen]

    One useful proxy for non-traditional students is entry qualifications. We get these by subject area – we learn that in 2025 a quarter of full time undergraduate business students do not have any formal qualifications at all.

    [Full screen]

    With the UK’s four regulators far from agreement as to what should be monitored to ensure that participation reflects potential rather than privilege, it’s not really worth HESA publishing a separate set of UK wide statistics. The closest we get is SEISA, which is now official statistics. I look forward to seeing SEISA applied to UK-domiciled students at individual providers, and published by HESA.

    Student characteristics

    We get by subject area data on disability (at a very general, “marker” – known disability – level) which I have plotted on a by year basis. The axis here is the proportion of students with a known disability – the colours show the total number of students. For me the story here is that creative subjects appear to attract students who disclose disabilities – art and creative writing in particular.

    [Full screen]

    I’ve also plotted ethnicity by provider, allowing you to see the ways in which the ethnic make up of providers has changed over time.

    [Full screen]

    Student domicile (UK)

    UK higher education includes four regulated systems – one in each of the four nations. Although in the main students domiciled in a given nation study at providers based in that same nation, there is a small amount of cross-border recruitment.

    [Full screen]

    Notably nearly three in ten Welsh students study at English providers, including more than a third of Welsh postgraduates. And two in ten Northern Irish students study in England. The concern is that if you move to study, you are less likely to move home – so governments in Wales and Northern Ireland (where there are student number controls) will be thinking carefully about the attractiveness and capacity of their respective systems to avoid a “brain drain”.

    Within these trends, particular providers have proven particularly efficient in cross-border recruitment. If you are a Northern Irish student studying in England chances are you are at Liverpool John Moores University, Liverpool, or Northumbria. If you are Welsh and studying in England your destination may well be UWE, Bristol, Chester – or again, Liverpool John Moores.

    There is a proximity effect – where students are crossing the border, they are likely to stay close to it – but also (if we look at Northern Ireland domiciled students looking at Glasgow or Newcastle) evidence of wider historic cultural links.

    [Full screen]

    Student domicile (international)

    Thinking about providers recruiting from Northern Ireland made me wonder about students from the Republic of Ireland – do we see similar links? As you might expect, the two larger providers in Northern Ireland recruit a significant share, but other winners include the University of Edinburgh and St Margaret’s. UCL has the biggest population among English providers.

    You can use this chart to look at where students from any country in the world end up when they study in the UK (I do insist you look at those St Barthélemy students – literally all at the University of Portsmouth apparently).

    [Full screen]

    An alternate view lets you look at the international population of your institution – the established pattern (China in the Russell Group, India elsewhere) still holds up.

    [Full screen]

    What’s of interest to nervous institutional managers is the way international recruitment is changing over time. This is a more complicated dashboard that helps you see trends at individual providers for a given country, seen along with how your recruitment sits within the sector (mouse over an institution to activate the time series at the bottom.

    [Full screen]

    Source link

  • Retrenchment Watch Newsletter | HESA

    Retrenchment Watch Newsletter | HESA

    This is the first edition of Retrenchment Watch, a new initiative tracking how Canadian post-secondary institutions are reacting to current financial challenges. The Retrenchment Watch monitors the most recent developments, highlighting key trends and institutional responses across the country. Future editions will provide ongoing updates, analysis, and institutional case studies to help sector leaders navigate this challenging period. Updates to the website will be made weekly with summary emails flowing in a biweekly schedule.

    The Impact of Declining International Enrollments

    International students have played a critical role in the financial stability of Canadian post-secondary institutions. Over the past decade, many universities and colleges have relied heavily on international tuition revenue, amidst rising costs, frozen domestic tuition, and stagnant funding from provincial governments. 

    The federal immigration policy changes of 2024—including caps on the number of applications for international study permits that will be processed by IRCC—have caused a steep drop in new international student enrollments across the country.

    Comparison of Study Permit Applications Processed by IRCC, by Month (2023 vs. 2024)

    Source: IRCC Data, “Source Countries – Applications Processed by IRCC for New Study Permit Applications (in Persons) by Month, from January 2022 to December 2024”

    However, the impact of the government’s announcements has reduced the numbers of international students who are actually being enrolled much further than the caps themselves would imply. ApplyBoard is projecting that only 280,000 study permits were approved in 2024, as opposed to 515,880 in 2023, a 45% drop in international student numbers.

    This matches what we are hearing about dramatic falls in international student numbers across the country. However, the drops are much greater at certain institutions. For example, Okanagan College has seen a 50% decline in new international student enrollment, with expectations of a further 70% in the winter term. Thompson Rivers University reported a 50% drop in new undergraduate international enrollments and a 75% drop in post-baccalaureate diploma students. These declines are forcing institutions to make difficult financial decisions to remain operational.

    Budget Deficits

    The enrollment shortfall has translated into substantial budget deficits at many institutions. Universities and colleges across Canada are now facing difficult financial realities, with some implementing drastic cost-cutting measures.

    • York University has the largest projected deficit, at $142 million, and is implementing cost-cutting measures to reduce spending by $130 million over three years.
    • Sheridan College is projecting a $112 million loss in revenue due to falling international student numbers. 
    • University of Waterloo estimates a $75 million deficit.
    • Algonquin College is projecting a $32 million deficit for 2024-25, which is expected to rise to nearly $100 million by 2026-27.
    • Carleton University is projecting a $38 million deficit for 2024-25, expected to reach $70 million by 2025-26.
    • Memorial University reported a $9.5 million revenue loss.

    While these numbers may seem alarming, they don’t tell the full story. Public details on institutional budgets and cuts remain limited and inconsistent. Some institutions report projected deficits, others focus on lost revenue, and many omit details on where cuts will actually fall. Job loss estimates vary widely, and program cuts are often announced without specifying which programs are affected.

    In the coming weeks, we’ll be diving deeper into institutional budgets to provide a clearer picture of what these figures really mean and how they will shape the sector in the years ahead.

    Program Suspensions and Faculty/Staff Layoffs

    To manage financial constraints, many institutions are suspending programs and reducing staff. The impact is particularly severe for smaller colleges and those heavily reliant on international students.

    • Sheridan College is suspending 40 programs and reviewing 27 others, with an estimated 700 layoffs.
    • Fleming College has suspended 29 programs, possibly increasing to 42, due to a $38 million revenue shortfall.
    • Centennial College is suspending 49 programs after experiencing a 43% drop in international student enrollment.
    • St. Lawrence College is cutting 55 programs—approximately 40% of its offerings.
    • Seneca Polytechnic has temporarily closed its Markham campus, which primarily served international students.
    • Fanshawe College is cutting 18 programs this semester.
    • Public-private partnership campuses, set up primarily by Ontario colleges in the Greater Toronto Area, are being wound down.

    Hiring freezes have become common, with institutions like McGill University, Dalhousie University, the University of Waterloo and the University of Alberta pausing recruitment efforts to manage budget shortfalls. A number of institutions, such as Conestoga College and Carleton University, have introduced programs to incentivize voluntary retirement, in the hope that they can reduce salary expenditures without widespread compulsory layoffs.

    However, layoffs are occurring across the sector. Mohawk College has cut 65 full-time administrative staff, amounting to 20% of its administrative workforce. Simon Fraser University has eliminated 85 staff and faculty positions. University of Windsor has already issued layoff notices to 15 employees and is warning of further cuts.

    We know that large, but so far uncounted, numbers of contract instructors are not being rehired as their contracts expire. For example, Okanagan College has canceled 11 part-time term faculty contracts, with up to 80 more positions at risk. Western University is introducing enrollment thresholds to determine whether a course will be offered, with minimum class sizes ranging from 50 for first-year courses to 15 for fourth-year courses. These thresholds imply that contract instructors teaching courses which do not meet the cap are unlikely to have their contracts renewed.

    We will be updating a list of institutional responses on the Retrenchment Watch as they are announced.

    The Recovery Project 

    In response to the widespread retrenchment across Canadian higher education, HESA has launched the Recovery Project. 

    The financial challenges facing Canadian higher education are unprecedented, but they are not insurmountable. Most institutions have survived similar experiences in the past. The HESA Recovery Project helps Canadian colleges, polytechnics, and universities navigate financial challenges by providing insights and facilitating peer learning and collaborative action. Through monthly reports and virtual meetings, leaders gain evidence-based strategies on budget decisions, maintaining morale, and academic redesign. Drawing from interviews with veterans of past periods of retrenchment and case studies of institutions that have successfully come through major cuts, the project delivers actionable guidance. Reports and discussions begin this month, with future topics shaped by member needs to ensure timely, relevant support for institutions adapting to financial pressures. For more information, contact Tiffany MacLennan at [email protected].

    Looking Ahead

    The Retrenchment Watch will continue to monitor and analyze developments across the sector, providing timely updates and insights. The next editions will cover new announcements, policy shifts, and institutional adaptations that arise in response to ongoing financial pressures. 

    For more details, you can visit the Retrenchment Watch webpage. Have something you want to share with us about cuts at your institution? Reach out to us. 

    Source link

  • Ontario in 2029 | HESA

    Ontario in 2029 | HESA

    Back in 2022, just after the last provincial election, I wrote a piece looking forward a few years and predicted that the years 2023-25 were going to be chaos for Ontario postsecondary institutions. And I was right, although I can’t claim to have anticipated any of the specifics. Given that we are now going back into an election, I thought I would try to look into a crystal ball and look at what the province’s postsecondary system will look like financially if our glorious premier is re-elected for another four years.

    To do this, of course, requires making a few assumptions, not just about what will happen in the future but, given the inevitable Canadian delays in producing data, what’s been happening in the past two years as well. Hard data on the student numbers which drive aggregate tuition income does not exist beyond 2022 because the provincial government is deliberately suppressing data on this subject. Yes, really. Until last year, Ontario had one of the best records in the country when it came to openness on enrolment stats, usually publishing quite detailed data within six months of end of the calendar year. As of today, it has now been twenty-one months since the last update. By complete coincidence, the data that has not been updated covers the exact period where provincial government was asleep at the wheel in terms of oversight of international student intake. Can’t have that data going out before an election, I guess.

    Anyways, that means the following projections require a bit more educated guess work than usual. For transparency, here are my assumptions:

    • I have based student number projections for 2023-24 and 2024-25 on data I could find from the Ontario Universities Application Centre (OUAC) and from federal open data on student visas issued up to fall 2024.
    • I am assuming that international student enrolment will bottom out in 2025-26 and resume 10% annual growth thereafter, and that domestic enrolment will grow 2% per year, in line with projected increases in the 18-21 population. The assumptions on international students might be too generous, in which case all my projections will be too optimistic. Keep that in mind as you read this.
    • I am assuming that the provincial government will not add any new funding to the system beyond what was announced in the run-up to the 2024 budget, but that the extra funding announced as a response to the Blue-Ribbon Panel will be maintained past 2027.
    • I am assuming the freeze on tuition will be maintained, but a gentle (but below-inflation) rise in average tuition will continue due to students switching from cheaper humanities courses to more expensive STEM ones.
    • I am going to focus on the main sources of institutional operating income, which are tuition fees and provincial operating government. I am excluding from this analysis anything to do with income from federal or private non-student sources.

    Let’s start with public expenditures on postsecondary education. The problem of falling real public expenditures began well before Ford took power, but this trend has worsened under Ford. Until last year, he consistently allowed inflation to erode funding. The only time he increased institutional funding was in 2024, after the report of the blue-ribbon panel, and even then the three-year package he announced barely allows funding to keep up with inflation. When this new funding evaporates in 2027, the prospects for any new funding are uncertain: I think it is more likely that the government will revert to its previous practice of holding funding constant in nominal dollars but fail to provide any help to offset inflation. Assuming this is true, the path of government funding for Ontario postsecondary institutions will be as shown below in Figure 1.

    Figure 1: Ontario Government Transfers to Post-Secondary Education, 2001-02 to 2028-29 (projected) in Billions of $2023

    Now of course, public funding only makes up about a third of total funding in Ontario postsecondary education. What happens when you include tuition fees? Well, it looks like the graph below, Figure 2. Again, as you can see, the “take-off” point for the system we have today clearly lies in the McGuinty/ Wynne period, but boy howdy did the Ford team double-down on the model it inherited.

    Figure 2: Total Operating Income by Source and Sector, Ontario Public Postsecondary Institutions, 2001-02 to 2028-29 (projected) in Billions of $2023

    Now, this is one of those cases where it helps to disaggregate what is going on in the system and look separately at what’s going on in the universities and colleges. Let’s start with colleges in Figure 3.

    Figure 3: Total Operating Income by Source, Ontario Colleges, 2001-02 to 2028-29 (projected) in Billions of $2023

    I’ve been writing about the big fall in college revenues for a few months now, but even I find this graph shocking. Total operating income to the college system is going to crash by about a third between 2023-24 and 2024-25 and then probably will start to recover thereafter. Basically, you should consider the period 2015-2025 as a huge fever dream that is now breaking and sending the system back to exactly where it was a decade ago, minus about 15% of its public funding and a similar drop in the number of students (domestic enrolment really crashed over the past decade).

    Figure 4 repeats the exercise for universities. This one might seem puzzling for many, because it appears to show very little drop in funding in the 2020s. I mean, yes, there’s a teeny dip in 2024, but absolutely nothing like what we see in the colleges—so why are universities screaming about their untenable financial positions?

    Figure 4: Total Operating Income by Source, Ontario Universities, 2001-02 to 2028-29 (projected) in Billions of $2023

    Well, the answer is that universities don’t have a revenue challenge so much as a cost challenge. Colleges have an enormous amount of freedom to rearrange or reduce staff. Universities, to put it mildly, do not, partly because of tenure and partly because collective agreements between universities and faculty contain clauses about layoffs and financial exigency which impose very high barriers and costs to any institution that tries to reduce academic headcount. This forces institutions to force as many cuts as possible on non-academic staff and services, but there are limits to how much you can do before students start turning away.

    Plus, of course, universities simply got in the habit of getting ever larger. Looke at what happened in the 18 years before the Ford government took power: 17 straight years where the average annual income growth after inflation was 5%. The internal political economy of Ontario universities simply evolved so that growth less than 5% was believed to be “austerity.” Since Ford came to power, annual growth has been effectively zero, even as institutions are dealing with the costs of accommodating the major shift in students from humanities to STEM. The gears inside universities are grinding to a halt and even going in reverse this year and next. And universities are—by design—poorly engineered to deal with a lack of growth.

    So, what can be done? Well, in the world we all wished we lived in, this situation would be attracting serious political attention. But it’s not. Ontarians quite like having world-class universities and colleges; they just don’t feel like paying for it. Had the cuts started a few weeks earlier, or had the election been called a few weeks later, the current Program Apocalypse (which seems more than on course to deliver the closure of over 1000 programs across the province) might have become what political animals call “a kitchen-table issue,” that is an issue so important than voters talk about it at the kitchen table. Kids not being able to get into the programs they want to get into because they have been shut due to budget cuts? Yeah, that’s a kitchen table issue. One that might yet have some impact on the election, though probably not a decisive one.

    Could institutions do more to make this a kitchen table issue? Yes, they could. At the university level, institutions could be more overt in saying they will no longer be able to support as many spots in expensive, high-demand programs. At the college level, institutions could be more aggressive about closing programs in the skilled trades. So far, they have been very reluctant to do this even though their high cost-per-student should probably lead a lot more of them to be on the chopping block if financial sustainability were a major issue. But institutions are reluctant to do this because it’s hard to play chicken with the government without seeming to play chicken with the general public. And the only way things could get worse for institutions right now is if they lose what’s left of the public sympathy they have. Which is to say: yes, they could be doing more, but it’s easy enough to explain their hesitation in doing so.

    Anyways, sorry to readers in the rest of the country for all the Ontario-centricity. If you’d like to know more about how the mess in Ontario—partly due to inept oversight by the Ford team and partly due to an inept response by federal immigration minister Marc Miller—affects the rest of the country (and it does), have a listen to my guest appearance on the Missing Middle podcast last week. Good fun.

    Source link

  • HESA Spring 2025: staff | Wonkhe

    HESA Spring 2025: staff | Wonkhe

    HESA Spring 2025 kicks off in earnest with a full release of the staff data for 2023-24.

    Unlike in previous years, there’s been no early release of the headlines – the statistics release (which provides an overview at sector level) and the full data release (which offers detail at provider level) have both turned up on the same day.

    Staff data has, in previous years, generally been less volatile than student data. Whereas recruitment can and does lurch alarmingly around based on strategic priorities, government vacillation about student visas, and the vagaries of the student market – staff employment tends to be something with a merciful degree of permanency. Even if it isn’t the same staff working under the same terms and conditions, it does tend to need broadly the same number of people.

    With the increasing financial pressures felt by universities you would expect 2023-24 to be a deviation from this norm.

    Starters and leavers

    We’ll start by looking at the numbers of starters and leavers from each provider. This chart shows the change in academic staff numbers year on year between your chosen year and the year before (as the thick bars) and the total number of full and part time staff in the year of your choice (as the thin bars). Over on the other side of the visualisation under the controls you can see total staff numbers, broken down into full and part time as a time series – mouse over a provider on the main chart to change the provider focus here. You can filter by year, and (for the main chart) mode of employment.

    [Full screen]

    What’s apparent is that across quite a lot of the sector academic staff numbers didn’t change that much. There were some outliers at both end – Coventry University had 585 less academic staff in 2023-24 than 2022-23, while Cardiff University has 565 more (yes, the same Cardiff University that confirmed plans for 400 full time redundancies yesterday).

    If you’ve been following sector news this may surprise you – last year saw many providers announce voluntary or compulsory redundancies. The Queen Mary University of London UCU branch has been tracking these announcements over time.

    Schemes like this take time for a university to run – there is a mandatory consultation period, followed (hopefully) by some finessing of the scheme and then negotiations with individual staff members. It is not a way to make a quick, in year, saving. Oftentimes the original announcement is of a far higher number of staff redundancies than actually end up happening.

    Subject level

    If you work in a university or other higher education provider, you’ll know that stuff like this very often happens across particular departments and faculties rather than the whole university. I can’t offer you faculty level from public data, but there is data available by cost centre.

    [Full screen]

    Cost centres are usually used in financial data, and do not cleanly map to visible structures within universities. Here you can select a provider and choose between cost centre groups and cost centres as two levels of detail. I’ve added an option to select contract type – in the main I suggest you leave this as academic (excluding atypical).

    Zero hours

    I’m sure I say this every year, but not all providers return data for non-academic staff (in England they are not required to), and an “atypical” contract usually refers to a very short period of work (a single guest lecture or suchlike). There is a pervasive myth that these are “zero hours” contracts – even though HESA publishes data on these separately:

    Here’s a chart showing the terms of employment and pay arrangements related to zero hours contracts for 2023-24. You can see the majority of these are academic in nature, with a roughly even split between fixed term and open-ended terms. The majority (around 4,075) are paid by the hour.

    [Full screen]

    This represents a small year-on-year growth in the use of this kind of contract – in 2022-23, there were 3,915 academic staff on a zero hour contract

    Subject, age, and pay

    I often wonder about the conditions of academic staff across subject areas, and how this pertains to the age of the academics involved and how much they are paid. This visualisation allows use to view age against salary (relating to groups of spine points on the standard New JNCHES pay scale used in most larger providers).

    [Full screen]

    As you’d expect, overall there is a positive correlation between age and salary – if you are an older academic you are likely to be paid more. This is particularly pronounced in design, creative, and performing arts: where staff are likely to be older and better paid on average. Compare the physical sciences, where more staff are younger and spine points are lower.

    This chart allows you to select a cost centre (either a group or individual cost centre), and filter by academic employment function (teaching, research, both…) and contract level (senior academics and professors, others…). There’s a range of years on offer as well.

    Ethnicity

    The main news stories that tend to come out of this release relate to academic staff characteristics, and specifically the low number of Black professors. There is some positive movement on that front this year, though the sector at that level is in no way representative of staff as a whole, the student body, or wider society.

    [Full screen]

    Source link

  • Student Debt by Ethnicity | HESA

    Student Debt by Ethnicity | HESA

    Hi all. Just a quick one today, this time on some data I recently got from StatsCan.

    We know a fair a bit about student debt in Canada, especially with respect to distribution by gender, type of institution, province, etc. (Chapter 6 of The State of Postsecondary Education in Canada is just chock full of this kind of data if you’re minded to take a deeper dive). But to my knowledge no one has ever pulled and published the data on debt by ethnicity, even though this data has been collected for quite some time through the National Graduates Survey (NGS). So I ordered the data, and here’s what I discovered.

    Figure 1 shows incidence of borrowing for the graduating class of 2020, combined for all graduates of universities and graduates, for the eight largest ethnicities covered by the NGS (and before anyone asks, “indigeneity” is not considered an ethnicity so anyone indicating an indigenous ethnicity is unfortunately excluded from this data… there’s more below on the challenges of getting additional data). And the picture it shows is…a bit complex.

    Figure 1: Incidence of Borrowing, College and University Graduates Combined, Class of 2020

    If you just look at the data on government loan programs (the orange bars), we see that only Arab students have borrowing rates in excess of 1 in 2. But for certain ethnicities, the borrowing rate is much lower. For Latin American and Chinese students, the borrowing rate is below 1 in 3, and among South Asian students the borrowing rate is barely 1 in 5. Evidence of big differences in attitudes towards borrowing!

    Except…well when you add in borrowing from private sources (e.g. from banks and family) so as to take a look at overall rates of borrowing incidence, the differences in borrowing rates are a lot narrower. Briefly, Asian and Latin American students borrow a lot more money from private sources (mainly family) than do Arab students, whites, and Blacks. These probably come with slightly easier repayment terms, but it’s hard to know for sure. An area almost certainly worthy of further research.

    There is a similarly nuanced picture when we look at median levels of indebtedness among graduates who had debt. This is shown below in Figure 2.

    Figure 2: Median Borrowing, College and University Graduates Combined, Class of 2020

    Now, there isn’t a huge amount of difference in exiting debt levels by ethnicity: the gap is only about $6,000 between the lowest total debt levels (Filipinos) and the highest (Chinese). But part of the problem here is that we can’t distinguish the reason for the various debt levels. Based on what we know about ethnic patterns of postsecondary education, we can probably guess that Filipino students have low debt levels not because they are especially wealthy and can afford to go to post-secondary without financial assistance. But rather because they are more likely to go to college and this spend less time, on average, in school paying fees and accumulating debt. Similarly, Chinese students don’t have the highest debt because they have low incomes; they have higher debt because they are the ethnic group the most likely to attend university and spend more time paying (higher) fees.

    (Could we get the data separately for universities and colleges to clear up the confound? Yes, we could. But it cost me $3K just to get this data. Drilling down a level adds costs, as would getting data based on indigenous identity, and this is a free email, and so for the moment what we have above will have to do. If anyone wants to pitch in a couple of grand to do more drilling-down, let me know and I would be happy to coordinate some data liberation).

    It is also possible to use NGS data to look at post-graduate income by debt. I obtained the data by in fairly large ranges (e.g. $0-20K, $20-60K, etc.), but it’s possible on the basis of that to estimate roughly what median incomes are (put it this way: the exact numbers are not exactly right, but the ordinal rank of income of the various ethnicities are probably accurate). My estimations of median 2023 income of 2020 graduates—which includes those graduates who are not in the labour market full-time, if you’re wondering why the numbers look a little low—are shown below in Figure 3.

    Figure 3: Estimate Median 2023 Income, College and University Graduates Combined, Class of 2020

    Are there differences in income here? Yes, but they aren’t huge. Most ethnic groups have median post-graduate incomes between $44 and $46,000. The two lowest-earning groups (Latin Americans and Filipinos) re both disproportionately enrolled in community colleges, which is part of what is going on in this data (if you want disaggregated data, see above).

    Now, the data from the previous graphs can be combined to look at debt-to-income ratios, both for students with debt, and all students (that is, including those that do not borrow). This is shown below in Figure 4.

    Figure 4: Estimated Median 2023 Debt-to-Income Ratios, College and University Graduates Combined, Class of 2020

    If you’re just dividing indebtedness by income (the blue bars), you get a picture that looks a lot like Figure 2 in debt, because differences in income are pretty small. But if you are looking at debt-to-income ratios across all students (including those that do not borrow) you get a very different picture because as we saw in Figure 1, there are some pretty significant differences in overall borrowing rates. So, for instance, Chinese students go from having the worst debt-to-income ratio on one measure to being middle of the pack on another because they have relatively low incidence of borrowing; similarly, students of Latin American origin go from being middle-of-the-pack to nearly the lowest debt-to-income ratios because they are a lot less likely to borrow than others. Black students end up having among the highest debt-to-income ratios not because they earn significantly less than other graduates, but because both the incidence and amount of their borrowing is relatively high.

    But I think the story to go with here is that while there are differences between ethnic groups in terms of borrowing, debt, and repayment ratios, and that it’s worth trying to do something to narrow them, the difference in these rates is not enormous. Overall, it appears that as a country we are achieving reasonably good things here, with the caveat that if this data were disaggregated by university/ college, the story might not be quite as promising.

    And so ends the first-ever analysis of student debt and repayment by ethnic background. Hope you found it moderately enlightening.

    Source link