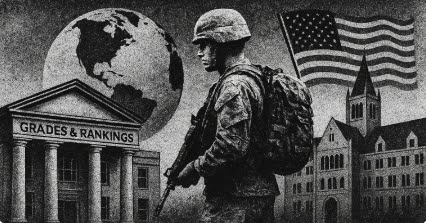
Tag: Inequality

  • How social mobility in HE can reproduce inequality – and what to do about it

    How social mobility in HE can reproduce inequality – and what to do about it

    by Anna Mountford-Zimdars, Louise Ashley, Eve Worth, and Chris Playford

    Higher education has become the go-to solution for social inequality over the past three decades. Widening access and enhancing graduate outcomes have been presented as ways to generate upward mobility and ensure fairer life chances for people from all backgrounds. But what if the very ecosystem designed to level the playing field also inadvertently helps sustain the very inequalities we are hoping to overcome? 

    Social mobility agendas appear progressive but are often regressive in practice. By focusing on the movement of individuals rather than structural change, they leave wealth and income disparities intact. A few people may rise, but the wider system remains unfair – but now dressed up with a meritocratic veneer. We explore these issues in our new article in the British Journal of Sociology, ‘Ambivalent Agents: The Social Mobility Industry and Civil Society under Neoliberalism in England’. We examined the role of the UK’s ‘social mobility industry’: charities, foundations, and third-sector organisations primarily working with universities to identify ‘talented’ young people from less advantaged backgrounds and help them access higher education or elite careers. We were curious – are these organisations transforming opportunity structures and delivering genuine change, or do they help stabilise the present system? 

    The answer to this question is of course complex but, in essence, we found the latter. Our analysis of 150 national organisations working in higher education since the early 1990s found that organisations tend to reflect the individualistic approach outlined above and blend critical rhetoric about inequality with delivery models that are funder-compatible, metric-led and institutionally convenient. Thus – and we expect unintentionally on part of the organisations – they often perform inclusion of ‘talent’ without asking too many uncomfortable structural questions about the persistence and reproduction of unequal opportunities. 

    We classified organisations in a five-part typology. Most organisations fell into the category of Pragmatic Progressives: committed to fairness but shaped by funder priorities, accountability metrics, and institutional convenience. A smaller group acted as Structural Resistors, pushing for systemic change. Others were System Conformers, largely reproducing official rhetoric. The Technocratic deliverers were most closely integrated with the state, often functioning as contracted agents with managerial, metrics-focused delivery models.   Finally, Professionalised Reformers seek reform through evidence-based programmes and advocacy, often with a focus on elite education and professions.

    This finding matters beyond higher education. Civil society – the world of charities, voluntary groups, and associations – has long been seen as the sphere where resistance to inequality might flourish. Yet our findings show that many organisations are constrained or co-opted into protecting the status quo by limited budgets, demanding funders, and constant requirements to demonstrate ‘impact’. Our point is not to disparage gains or to criticise the intentions of the charity sector but to push for honest and genuine change. 

    Labour’s new Civil Society Covenant, which promises to strengthen voluntary organisations and reduce short-termism, could create opportunities. But outsourcing responsibility for social goods to arm’s-length actors also risks producing symbolic reforms that celebrate individual success stories without changing the odds for the many. If higher education is to deliver genuine fairness, we must distinguish between performing fairness for a few and redistributing opportunities for the many. We thus want to conclude by suggesting three practical actions for universities, access and participation teams, and regulators such as the Office for Students.

    1. Audit for Ambivalence 

    Using our typology, do you find you are working with a mix of organisations, or mainly those focused on individuals? (Please contact us for accessing our coding framework to support your institutional or regional audits.) 

    • Rebalance activity towards structural levers

    Continue high-quality outreach, but, where possible, shift resources towards systemic interventions such as contextual admissions with meaningful grade floors, strong maintenance support, foundation pathways with guaranteed progression and fair, embedded work placements 

    Ask the regulator to measure structural outcomes as well as individual ones, at sector and regional levels. When commissioning work, ask for participatory governance and community accountability and measure that too.

    We believe civil-society partnerships can play a vital role – but not if they become the sole heavy-lifter or metric of success. Universities are well positioned to embrace structural levers, protect space for critique, and hold themselves accountable for distributional outcomes. If this happens, the crowded charity space around social mobility could become a vibrant counter-movement for genuine change to opportunities and producing fairness rather than a prop for maintaining an unequal status quo. 

    In terms of research, our next step is speaking directly to people working in the ‘social mobility industry.’ Do they/you recognise the tensions we highlight? How do they navigate them? Have we fairly presented their work? We look forward to continuing the discussion on this topic and how to enhance practice for transformative change.

    Anna Mountford-Zimdars is a Professor in Education at the University of Exeter.

    Louise Ashley is Associate Professor in the School of business and management at Queen Mary University London.

    Eve Worth is a Lecturer in History at the University of Exeter.

    Christopher James Playford is a Senior Lecturer in Sociology at the University of Exeter.

    Author: SRHE News Blog

    An international learned society, concerned with supporting research and researchers into Higher Education

    Source link

  • Higher Education and the US Line of Inequality

    Higher Education and the US Line of Inequality

    Over the past century, the United States has undergone enormous changes in how wealth and income are distributed. From the opulence of the Roaring Twenties to the postwar rise of the middle class, from the tech booms of the 1990s to the pandemic economy of the 2020s, the line of inequality has rarely been flat—and never fair.

    To track these shifts, economists use the Gini Index, a number between 0 and 1 (or 0 and 100 in percentage terms), where 0 represents perfect equality and 1 represents perfect inequality. The U.S. Gini Index has changed dramatically over time, reflecting wars, economic crises, policy decisions, and structural changes in education, taxes, and immigration.

    In the 1920s, the United States experienced a high level of income inequality. The economy was booming for the wealthy, but the benefits of that growth were concentrated at the top. This period, often referred to as the first Gilded Age, was marked by weak labor protections, minimal taxation on the rich, and limited social safety nets. At the same time, immigration was heavily restricted, which limited labor competition but also reinforced the racial and ethnic hierarchies that shaped income and opportunity.

    The Great Depression and World War II marked a dramatic shift. As the economy collapsed in the 1930s, public pressure mounted for systemic reform. New Deal policies expanded labor rights, created Social Security, and introduced public works programs. These efforts, along with wartime wage controls and steep taxes on the wealthy, helped reduce inequality. The federal income tax reached top rates over 90 percent. Education expanded as the GI Bill sent millions of returning veterans—mostly white men—to college and into homeownership. However, the benefits of this postwar expansion were unequally distributed, with Black Americans and other minorities largely excluded through redlining, school segregation, and discriminatory lending.

    From the 1950s to the 1970s, the U.S. experienced what some call the Great Compression. Income gaps between rich and poor narrowed. Manufacturing jobs were abundant, union membership was high, and wages grew alongside productivity. Federal and state investments in education opened doors for many, although property taxes, which fund most local public schools, reinforced disparities between wealthier suburbs and poorer cities or rural communities. Immigration remained limited during these decades, and federal tax policy remained progressive. The Gini Index stayed relatively stable, reflecting broad-based growth and a more equal distribution of income.

    The 1980s brought a reversal. The Reagan administration cut top income tax rates dramatically, weakened labor unions, and deregulated many industries. The economy became more financialized, and capital gains were increasingly favored over wages. Globalization and the offshoring of manufacturing jobs weakened the bargaining power of American workers. At the same time, immigration increased, often filling low-wage and precarious jobs in agriculture, construction, and service industries. While immigration boosted overall economic output, it also contributed to greater income stratification within certain sectors.

    The Gini Index rose steadily through the 1980s and 1990s. The tech boom created vast wealth for a small segment of the population, while wages for most workers stagnated. Public universities saw declining state support, leading to tuition hikes and the explosion of student loan debt. Property taxes continued to shape educational inequality, with affluent districts able to fund advanced programs and facilities while lower-income schools struggled. Tax policy changes in the 2000s, including further reductions in capital gains and estate taxes, widened the gap between those who earn their income from investments and those who rely on wages.

    The 2008 financial crisis deepened existing divides. While wealthy households recovered quickly due to stock market gains and low interest rates, working-class families faced job losses, home foreclosures, and long-term economic insecurity. Federal stimulus programs helped avert total collapse, but they did little to reverse decades of rising inequality. By the 2010s, the U.S. Gini Index was among the highest in the developed world.

    In the early 2020s, the COVID-19 pandemic once again exposed the structural weaknesses in the American economy. Emergency relief programs and expanded unemployment benefits briefly reduced poverty in 2020, but these were temporary fixes. Billionaires saw massive increases in wealth, while millions of essential workers faced health risks, layoffs, and housing instability. Public schools and universities adapted to online learning, but the digital divide left many students behind. Property taxes remained the primary source of school funding, preserving long-standing inequalities in education. Immigrants continued to perform essential but undervalued labor, often without access to healthcare or legal protections.

    Federal tax policy remains tilted toward the wealthy. Income from stocks and real estate is taxed at lower rates than income from work. Loopholes and deductions allow corporations and the ultra-rich to minimize their tax bills. At the same time, working families face regressive payroll taxes and growing out-of-pocket costs for healthcare, education, and housing.

    Higher education, once seen as a pathway to mobility, increasingly reflects the same patterns of inequality seen in the broader economy. Elite universities with billion-dollar endowments serve a small, privileged student population. Public colleges and community colleges—where most students from working-class and minority backgrounds enroll—operate on tight budgets and often rely on underpaid adjunct faculty. Rising tuition, administrative bloat, and student debt have turned education into both a product and a burden.

    The Gini Index provides a simple way to measure inequality, but it does not capture all of the structural forces behind it. To understand why inequality remains so persistent, we must look at the systems that shape opportunity from birth: local property taxes, unequal schools, debt-financed higher education, regressive tax codes, and immigration policies that create a stratified labor market.

    The line of inequality in the United States is not just a chart—it’s a reflection of who holds power, who gets access, and who pays the price. Changing that line will require more than numbers. It will take bold public action, political courage, and a serious rethinking of how we fund education, how we tax wealth, and how we value labor in an age of digital capitalism.

    The Higher Education Inquirer will continue to trace the contours of inequality—across classrooms, campuses, and communities—because understanding the line is the first step to redrawing it. 

    Sources

    Piketty, Thomas, Saez, Emmanuel, and Zucman, Gabriel. Distributional National Accounts: Methods and Estimates for the United States. Quarterly Journal of Economics, 2018.

    Congressional Budget Office. The Distribution of Household Income, 2019. Published November 2022.

    https://www.cbo.gov/publication/58528

    U.S. Census Bureau. Income and Poverty in the United States: 2022.

    https://www.census.gov/library/publications/2023/demo/p60-280.html

    Economic Policy Institute. State of Working America: Wages.

    https://www.epi.org/data/#?subject=wages

    Goldin, Claudia and Katz, Lawrence F. The Race Between Education and Technology. Harvard University Press, 2008.

    Chetty, Raj et al. The Fading American Dream: Trends in Absolute Income Mobility Since 1940. Science, 2017.

    Desmond, Matthew. Evicted: Poverty and Profit in the American City. Crown Publishing, 2016.

    Kuznets, Simon. Economic Growth and Income Inequality. American Economic Review, 1955.

    Saez, Emmanuel and Zucman, Gabriel. The Triumph of Injustice: How the Rich Dodge Taxes and How to Make Them Pay. W.W. Norton & Company, 2019.

    OECD. Income Inequality (Gini Coefficient).

    https://data.oecd.org/inequality/income-inequality.htm

    National Center for Education Statistics. Revenues and Expenditures for Public Elementary and Secondary Education.

    https://nces.ed.gov/programs/coe/indicator/cma

    Urban Institute. The Unequal Distribution of State and Local Revenues.

    https://www.urban.org/sites/default/files/publication/98725/the-unequal-distribution-of-state-and-local-revenues_1.pdf

    Institute on Taxation and Economic Policy (ITEP). Who Pays? A Distributional Analysis of the Tax Systems in All 50 States.

    https://itep.org/whopays/

    Migration Policy Institute. Immigrant Workers: Vital to the U.S. COVID-19 Response, Disproportionately Vulnerable.

    https://www.migrationpolicy.org/research/immigrant-workers-us-covid-19-response

    National Bureau of Economic Research. Education and Inequality Across the American States.

    https://www.nber.org/papers/w31455

    Source link

  • The Last Class with Robert Reich (Inequality Media Civic Action)

    The Last Class with Robert Reich (Inequality Media Civic Action)

    Former Secretary of Labor Robert Reich might be famous for his public service, best-selling books, and viral social media posts, but he always considered teaching his true calling. The Last Class captures a master educator wrestling with the dual realities of his own aging and his students inheriting a world out of balance. Reich confronts the impending finality with unflinching candor, humor, introspection, and a rawness of emotion he has never shared publicly before.

    One thousand students fill the biggest lecture hall on campus—the last class to receive Reich’s wisdom and exhortations not to accept that society has to stay the way it is. His final assignment: Who will be the teachers of tomorrow?

    Source link

  • Podcast: Free speech, uni finances, regional inequality

    Podcast: Free speech, uni finances, regional inequality

    This week on the podcast the government is to press on with implementing parts of the Higher Education (Freedom of Speech) Act 2023 while seeking to repeal others – we discuss what will (and should) happen next.

    Plus there’s a report on more resilient and sustainable higher education finances, and NEON has been looking at regional inequality in university admissions.

    With Richard Sykes, Partner at Mills & Reeve, Paul Greatrix, HE expert and until recently Registrar at the University of Nottingham, Debbie McVitty, Editor at Wonkhe and presented by Mark Leach, Editor-in-Chief at Wonkhe.

    Read more

    Bridget Phillipson reaffirms commitment to free speech

    Resolving the tensions in campus culture requires leadership from within

    Connect more: creating the conditions for a more resilient and sustainable HE sector in England

    New NEON research shows widening regional inequalities in university admission for poorer students

    Widening access needs more flexibility

    You can subscribe to the podcast on Acast, Amazon Music, Apple Podcasts, Spotify, Deezer, RadioPublic, Podchaser, Castbox, Player FM, Stitcher, TuneIn, Luminary or via your favourite app with the RSS feed.

    Source link

  • Post-Levelling Up: A New Agenda for Regional Inequality in Higher Education

    Post-Levelling Up: A New Agenda for Regional Inequality in Higher Education

    ***It’s not too late to register for HEPI’s events this week: ‘Earning and learning: What’s the reality for today’s students?‘ webinar with Advance HE at 10am, Tuesday 14 January and ‘Who Pays? Exploring Fairer Funding Models for Higher Education‘ Symposium at Birkbeck, Thursday 16 January 10am to 5pm.***

    By Professor Graeme Atherton, Director of the National Education Opportunities Network (NEON) and the Vice-Principal of Ruskin College, Oxford.

    In the post-levelling up era, the debate about regional inequality and what it constitutes continues. Insofar as higher education progression is concerned, regional differences were a constant theme of widening access work well before levelling up. On an annual basis, we have seen progress in the percentage of younger learners from low-participation neighbourhoods progressing to higher education.

    However, the situation regarding those progressing to higher education from free school meal (FSM) backgrounds is more complex. Our new report, ‘Access to Higher Education and Regional Inequality: who is missing out? ’, released today, is our second in-depth analysis of the Department for Education’s annual data set on progression to higher education by those from FSM and non-FSM backgrounds in England.

    When these data were published last October, the media focused on the fact that, for the first time since the data were first produced in 2005-06, the percentage of learners from FSM backgrounds progressing to higher education by age 19 fell year on year, from 29.2% in 2021-22 to 29% in 2022-23. But as Figure 1 shows, while the rate has dropped, the number of FSM learners has increased between 2021-22 and 2022-23 by 2,754 (from 19,443 to 22,197). This is the biggest annual increase since 2005-06. The national rate was dragged down by a significant increase in the number of FSM-eligible learners. While more FSM learners are going to higher education, the number of non-FSM learners has increased even more, meaning the national gap has widened.

    Looking at these data in detail also reveals considerable variation in progression across regions and areas. A report has already been published in 2025 predicting a gap in graduates between London and other regions of up to 40% by 2035. There is a near-20-percentage point gap in the progression of FSM learners between London and the next region – a gap that has increased over the last 10 years.

    So strong is London’s performance that it masks some of the challenges across England. At the local authority level, as shown in Figure 2, nearly 70% of areas are below the national average FSM progression rate of 29% and a quarter are at less than 20%.

    chart visualization

    However, while some of these areas may still be below the national average, over the past 10 years these areas have made the most progress. Understanding more about why they have improved while others with ostensibly similar characteristics have not would be a valuable exercise. In contrast, London, while remaining far ahead of anywhere else, has somewhat plateaued.

    As argued above, focusing on geographical differences in higher education participation between different areas of England is not new. This year sees the 21st anniversary of the Aimhigher programme, the first national, locally-focused collaborative outreach initiative for widening access. A string of similar programmes followed, most recently the Uni Connect initiative. Despite the continual chopping and changing of these programmes, they have been effective in contributing to the increases in progression to higher education from low-participation neighbourhoods referred to above, as this is what they have been told to focus on. While FSM as a measure has its well-documented limitations, it is the least worst option when compared to a neighbourhood measure which does not take into account the backgrounds of individual learners. It is now time for a new, rejuvenated collaborative outreach programme that focuses on inequalities in higher education participation as measured by the FSM progression data.

    The Office for Students recently announced its support for a new collaborative outreach programme and this is welcome. But any new programme, as well as focusing on the progression of FSM learners, must be sufficiently resourced. This could potentially happen through, at least in part, higher education providers pooling their efforts across a given area at pre-16 and being effectively co-ordinated at the national level, which has not been the case in previous iterations of such programmes. It must also be a part of the government’s forthcoming post-16 education strategy and any shifts to a broader more collaborative, ‘tertiary’ approach with regional dimensions.

    Finally, it is already becoming apparent that Labour, while right to jettison levelling up, is lacking a replacement policy agenda to address regional inequality. Levelling up, while a damp squib in terms of impact, voiced what many in the country feel about their lives, where they live and what inequality means to them. It didn’t though include inequalities in access to higher education. This can and must change.

    Source link