Tag: Infographic

  • Infographic: What 21,000+ Students Say About Top Hat

    Infographic: What 21,000+ Students Say About Top Hat

    It’s that time: the days are becoming shorter, temperatures are beginning to dip and more importantly, educators and students have returned to the classroom. At Top Hat, we recognize the value of ensuring every student comes to class prepared and excited to learn. We recently surveyed more than 21,000 students who used Top Hat in the Spring 2024 term about the impact our engagement platform and content solutions had on their academic journey. From interactive readings to in-the-moment study support, here’s how Top Hat made a tangible difference in their studies.

    Greater preparedness = better retention

    When students arrive to class feeling prepared, they’re more likely to persist. Data from the American Council on Education and the School of Education and Information Studies at the University of California at Los Angeles backs this up. The report finds that three out of five students surveyed state academic underperformance drove their decision to leave college for more than one term.

    Faculty have made tremendous strides in providing opportunities for frequent, low-stakes knowledge checks during the term. The emphasis on bite-sized assessments hasn’t gone unnoticed among students. “Real-time quizzes and polls not only helped reinforce key concepts but also encouraged active participation among students. Top Hat has truly enhanced our classroom interaction and made learning more enjoyable,” says Muhammad Ali Gajani at Indiana University Bloomington.

    An image that reads: 87% of students say that Top Hat helped them feel engaged in the learning process.

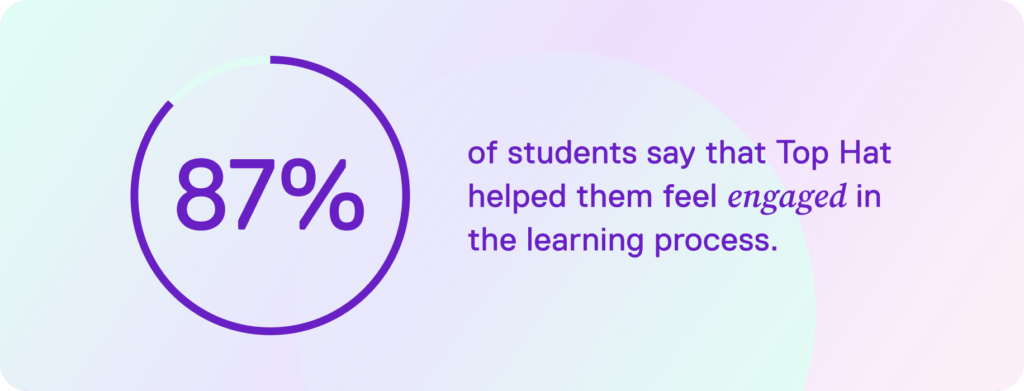
    Students bring an array of opinions and interests to your course. It’s why they value the opportunity to be active participants in the classroom. Research also shows that students who learn using active learning methods perform better on tests than those who sit in long-form lectures. Students echoed the impact Top Hat’s interactive polls, quizzes and discussions had when applying their knowledge. “Top Hat helped me perform better in my class as well as apply my understanding to my homework and exams,” shares Jacob Purcell at West Texas A&M University. An anonymous student from Texas State University at San Marcos chimes in. “It helped me to pay attention and stay engaged, getting me a better grade.”

    Turning static readings into an interactive experience

    We hear from educators that students don’t always complete their reading assignments before class. Over the years, students have tried to take shortcuts to their readings by searching for online summaries. How have educators responded? For starters, they’ve chosen to create ‘snackable’ content with media and real-world case studies that reflect an ever-changing world. Faculty have also relied on Top Hat’s personalized and interactive content solutions to ensure students have opportunities to read and then apply their understanding of concepts in the form of embedded polls and discussions.

    An image that reads: 90% of students who used a Top Hat Interactive eText recommend their instructor use Top Hat again.

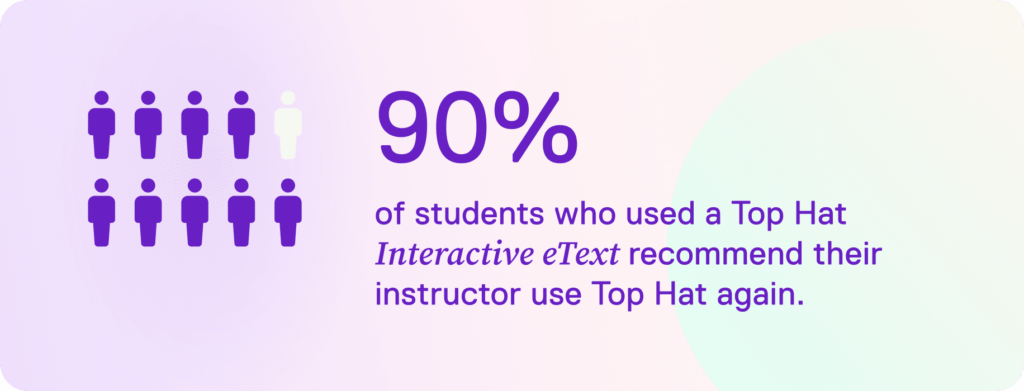
    No matter discipline, students have responded favorably to using Top Hat titles in their course. “I loved the interactive aspect of my Top Hat textbook. Engaging with models, watching videos, and answering questions in chapters was really interesting and valuable to my learning experience,” shares an anonymous student at the University of South Dakota. Learners also appreciate the digestible nature of Top Hat Interactive eTexts. “With Top Hat, I felt that I could easily understand the information and stayed focused throughout my reading for the first time,” shares an anonymous student at Northern Virginia Community College.

    Making participation less intimidating

    An image that reads: 2 out of 5 students say that being able to ask questions to their instructor anonymously helps foster a sense of belonging.

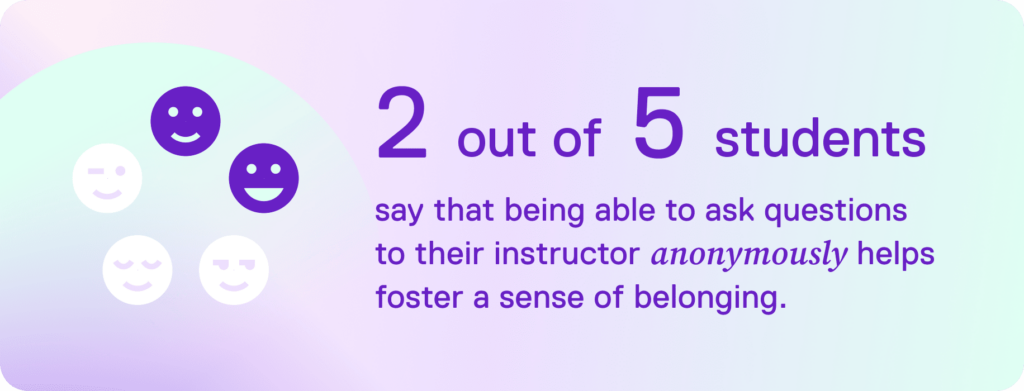
    Raising your hand in a large class can come with a good deal of intimidation. Students place increased importance on asking questions anonymously and without fear of judgment. It’s why millions of students have flocked to Generative AI platforms such as ChatGPT for instant study guidance. Educators have tapped into the heightened interest in AI and have shared ethical use principles with students. Some faculty have even allowed students to build off content generated by a Large Language Model. For instance, English professors may let students use ChatGPT to form a thesis statement for an essay and ask them to critique the strengths and weaknesses of the generated response.

    An image that reads: “Ace was helpful. There were several occasions where I had questions that needed to be answered immediately and Ace was always there to save the day.” Student at the University of West Florida

    More than 630 of our survey respondents used Top Hat Ace, our AI-powered teaching and learning assistant, in the Spring term. Their comments revealed three primary ways that they relied on Ace through the course of their study. 

    1. Provide clarity: Students valued receiving clarification on challenging concepts covered in lecture or while reading their assigned text. “I liked that [Ace] asked a thought-provoking question after answering to promote continuous understanding of the topic, not just giving me the answer,” shares an anonymous student at Oakton Community College.
    2. Personalize study support: Students often relied on Ace for course-specific guidance when completing homework. The best part: since responses are built from the context of the course, students feel like they’re learning along the way versus being handed answers. “I love Ace! I would ask questions and Ace always believed in me that I could answer the question on my own so it would just recommend a section of the module to re-read,” says Nazli Kircicek at McGill University.
    3. Assess knowledge on the fly: Several students highlighted how Ace allows them to reduce their knowledge gaps in advance of tests. Many also used Ace as a tool to apply their understanding of concepts in a low-stakes, low-stress environment. “Ace was able to create sample exam questions relating to the content we were learning in class to prepare for exams during lectures,” shares an anonymous student at Grand Valley State University.

    → New Ebook: FREE strategies to use AI effectively in any course

    Source link

  • Perplexing Problems in ACPA Student Technology Infographic – MistakenGoal.com

    Perplexing Problems in ACPA Student Technology Infographic – MistakenGoal.com

    I’ve whined about bad infographics and I try to avoid complaining about their continuing proliferation.  But I can’t bite my tongue about this ACPA infographic purporting to show information about technology usage by undergraduate students.  It’s bad not just because it’s misrepresenting information but because it’s doing so in the specific context of making a call for quality research and leadership in higher education.

    There are some serious problems with the layout and structure of the infographic but let’s focus on the larger issues of data quality and (mis)representation.  I’ve labeled the three major sections of this infographic in the image to the right and I’ll use those numbers below to discuss each section.

    Before I dive into the specific sections, however, I have to ask: Why aren’t the sources cited on the infographic? They’re listed on the ACPA president’s blog post (and perhaps other places) but it’s perplexing that the authors of this document didn’t think it important to credit their sources in their image.

    Section 1: Student use of technology in social interactions and on mobile devices

    The primary problem with this section is that uses this Noel-Lovitz report as its sole source of information and generalizes was beyond the bounds of that source.  The report is based on a phone survey of “2,018 college-bound high school juniors and seniors (p. 2)” but that limitation is completely lost in this infographic.  If this infographic is supposed to be about all U.S. undergraduate students, it’s inappriopriate to generalize from a survey of high school students and misleading to project their behaviors and desires directly onto undergraduate students.  For example, just over half (51.1%) of all undergraduate students are 21 years old or younger (source) so it’s problematic to assume that the half of college students who are over 21 exhibit the same behaviors and desires as high school students.

    I can’t help but also note just how bad the visual display of information is in the “social interactions” part of this infographic.  The three proportionally-sized rectangles placed immediately next to one another make the entire thing appear to be one horizontal stacked bar when in fact they are three independent values unrelated to one another. This is very misleading!

    Section 2: Cyberbullying

    It’s laudable to include information about a specific use of technology that is harmful for many students but like the first section this information is inappropriately and irresponsibly generalizing from a small survey to a large population.  In this instance, 276 responses to a survey of students at one university are being presented as representative of all students.  Further, the one journal article cited as the source for these data doesn’t provide very much information about the survey used to gather these data so we don’t even have many reassurances about the quality of these 276 responses.  And although response rate isn’t the only indicator of data quality we should use to evaluate survey data, this particular survey only had a 1.6% response rate which is quite worrying and makes me wonder if the data are even representative of the students at that one university.

    Section 3: Information-seeking

    The third section of this infographic is well-labeled and uses a high quality source.  I’m not sure how useful it is to present information about high school students in AP classes if we’re interested in the broader undergraduate population but at least the infographic correctly labels the data so we can make that judgement ourselves. In fact, the impeccable source and labels used in this section make the problems in other two sections even more perplexing.


    This is all very frustrating given the context of the image in the ACPA president’s blog post that explicitly calls for ACPA to “advance the application of digital technology in student affairs scholarship and practice and to further enhance ACPA’s digital stamp and its role as a leader in higher education in the information age.”  Given that context, I don’t what to make of the problems with this infographic.  Is this just a sloppy image hurriedly put together by one or two people who made some embarassing errors in judgement?  Or does this reveal some larger problems with how some student affairs professionals locate, apply, and reference research?*

    * I bet that one problem is that many U.S. college and university administrators, including those in student affairs, automatically think of “college student” as meaning “young undergraduate student at 4-year non-profit college or university.”  It’s completely natrual that we all tend to focus on the students on our campuses but when discussing the larger context – such as when working on a task force in an international professional organization that includes members from all sectors of higher education – those assumptions need to at least be made clear if not completely set aside.  In other words, it’s somewhat understandable if the authors of this image only work with younger students at 4-year institutions because then some of their generalizations make some sense.  They’re still inappropriate and indefensible generalizations, however, but they’re at least understandable.

    Source link