Tag: Inform

  • How can evolving student attitudes inform institutional Gen-AI initiatives?

    How can evolving student attitudes inform institutional Gen-AI initiatives?

    This HEPI blog was authored by Isabelle Bristow, Managing Director UK and Europe at Studiosity.

    In a HEPI blog published almost a year ago, Student Voices on AI: Navigating Expectations and Opportunities, I reported the findings of global research Studiosity commissioned with YouGov on students’ attitudes towards artificial intelligence (AI). The intervening year would be considered a relatively small time period in a more regular higher education setting. However, given the rapid pace of change within the Gen-AI sphere, this one year is practically aeons.

    We have recently commissioned a further YouGov survey to explore the motivations, emotions, and needs of over 2,200 students from 151 universities in the UK.

    Below, I will cover the top five takeaways from this new round of research, but first, which students are using AI?

    • 64% of all students have used AI tools to help with assignments or study tasks.
    • International student use (87%) is a staggering 27% higher than their domestic student counterparts (60%).
    • There’s a 21% difference between students who identify as female who said they have never used AI tools for study tasks (42%) compared with those identifying as male (21%).
    • Only 17% of students studying business said they have never used it, compared with 46% studying Humanities and Social Sciences.
    • The highest reported use is by students studying in London at 78%, and conversely, the highest non-use was reported by students studying in Scotland at 44%.

    The Top Five Takeaways:

    1. There is an 11% increase from last year in students thinking that their university is adapting fast enough to provide AI study support tools.

    Following a year of global Gen-AI development and another year for institutions to adapt, students who believe their university is adjusting quickly enough remain in the minority this year at 47%, up from 36% in 2024. The remaining 53% of student respondents believe their institution has more to do.

    When asked if they expect their university to offer AI support tools to students, the result is the same as last year – with 39% of students answering yes to this question. This was significantly higher for male students at 51% (up by 3% from last year) and for international students 61% (up by 4% from last year). Once again, this year, business students have the highest expectations at 58% (just 1% higher than last year). Following this, medicine (53%), nursing (48%) and STEM (46%) were more likely to respond ‘Yes’ when asked if they expect their university to provide AI tools.

    1. Some students have concerns over academic integrity.

    When asked if they felt their university should provide AI tools, students who answered’ no’ were given a free text box to explain their reasoning. Most of these responses related to academic integrity.

    ‘I don’t think unis support its use because it helps students plagiarise and cheat.’

    ‘I think AI beats the whole idea of a degree, but it can be used for grammar correction and general fluidity.’

    ‘Because it would be unfair and result in the student not really learning or thinking for themselves.’

    Only 7% of students said they would use an AI tool for help with plagiarism or referencing (‘Ask my lecturer’ was at 30% and ‘Use a 24/7 university online writing feedback tool’ was at 21%).

    1. Students who use AI regularly are less likely to rank ‘fear of failing’ as one of their top three study stresses

    We asked all students – regardless of their AI use – of their top three reasons for feeling stressed about studying the responses were as follows:

    • 61% of all UK students included ‘fear of failing’ in their top 3 reasons for feeling stressed about studying;
    • 52% of all students included ‘balancing other commitments’; and
    • 41% of all students included ‘preparing for exams and assessments’.

    These statistics change when we filter by students who use AI tools to help with assignments or study tasks. Fear of failing is still the highest-ranked study stress. The percentage of respondents who rank fear of failing in their top three study stresses by AI use are as follows:

    • 69% for those who never use AI;
    • 62% for those who have used AI once or twice;
    • 58% for those who have used AI a few times and;
    • 50% for those who use AI regularly.

    Looking at the main reasons students want to use the university’s AI service for support or feedback, this year, ‘confidence’ (25%) overtook ‘speed’ (16%). Female respondents, in particular, are using AI for reasons relating to confidence at 29%, compared to 20% for male students. International students valued ‘skills’ the most at 20%, significantly higher than their domestic student counterparts at 11%.

    1. Students who feel like they belong are more likely to use AI.

    We examined the correlation between students’ sense of belonging in their university community, and the amount they use AI tools to help with assignments or study tasks.

    For students who feel like they belong, 67% said they have used AI tools to help with assignments or study tasks; this compares with 47% for students who do not feel like they belong.      

    5. Cognitive offloading (using technology to circumvent the ‘learning element’ of a task) is a top concern of academics and institutional leadership in 2025. However, student responses suggest they feel they are both learning and improving their skills when using generative tools.

    When asked if they were confident they are learning as well as improving their own skills when using generative tools, students responded as follows:

    • 12% ‘were extremely confident that they were learning and developing skills;
    • 31% were very confident;
    • 29% were moderately confident;
    • 26% were moderately confident; and
    • Only 5% were not at all confident that this was true.

    Conclusion:

    Reflecting on the three years since Gen-AI’s disruptive entrance into the mainstream, the sector has now come to terms with the power, potential, and risks of Gen-AI. There is also a significantly better understanding of the importance of ensuring these tools enhance student learning rather than undermining it by offloading cognitive effort.

    Leaders can look to a holistic approach to university-approved, trusted Gen-AI support, to improve student outcomes, experience and wellbeing.

    You can download the full Annual Global Student Wellbeing Survey – UK report here.

    Studiosity is a HEPI Partner. Studiosity is AI-for-Learning, not corrections – to scale student success, empower educators, and improve retention with a proven 4.4x ROI, while ensuring integrity and reducing institutional risk. Studiosity delivers ethical and formative feedback at scale to over 250 institutions worldwide. With unique AI-for-Learning technology, all students can benefit from formative feedback in minutes. From their first draft to just before submission, students receive personalised feedback – including guidance on how they can demonstrably improve their own work and critical thinking skills. Actionable insight is accessible to faculty and leaders, revealing the scale of engagement with support, cohorts requiring intervention, and measurable learning progress.

    Source link

  • 7 Trends to Inform Online Program Expansion in 2025

    7 Trends to Inform Online Program Expansion in 2025

    As I reviewed the new IPEDS data release last week, I was looking for the data and intelligence that would be most helpful for online enrollment leaders to have in hand to underpin and inform this year’s success. These points, in combination with key trends that became clear in other sources I reviewed late last year will enable online leaders to succeed this year as well as plan for the future.

    Note that I am not discussing changes that may emerge after January 20, but I will be doing so after a long talk I have scheduled with Cheryl Dowd from WCET who tracks online regulations and with whom I will be co-presenting at the RNL National Conference this summer.

    So, what do you need to know?

    1. Online and partially online enrollment continue to dominate growth.

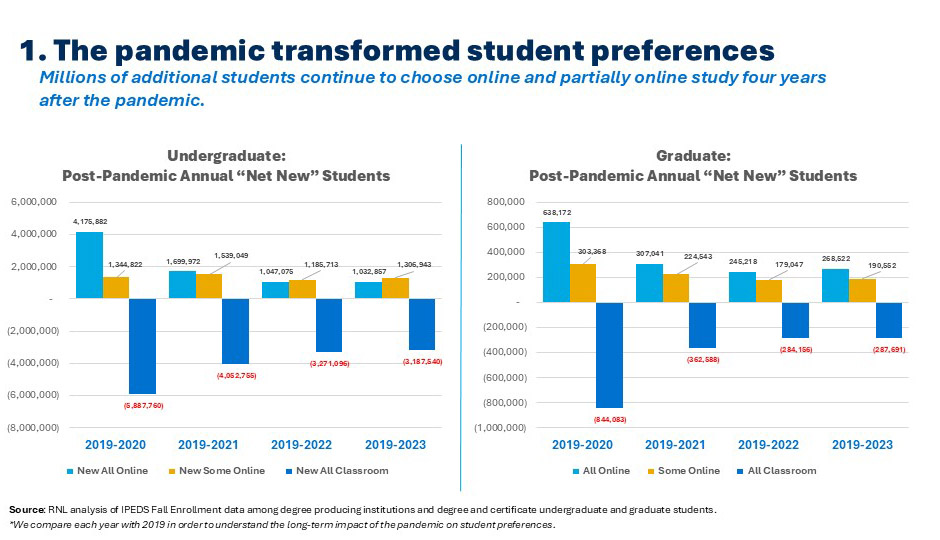
    Four years after the pandemic, more students each year are continuing to decide to enroll in either fully or partially online study. While year-over-year change in every post-pandemic year has seen some “return to the classroom,” when compared with pre-pandemic enrollment (2019), 2.3 million more undergraduates and 450k more graduate students are choosing fully or partially online study. Perhaps more important, 3.2 million fewer undergraduates and 288k fewer graduate students are choosing classroom-only programs. Institutions seeking to grow enrollment must develop processes to quickly determine the best online programs to offer and get them “to market” within 12 months.

    Chart showing the pandemic transformed student preferences as millions of additional students chose online and partially online study

    2. Institutions seeking to grow online enrollment are now competing with non-profit institutions.

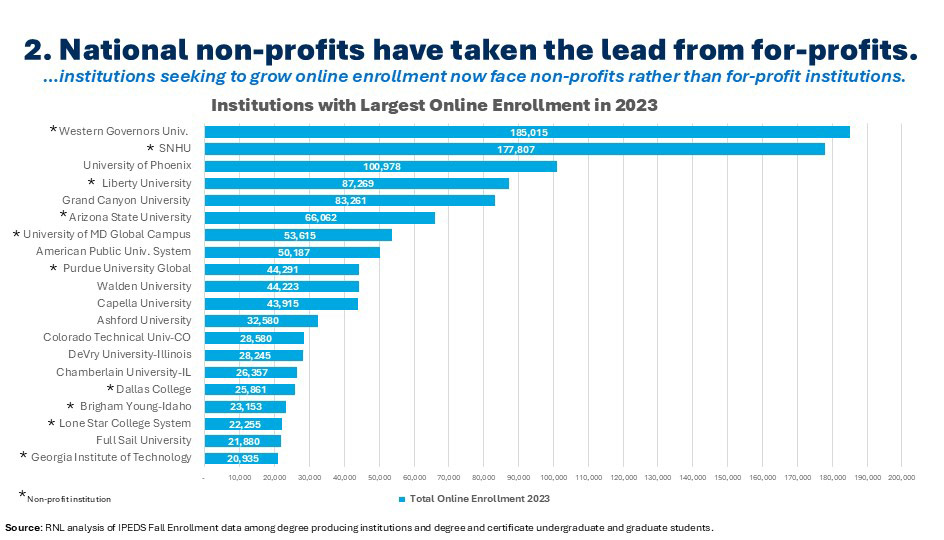
    As recently as five years ago, your strongest competition came from for-profit institutions. In some ways, these institutions were easy to beat (excepting their huge marketing budgets). They had taken a beating in the press to the extent that students knew about it, and they were far away and unknown. Today, institutions face no less of a competitive environment, but the institutions dominating the scene – and most likely a students’ search results – are national non-profits. These institutions are, of course, not local so they aren’t well known, but they have not been through the scrutiny which eroded interest in the for-profits. Student search engine results are also now filled with ambitious public and private institutions seeking to “diversity their revenue streams.” As such, institutional marketers need to adjust their strategies focused on successfully positioning their programs in a crowded market, knowing that they can “win” the student over the national online providers if they ensure that they rise to the top of search results.

    Graph showing national non-profits have taken the lead from for-profit institutions.Graph showing national non-profits have taken the lead from for-profit institutions.

    3. Online enrollment growth is being led by non-profit institutions.

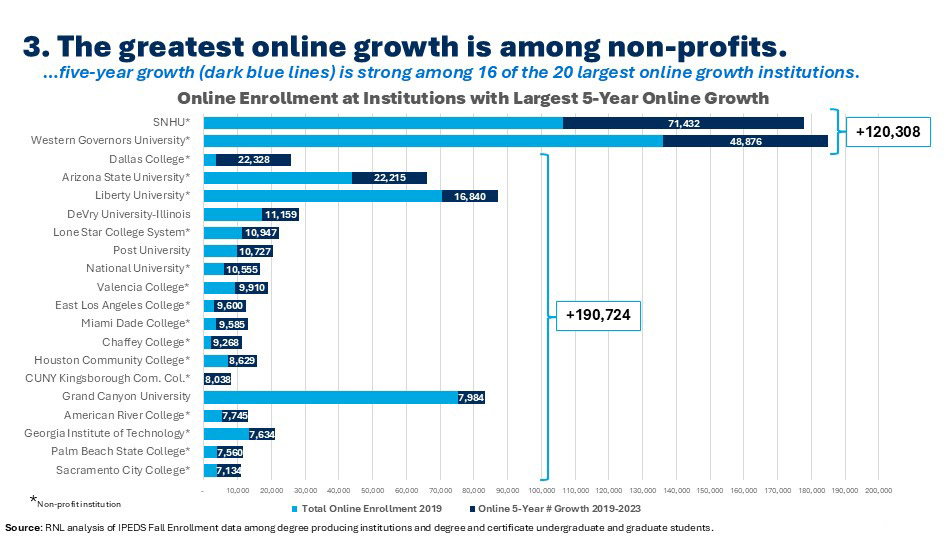
    Seventeen of the 20 institutions reporting the greatest growth in online enrollment over the last five years are nonprofit institutions—a mix of ambitious public and private institutions and national non-profits. What is more, the total growth among institutions after the two behemoths far exceeds Southern New Hampshire University and Western Governors University. These nimble and dynamic institutions include a variety of institution types (with community colleges well represented) across the higher education sector. Institutions seeking to grow online enrollment should research what these institutions are offering and how they are positioning their programs in the market and emulate some of their best practices.

    Chart showing that the greatest online growth is among non-profit colleges.Chart showing that the greatest online growth is among non-profit colleges.

    4. New graduate program growth is dominated by online/partially online offerings.

    In 2024, a research study by Robert Kelchen documented growth in the number of available master’s programs in the U.S. over the last 15 years. Not only did Kelchen document a massive expansion in availability (over the 15-year period, institutions launched nearly 14,000 new master’s programs on a base of about 20,000), but also that the pace of launching online or hybrid programs dramatically outpaces classroom programs. This rise in available offerings far outpaces the rate of growth of the online student market, resulting in significantly higher levels of competition for each online student. Institutions seeking to grow their online footprint must ensure that they fully understand both the specific demand dynamics for each of their programs and the specifics of what online students want in their program. A mismatch on either factor will inhibit growth.

    Graph showing online/hybrid programs are driving new program development.Graph showing online/hybrid programs are driving new program development.

    5. Online success is breeding scrutiny of outcomes.

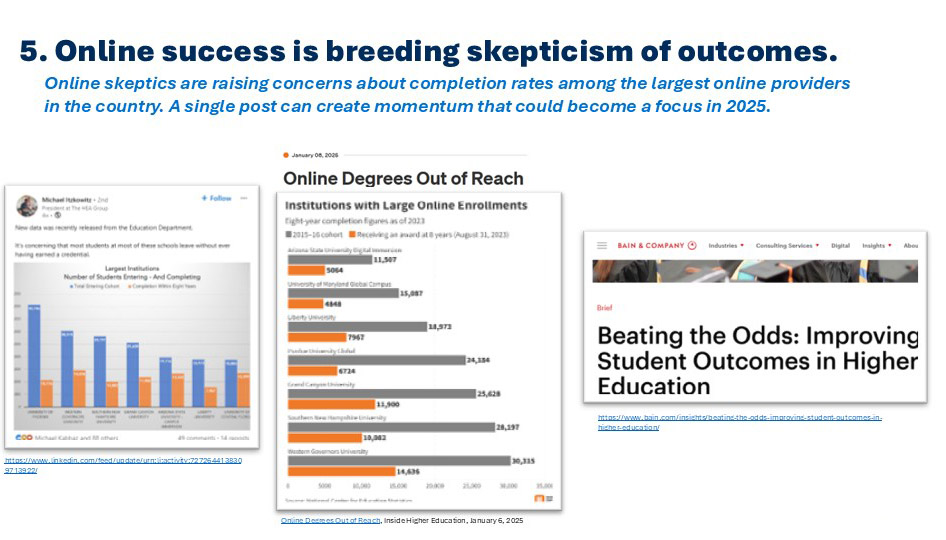
    We all know something of the power of social media today. This was reinforced for me recently by an Inside Higher Education story which focused on the 8-year rates of degree completion among the biggest online providers. The story was triggered by a widely read Linked IN post and followed up by numerous other stories and posts and comments across the platform. This is just the kind of exposure that is most likely to generate real scrutiny of the outcomes of online learning – which were already taking shape over the last year or more. In fact, this focus on outcomes ended up as one of the unfulfilled priorities of the Biden Education Department. I have long said that institutions seeking to enter the online space have an opportunity to tackle some of the quality issues that first plagued the for-profits, now challenge the national online non-profits, and will confront others if not addressed soon.

    Images showing online skeptics are raising concerns about completion rates among larger online providers.Images showing online skeptics are raising concerns about completion rates among larger online providers.

    6. Key preferences for online study have been changed by the pandemic.

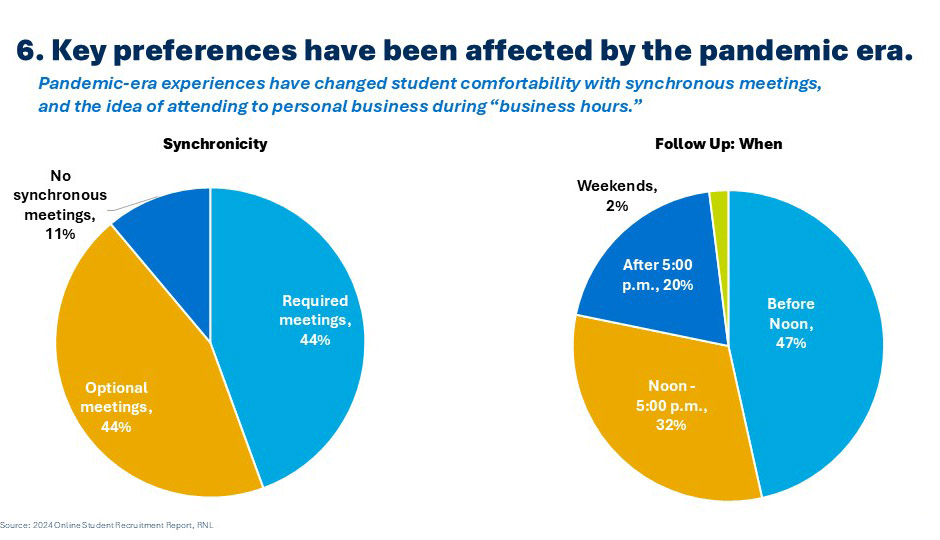
    RNL’s own 2024 online student survey surfaced dozens of important findings that online leaders should consider as they chart their course. Two findings stand out as reflecting profound changes in online student preferences, and both are likely the result of pandemic-era experiences. First, all but 11 percent of online students told us that they are open to at least some synchronous activities in their program, likely the result of hundreds of online meetings during the pandemic. Similarly, they told us that the ideal time to communicate with recruiters/counselors from online programs is now during business hours. This is also likely to be related to the pandemic period, in which millions of people working from home began to regularly contend with some personal business during their day. Institutions should assess both of these factors as they think through student engagement (to address point #5), and the intense competition of the online space (to address point #3).

    Pie charts showing how pandemic experiences have shaped student preferences for synchronous/asynchronous classes and when to follow-upPie charts showing how pandemic experiences have shaped student preferences for synchronous/asynchronous classes and when to follow-up

    7. Contracting institutions are not focusing on online enrollment.

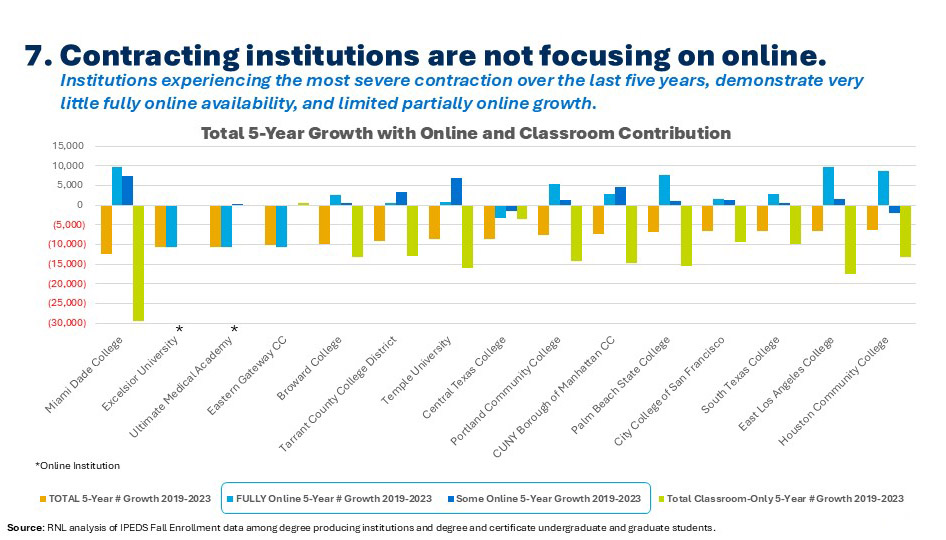
    Finally, we return to the new IPEDS data to see that institutions that have experienced the greatest enrollment contraction over the last five years demonstrate almost no access to fully online study (dark blue lines in the chart below), and only limited access to programs in which students can enroll in both online and classroom courses (light blue lines). Even where there has been some online or partially online growth, these efforts have not been given adequate attention to counterbalance contraction among students enrolled in classroom-only programs (green lines). These data again make it clear (as stated in point #1) that institutions facing classroom-only contraction must either amend their goals to account for reduced enrollment or determine which online or hybrid programs would be most attractive to students in their region and then ensure that such offerings are visible in a highly competitive higher education market.

    Chart showing contracting institutions are not focusing on online.Chart showing contracting institutions are not focusing on online.

    Explore more at our webinar

    Webinar: 5 Enrollment Trends You Need to Know for 2025Webinar: 5 Enrollment Trends You Need to Know for 2025

    Join us for a deeper dive into trends during our webinar, 5 Enrollment Trends You Need to Know for 2025. This discussion with me and a number of my RNL expert colleagues will look at research and trends that should shape strategic and tactical planning over the next 12 months. Particularly, as we enter what has been identified as the first year of the “demographic cliff,” data-informed decision-making will be more important to enrollment health than ever before. Register now.

    Source link