This will be the second part of a series of blogposts about how to use IPEDS, The Integrated Postsecondary Education Data System of the federal government. If you’re just starting, I highly recommend you go to the first post to bring yourself up to speed on the basics. If you don’t, some of this might not make sense.
In that post, I covered several of the ways you can extract simple tables of data for a single year or a single institution; or summary data, including fairly basic and interactive charts when you’re looking for something simple. In this one, I’ll go over how to extract custom data over multiple years, and then walk you through the frustrating process of making sense of the output. Warning: I get a bit cranky about this, because the data formats are largely unchanged since I started doing this perhaps 20 years ago, and they create far more work for the end user than they should.
The last post covered the options in italics. This one will cover the options in bold.
Data Explorer
Publications and Products
Data Trends
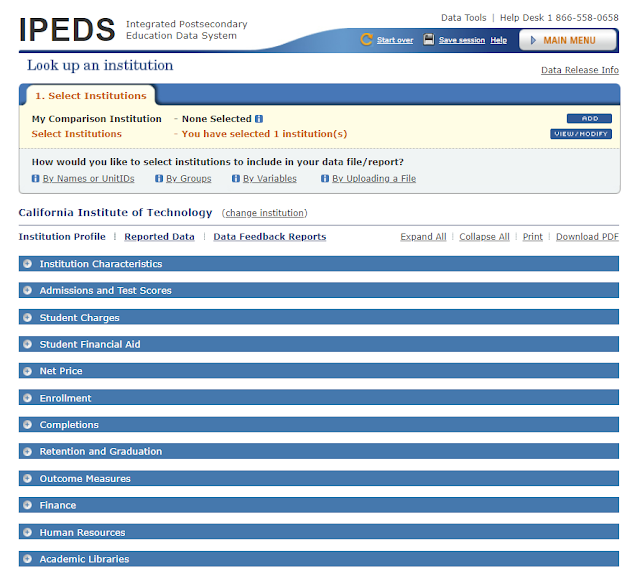
Look Up an Institution
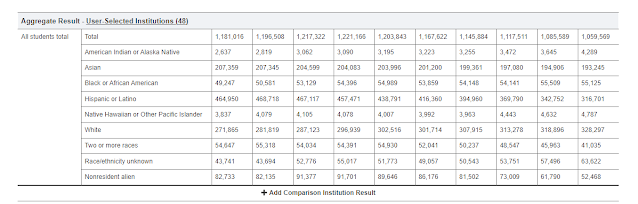
Statistical Tables
Data Feedback Report
Summary Tables
Custom Data Files
Compare Institutions
Complete Data Files
Access Database
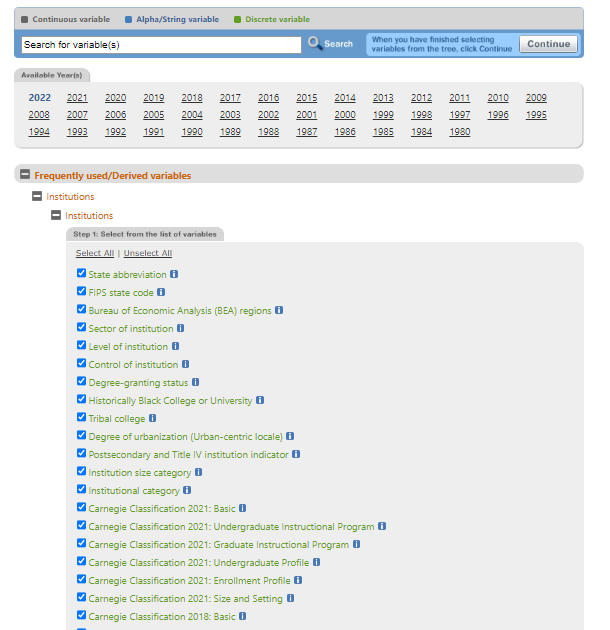
Custom Data files is a fairly easy way to get the data you want for a single year. In this example, I’ve used EZ Group to select all institutions (again, larger selections are better because it’s easy to remove but harder to add), and clicked “Institutions” and then the “Select All” button. It looks like this.
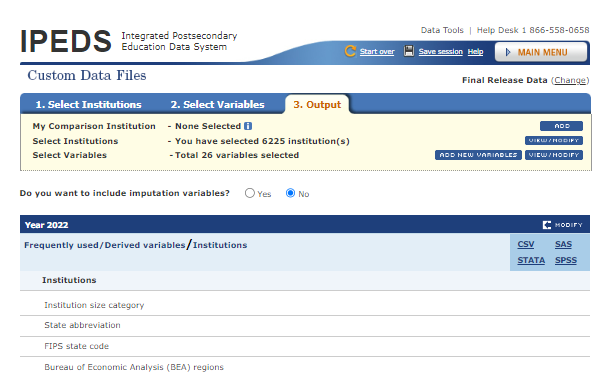
Click the “Continue” tab, and choose “csv” as your download option.
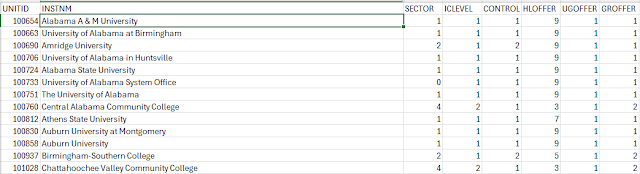
Click on the file that you just downloaded to open it (it should open with Excel), and you’ll see something like this (not all columns are displayed due to space constraints.)
If you want to do this for multiple years, you can go back, change the year, and repeat the download and then stack the files. The real advantage of this approach is that the data in the columns come in as labels: That is, the size categories are listed as “Under 1,000” or “5,000-9,999” for instance. That means, especially with large files, you don’t have to translate codes, where “Under 1,000” is listed as 1, and “1,000 to 5,000” is listed as 2, etc. This keeps you from doing multiple LOOKUP functions in Excel that are a part of other formats.
If you are going to do a lot of work in IPEDS, I highly recommend you use this method to create one giant file of institutional characteristics to import into an Access Database, and use it to merge that with data from statistical downloads (like endowments, admissions, financial aid, etc.) There are a couple of reasons for this: It’s too easy to overlook or skip a variable you want to include in your subsequent downloads, but more important, IPEDS only allows 250 variables in a single file, so this can save you 70 or 100 or 150 spots in the future.
You’ll notice that there are also options to download this data in STATA, SPSS, or SAS, which are statistical programs. Those require downloading a csv file, a script for the software, and then editing the script to point to your file, running it and saving the output. With the Custom Data Files option, that’s a bit superfluous.
Despite the confusion and difficult work arounds that are native to the Compare Institutions option, it’s the one I use most often. Warning: This is not for people who do not have
Sitzfleisch. Even the best data cleaning tools are stymied by some of the quirks in IPEDS.
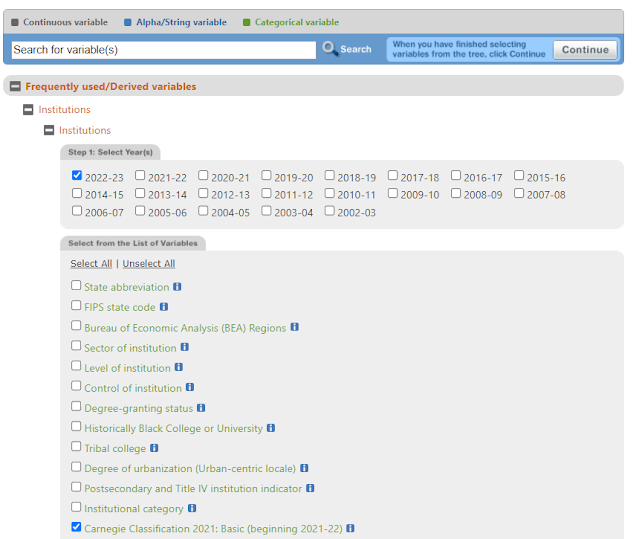
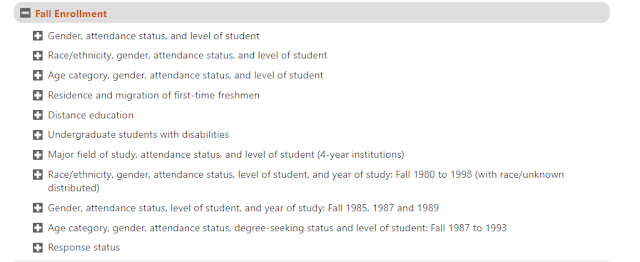
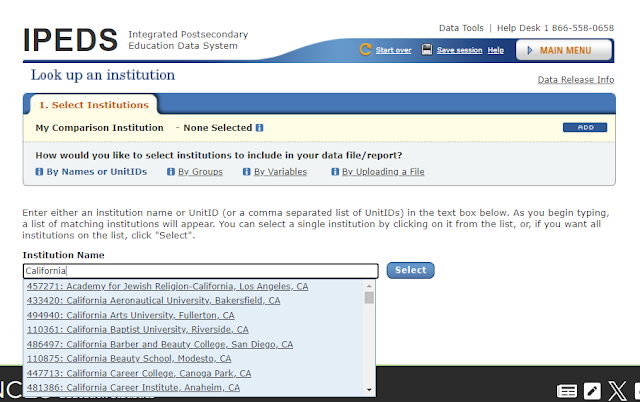
So let’s go back to our institutional selections, and select all in the IPEDS universe. If you want to start with things like Carnegie Classifications because you ignored my earlier advice, we can do that, and then we’ll look at Fall Enrollment over time. Let’s start with the former. I’d recommend selecting it for one year, unless you want to look at how those classifications have changed over time. We do that like this.
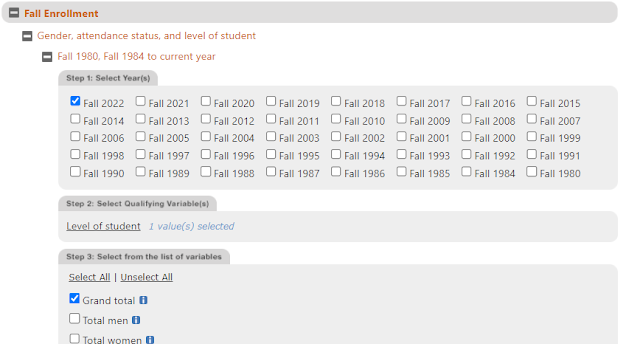
Then (and this is where it gets tricky), we’ll start specifying enrollment variables. Let’s say we want to look at how enrollment has changed over a span of time, so we’ll use Fall, 2022 and Fall, 2012. You have a lot of options, but only these options (IPEDS really should allow you to query the database in the ways you want, but that’s another story.)
Let’s do the first option: By Gender, Status, and level. We’ll have the chance to look at men and women (IPEDS has reported gender as binary as its policy, not mine), full- or part-time, status, and graduate or undergraduate level.
Here’s how that selection is done.
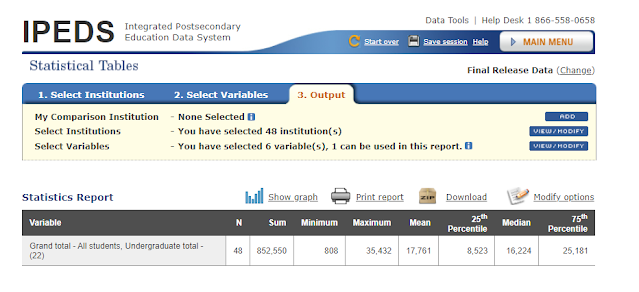
When you approve that, this is what you see. Note that this selection creates 17 variables in your data output: One for the Carnegie Classification, and 16 for the enrollment data. If you added another year, you’d add eight more, and so on. If you got more granular on the enrollment data, it would increase those counts as well.
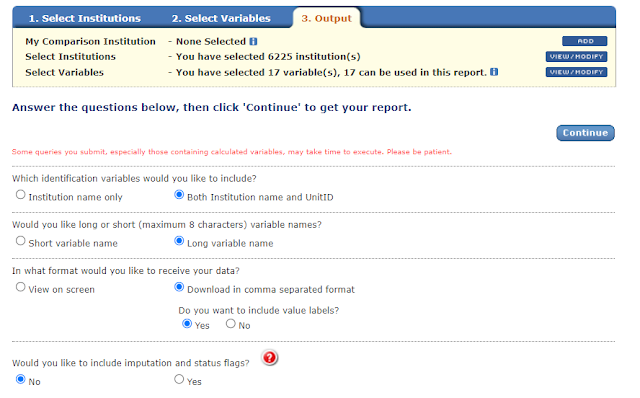
Approve the selections (these are the ones I use, but you can change them. I highly recommend including UnitID unless you’re doing a short, quick analysis).
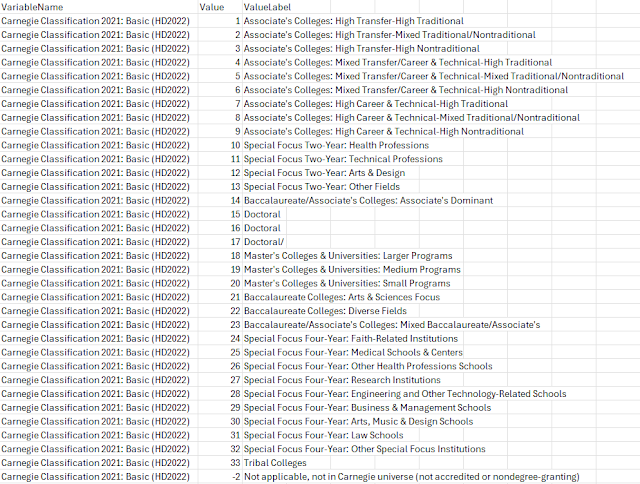
You will get a ZIP file, with the raw data and the value labels. In this case, the only values that need to be translated into labels are the Carnegie Classifications. That translator table looks like this. If you are proficient in Excel, it’s not hard to use a VLOOKUP or XLOOKUP function to translate those values into labels, but it’s still, IMHO, a quirk leftover from days when it made sense to keep file size as small as possible.
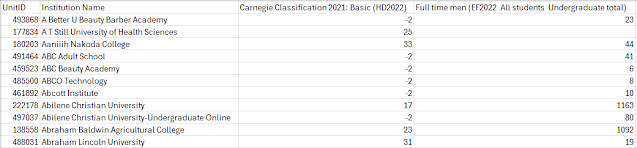
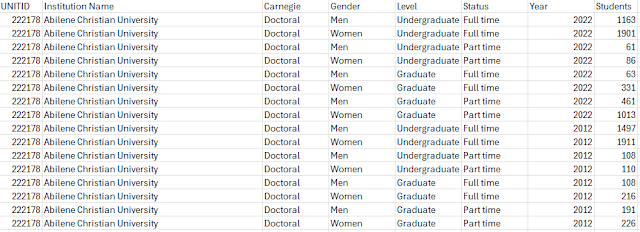
The actual data file looks like this, and it’s probably the thing that makes a lot of people decide to never do IPEDS again. The first column contains the ID number, the second contains the name, the third contains the numeric value of the Carnegie classification, and the fourth? Well, the fourth variable is a tricky one, as it’s actually four variables rolled into one: Year, level (in this case undergraduate), gender, and status (in this case, full-time.)
For this to be most useful, the data should look like this, with one row for every discrete combination of characteristics:
And that’s the hard part: I use a Tableau Data Restructuring Tool, Excel tools like Flash Fill (if you don’t know it, you have to check it out), Excel Add-ins, Kutools for Excel, EasyMorph and Able Bits. I’ve used Tableau Prep, but frankly find it confusing and often frustrating.
Getting your data into this format not only makes it easier to visualize in Tableau, but it also helps you create better pivot tables for the spreadsheet lovers in your office.
There are two other options in IPEDS, the Access Database and Complete Files.
Complete Files is easy, because you can download with one click the complete survey (admissions, financial aid, degrees awarded, etc.) But again, you get those pesky codes you need to translate, and no translator files or even the ability to translate variable names. It’s a major pain. If you’re going to go this route, I’d recommend the SPSS, STATA, or SAS options, where the script will translate and output the file for you. Another (IMHO) unnecessary step. IPEDS could make this much easier.
And, to top it off, if you download the enrollment file, for instance, the values are not discreet. You’ll have one column for total, which is the sum of men and women separately. That same total will roll up full- and part-time. It will roll up grads and undergrads. You have to be very careful to break them apart and not double count everything.
Finally, I’ve tried and failed several times to make sense of the full Access Data Base option. It’s huge, it’s clunky, it’s in code, and it duplicates values: In short, it’s the worst of all available options, in a harder-to-use format. Enter at your own risk.
I hope these two posts have been helpful to you as you think about navigating IPEDS. And I hope someone at IPEDS reads this and realizes how much modernization could be brought to these important data.


