by Ariel Gilreath, The Hechinger Report
January 13, 2026
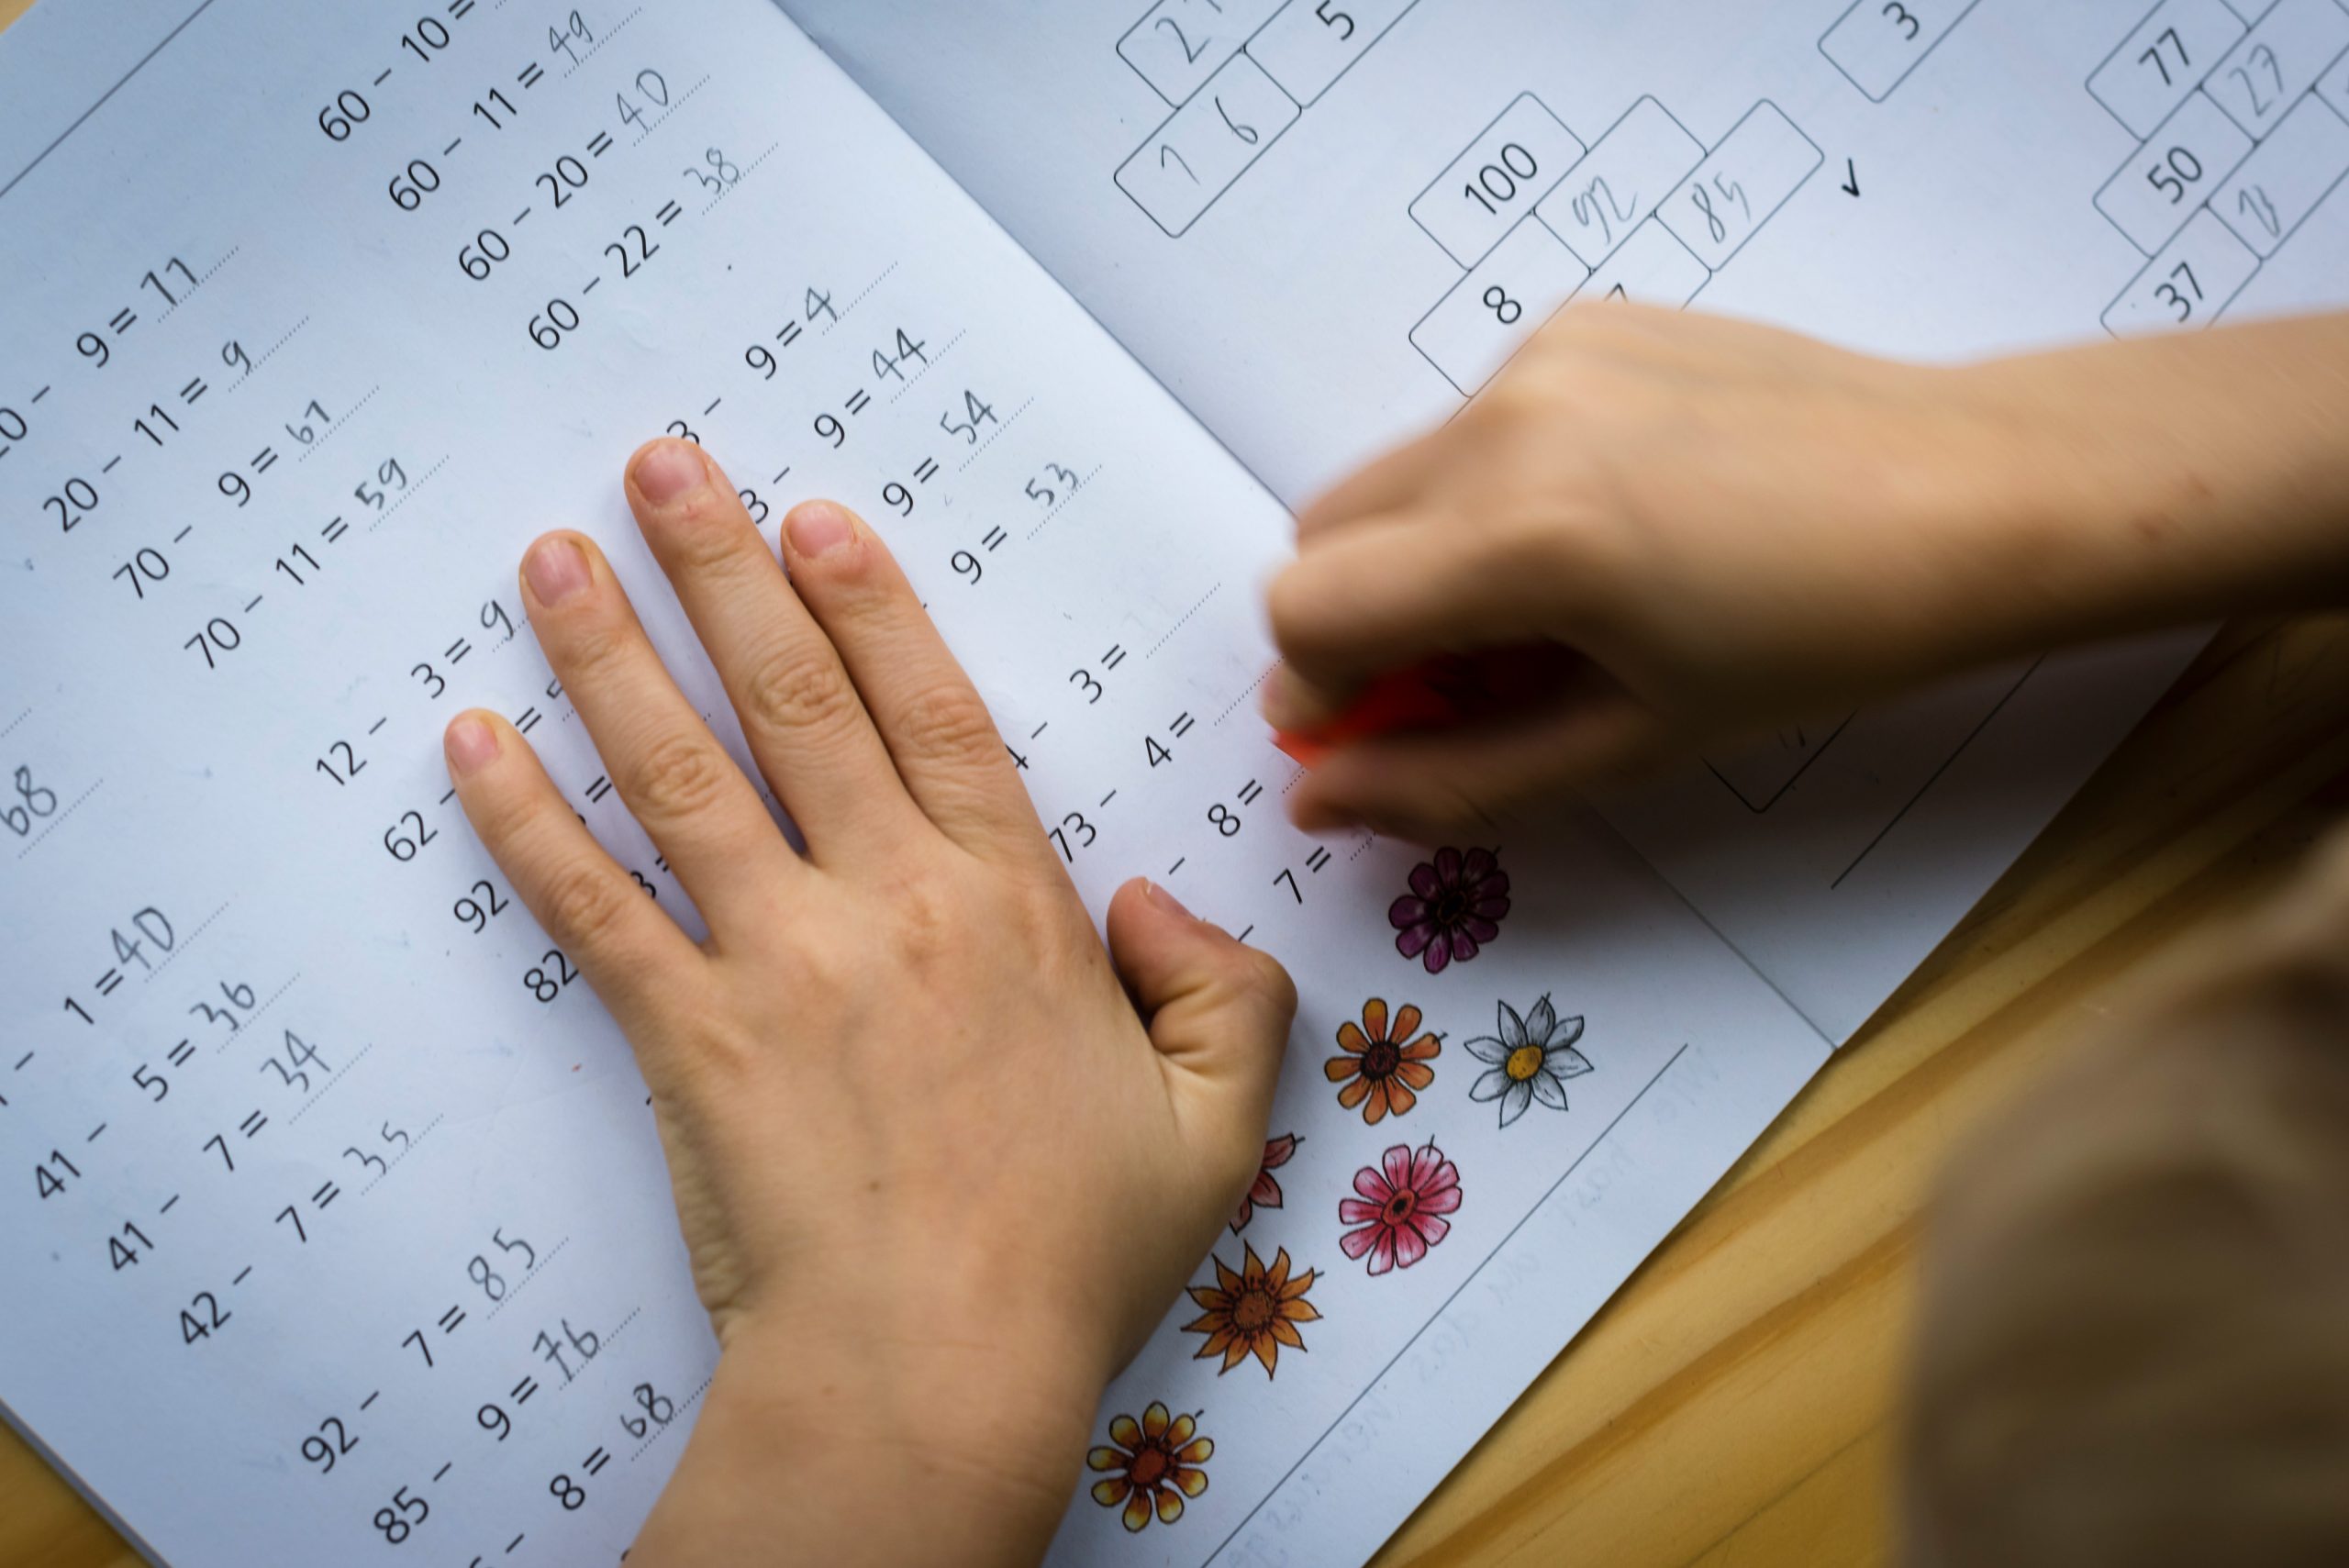
BATON ROUGE, La. — About two dozen second graders sat on the carpet at the front of Jacquelyn Anthony’s classroom, reviewing how to make tens. “Two needs eight!” the students yelled out together. “Six needs four!”
“The numbers may get a little trickier,” Anthony told them next. “But remember, the numbers we need to make 10 are still there.” The students then turned confidently to bigger calculations: Forty-six needs four ones to make a new number divisible by 10; 128 needs two to make 13 tens.
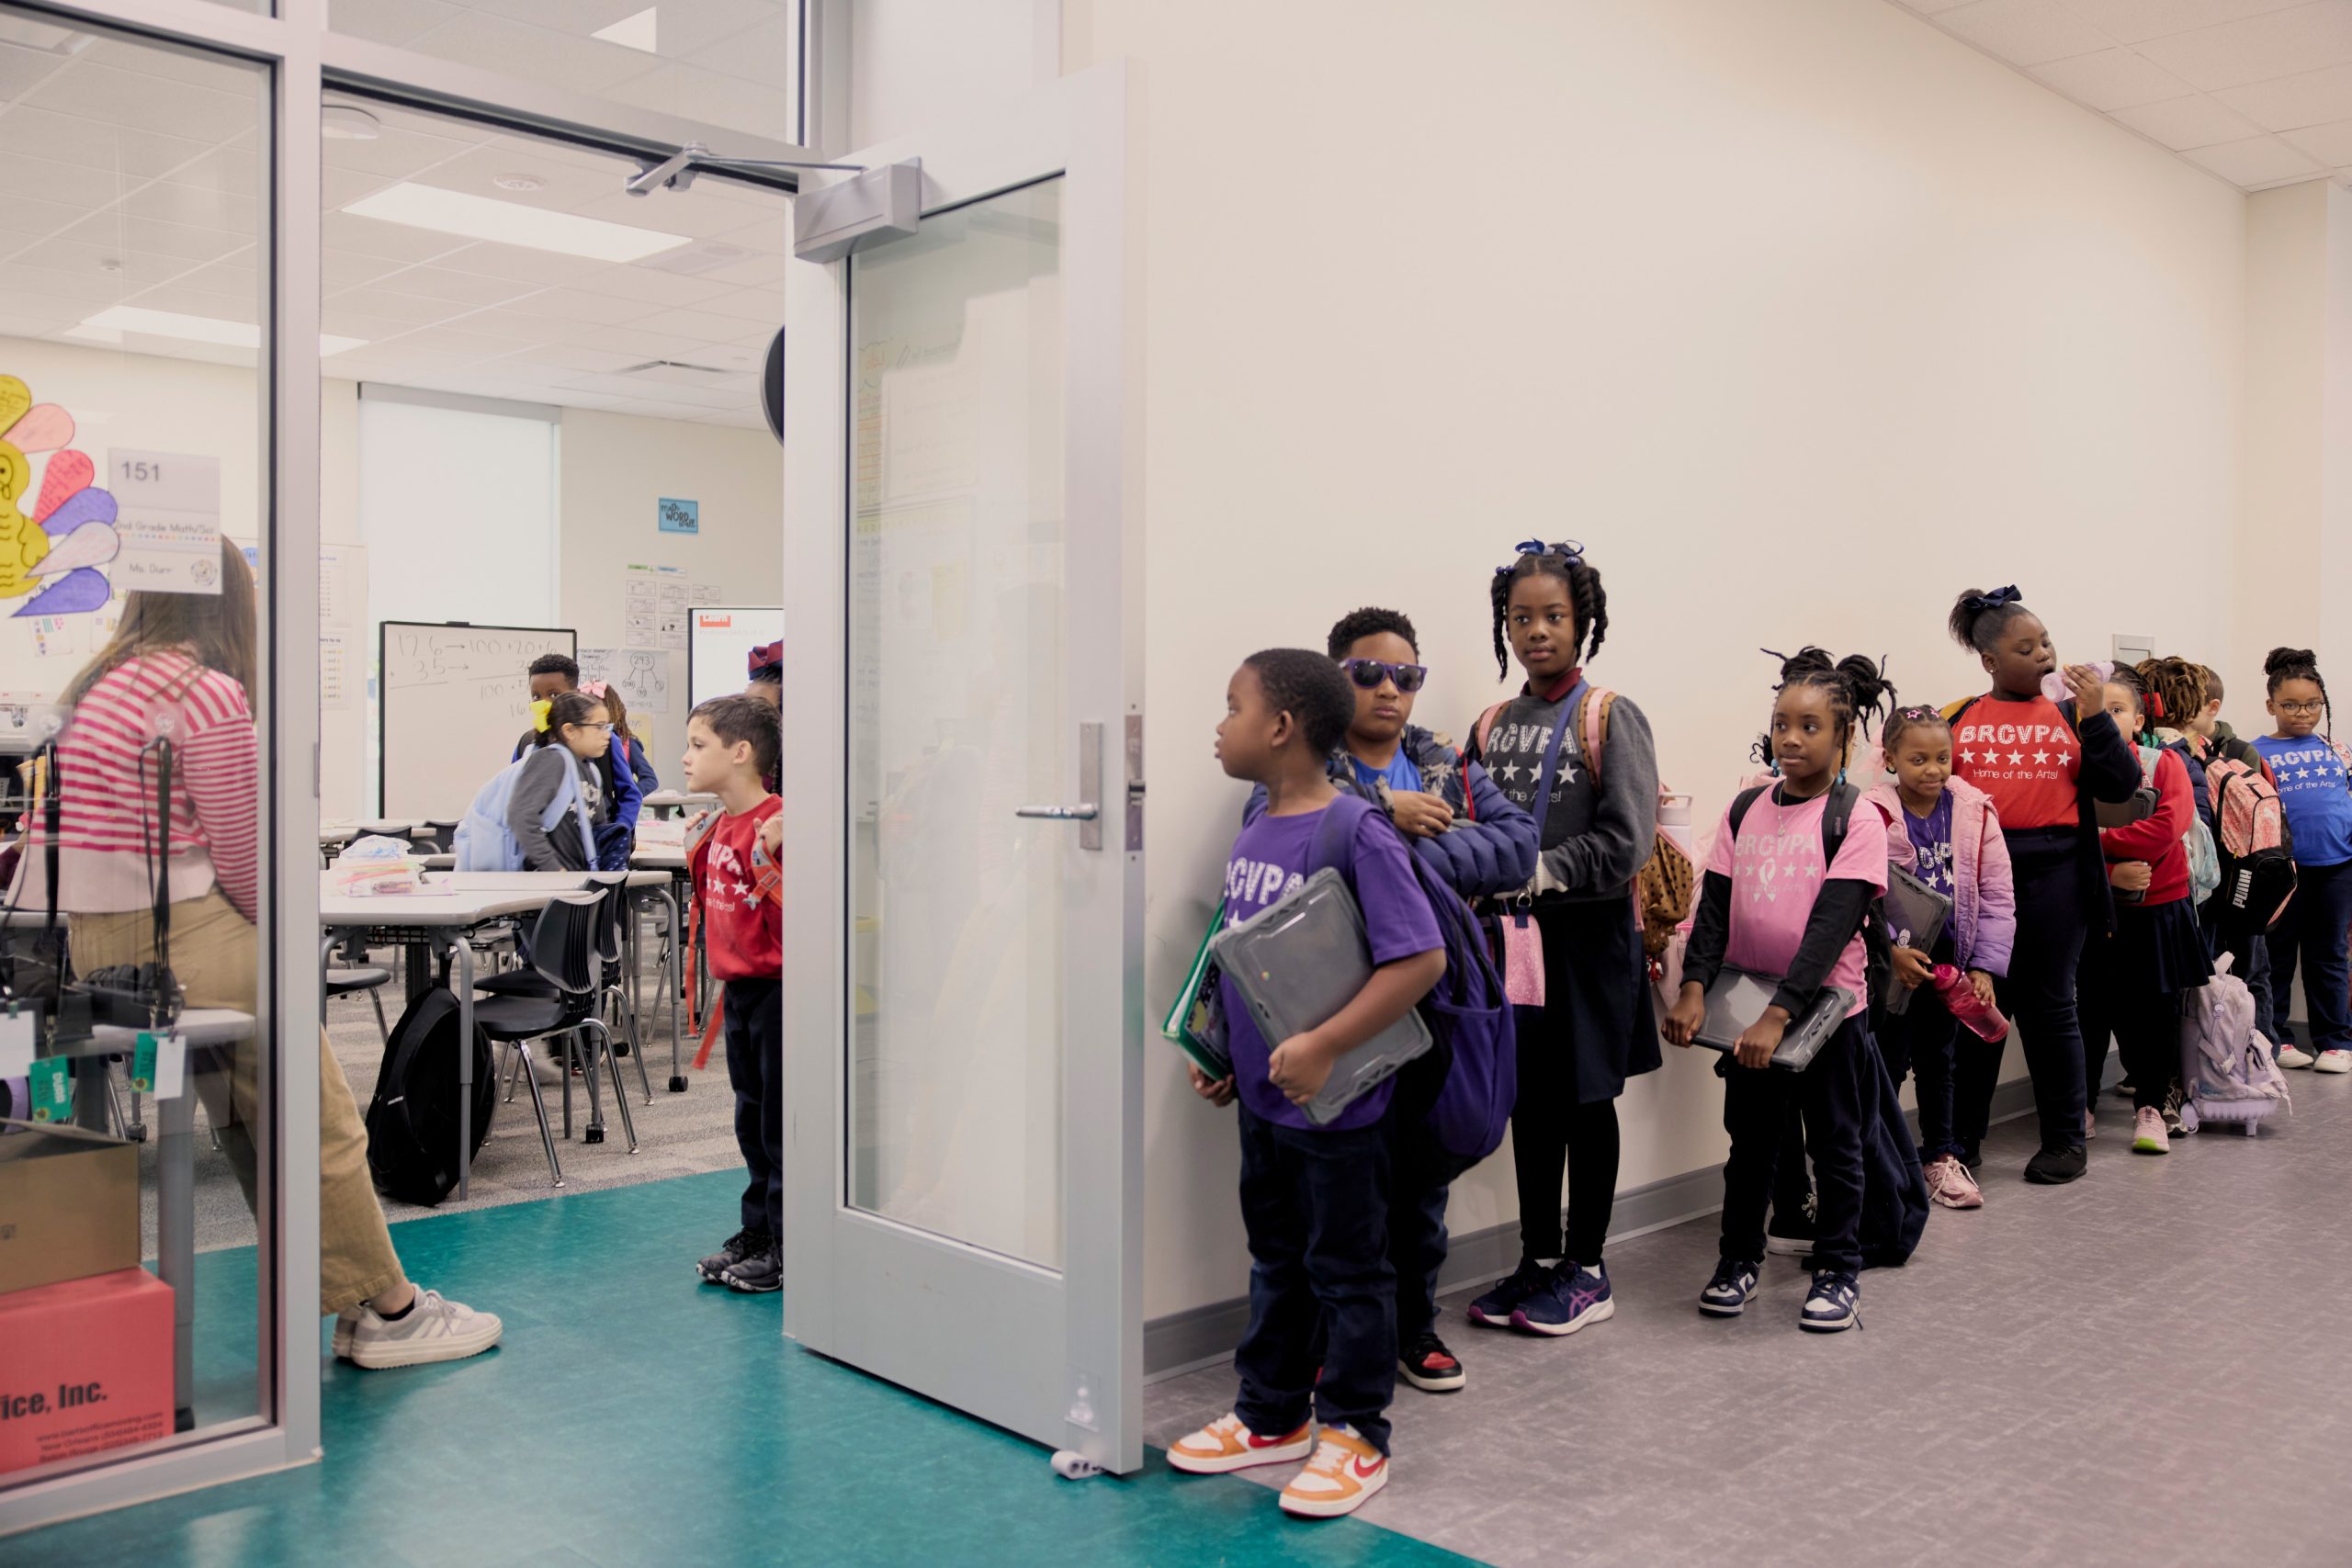
At the end of the hour, the second graders slung on their backpacks, gathered their Chromebooks and lined up at the door before heading to English and social studies class across the hall. While most schools wait until middle school to transition students from one class to another, kids at Louisiana’s Baton Rouge Center for Visual and Performing Arts do so starting at age 6 or 7. It’s part of a strategy known as departmentalizing, or platooning.
Anthony, rather than teaching all four core subjects, specializes in math. The school’s new facility, built in 2025, was designed with departmentalizing in mind: The classrooms have huge glass windows, so teachers can see their next class preparing to line up in the hallway.
“Teaching today is so different than it was a long time ago, and there are so many demands on them. And the demand to be an expert in your content area is very high,” said Sydney Hebert, magnet site coordinator for the art-focused public school in the East Baton Rouge Parish school district. “We want to make sure that our teachers are experts in what they’re teaching so that they can do a good job of teaching it to the kids.”
As schools contend with a decades-long slump in math scores — exacerbated by the pandemic — some are turning to this classroom strategy even for very young students. In recent years, more elementary schools have opted to departmentalize some grade levels in an attempt to boost academic achievement. The share of fourth and fifth grade classrooms operating on this schedule has doubled since the year 2000, from 15 percent to 30 percent in 2021. Often, that means educators will specialize in one or two subjects at most, such as fourth grade English language arts and social studies, or fifth grade math and science. The theory is that teachers who specialize will be more familiar with the content and better able to teach it.
That may be particularly important for math: Studies have shown that some early elementary school teachers experience anxiety about the subject and question their ability to teach it. Educators also say that the curriculum and standards for math and English in the early grades are changing rapidly in some districts and have become more complicated over time. In a departmentalized setup, it’s also far less likely that math instruction will get shortchanged by an educator who prefers spending time on other subjects.
Related: A lot goes on in classrooms from kindergarten to high school. Keep up with our free weekly newsletter on K-12 education.
But while some schools swear by this model, the research on it is mixed.
One prominent 2018 study on the practice in Houston public schools found it had a negative effect on test scores, behavior and attendance. The study doesn’t explain why that was the case, but the researcher said it could be because teachers on this schedule spend less time with individual students.
Another study published in 2024 analyzing Massachusetts schools had different outcomes: Researchers found moderate gains in academic achievement for ELA and a significant boost to science scores for students in departmentalized classes. The results in math, however, showed few gains.
Generally, teachers specialize in the subject they are most comfortable teaching. When a school departmentalizes for the first time, principals typically look at each educator’s test score data over time to determine whether they should specialize in math or reading.
“There are some arguments that, at least if it’s someone who likes the subject, who is passionate about the subject, you have a greater chance of them doing a better job of delivering instruction,” said Latrenda Knighten, president of the National Council of Teachers of Mathematics. “But you’ll find mixed reviews.”
Yet there are a few reasons why the strategy is typically reserved for students in older grades, according to school leaders: Spending all day with one teacher increases the bond between the teacher and student, which is important for younger children. In Baton Rouge, Anthony teaches 50 students throughout the day instead of the same 25 students all day.
“Teachers want to get to know their students,” said Dennis Willingham, superintendent of Walker County Schools in Alabama. The district departmentalized some fifth grade classrooms decades ago, but recently added third and fourth grade classes on this schedule. “You tend to see less departmentalization below third grade because of the nurturing element.”
It’s also generally more challenging for young students to quickly change classrooms, even for electives, which means lost instructional time. Smaller elementary schools may also struggle to hire enough teachers to schedule all of them on a departmentalized setup.
Related: These school districts are bucking the national math slump
But increasingly, schools that are satisfied with this approach for older grade levels are trying it out with their younger grades, too.
After the pandemic, the San Tan Heights Elementary School in Arizona changed its curriculum to one that was more rigorous, and it became harder for the third grade educators to master the standards of all four subject areas, said Henry Saylor-Scheetz, principal at the time.
He proposed that third graders be taught by separate math, English language arts and reading teachers. “I told them, let’s try it for a semester. If it doesn’t work at the end of the year, we’ll go back,” Saylor-Scheetz said.
Ten days into the experiment, teachers told him they never wanted to return to the old schedule. In the subsequent years, the school added more classrooms on this model until, by 2023, all K-8 students were departmentalized. For the last few years, teacher retention at the school was 95 percent, according to Saylor-Scheetz.
Saylor-Scheetz, who last year became principal of a nearby middle school, credited the change for helping the school improve from a C rating on its state report card — a rating it had stagnated at every year since 2018 — to a B rating as of 2022. Since then, more schools in his Arizona school district have shifted to this schedule.
“I’d love to see this become something we do as a nation, but it is a paradigm shift,” Saylor-Scheetz said. “There’s merit in doing it, but there has to be a commitment to it.”
At Baton Rouge Center for Visual and Performing Arts, students in first through third grades have two partner teachers, one for math and science and another for ELA and social studies. The school has been operating on this schedule for third through fifth grade students for more than a decade. Eight years ago, its leaders decided to try it for first and second grade students, too, and were pleased with the results.
On a December morning at the school, young students talked quietly with each other in the hall as they lined up to go from math class to English language arts. All told, the switch took less than five minutes. “We’re at the end of the second nine weeks, so we’ve had a lot of practice,” said GiGi Boudreaux, the assistant principal.
The strategy has not always been successful, though.
During the pandemic, administrators also attempted to departmentalize its kindergarten classes. It didn’t work as they’d hoped: It was a challenge to get the 5-year-olds to quickly change classes and focus on classwork again once they did. Parents also didn’t like it. The school then tried moving teachers from classroom to classroom instead of moving students, but the educators hated it.
“It was too much, so we didn’t do it after that,” said Hebert.
The Baton Rouge school doesn’t have comparison data to show that students perform better in a departmentalized setup, but most educators in the school prefer it, Hebert said. Third grade test scores from 2015 — before the school departmentalized its younger grade levels — showed 73 percent scored “advanced” and “mastery” level on the state ELA test, and 56 percent scored advanced or mastery on the math test. In 2025, 80 percent of third grade students scored advanced or mastery in ELA and 55 percent in math.
“I know that the teachers like it better, and the kids have adapted to it,” Hebert said.
Teachers meet weekly with their partner teachers and grade-level counterparts to discuss their classes and progress on the state standards. Once a quarter, all of the math teachers across the grades meet to talk about strategies and student performance.
Related: Teachers conquering their math anxiety
At Deer Valley Unified School District in Arizona, departmentalizing some classrooms has helped reduce teacher turnover, said Superintendent Curtis Finch, particularly for early career educators, who can find it challenging to master the content and standards of all four subjects.
“If you’re not confident in your subject, then you don’t have good examples off the top of your head. You can’t control the room, can’t pull the students in,” Finch said.
There are drawbacks though, Finch acknowledged. In a self-contained classroom, teachers can more easily integrate their different lessons, so that a math lesson might refer back to a topic covered in reading.
And even though Anthony, the second grade math and science teacher in Baton Rouge, loves teaching math, she also misses the extra time she could spend with each student when she had the same 25 children in her class all day for the entire school year.
“It was a joy for me to be self-contained and to build that little family,” Anthony said. “I think the social emotional needs of students are best met in that type of environment. But being solely a math teacher, I do get to just dig in and focus on the nuance of the content.”
For Anthony’s partner teacher across the hall, Holley McArthur, teaching 50 students ELA and social studies is easier than having to teach 25 students math.
“This is my thing: reading books, comprehending and finding answers, meeting their goals,” said McArthur, who has taught in both kinds of classrooms over three decades in education.
While McArthur’s kids were at recess this mid-December day, the veteran teacher was grading their reading worksheets. A new student had transferred in from out of state midyear, and she was still evaluating his reading skills.
“I think you still get to know the kids, even if you just have them for three hours a day, because I’m not doing the hard math with them.”
Contact staff writer Ariel Gilreath on Signal at arielgilreath.46 or at [email protected].
This story about departmentalizing was produced by The Hechinger Report, a nonprofit, independent news organization focused on inequality and innovation in education. Sign up for the Hechinger newsletter.
This <a target=”_blank” href=”https://hechingerreport.org/the-schools-where-even-young-children-change-classes/”>article</a> first appeared on <a target=”_blank” href=”https://hechingerreport.org”>The Hechinger Report</a> and is republished here under a <a target=”_blank” href=”https://creativecommons.org/licenses/by-nc-nd/4.0/”>Creative Commons Attribution-NonCommercial-NoDerivatives 4.0 International License</a>.<img src=”https://i0.wp.com/hechingerreport.org/wp-content/uploads/2018/06/cropped-favicon.jpg?fit=150%2C150&ssl=1″ style=”width:1em;height:1em;margin-left:10px;”>
<img id=”republication-tracker-tool-source” src=”https://hechingerreport.org/?republication-pixel=true&post=114257&ga4=G-03KPHXDF3H” style=”width:1px;height:1px;”><script> PARSELY = { autotrack: false, onload: function() { PARSELY.beacon.trackPageView({ url: “https://hechingerreport.org/the-schools-where-even-young-children-change-classes/”, urlref: window.location.href }); } } </script> <script id=”parsely-cfg” src=”//cdn.parsely.com/keys/hechingerreport.org/p.js”></script>