Tag: Outcomes

  • What might lower response rates mean for Graduate Outcomes data?

    What might lower response rates mean for Graduate Outcomes data?

    The key goal of any administered national survey is for it to be representative.

    That is, the objective is to gather data from a section of the population of interest in a country (a sample), which then enables the production of statistics that accurately reflect the picture among that population. If this is not the case, the statistic from the sample is said to be inaccurate or biased.

    A consistent pattern that has emerged both nationally and internationally in recent decades has been the declining levels of participation in surveys. In the UK, this trend has become particularly evident since the Covid-19 pandemic, leading to concerns regarding the accuracy of statistics reported from a sample.

    A survey

    Much of the focus in the media has been on the falling response rates to the Labour Force Survey and the consequences of this on the ability to publish key economic statistics (hence their temporary suspension). Furthermore, as the recent Office for Statistics Regulation report on the UK statistical system has illustrated, many of our national surveys are experiencing similar issues in relation to response rates.

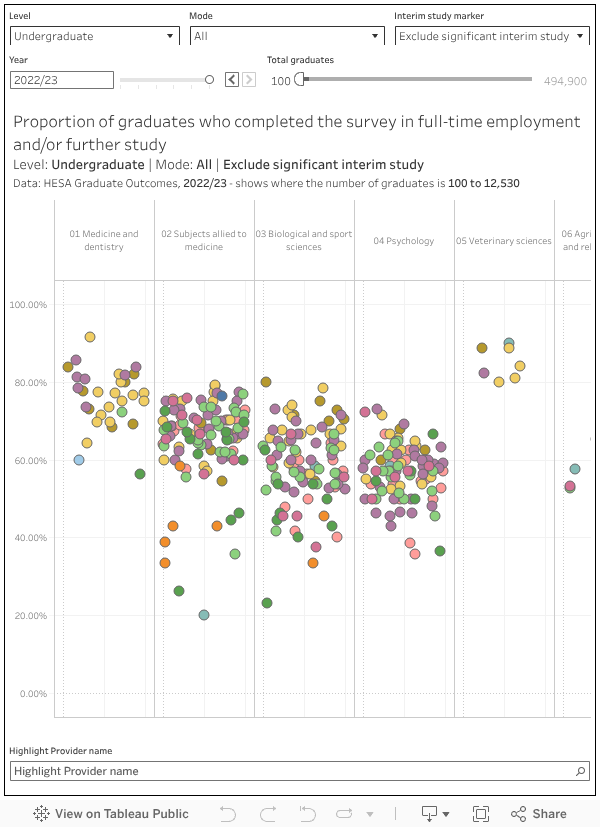
    Relative to other collections, the Graduate Outcomes survey continues to achieve a high response rate. Among the UK-domiciled population, the response rate was 47 per cent for the 2022-23 cohort (once partial responses are excluded). However, this is six percentage points lower than what we saw in 2018-19.

    We recognise the importance to our users of being able to produce statistics at sub-group level and thus the need for high response rates. For example, the data may be used to support equality of opportunity monitoring, regulatory work and understand course outcomes to inform student choice.

    So, HESA has been exploring ways in which we can improve response rates, such as through strategies to boost online engagement and offering guidance on how the sector can support us in meeting this aim by, for example, outlining best practice in relation to maintaining contact details for graduates.

    We also need, on behalf of everyone who uses Graduate Outcomes data, to think about the potential impact of an ongoing pattern of declining response rates on the accuracy of key survey statistics.

    Setting the context

    To understand why we might see inaccurate estimates in Graduate Outcomes, it’s helpful to take a broader view of survey collection processes.

    It will often be the case that a small proportion of the population will be selected to take part in a survey. For instance, in the Labour Force Survey, the inclusion of residents north of the Caledonian Canal in the sample to be surveyed is based on a telephone directory. This means, of course, that those not in the directory will not form part of the sample. If these individuals have very different labour market outcomes to those that do sit in the directory, their exclusion could mean that estimates from the sample do not accurately reflect the wider population. They would therefore be inaccurate or biased. However, this cause of bias cannot arise in Graduate Outcomes, which is sent to nearly all those who qualify in a particular year.

    Where the Labour Force Survey and Graduate Outcomes are similar is that submitting answers to the questionnaire is optional. So, if the activities in the labour market of those who do choose to take part are distinct from those who do not respond, there is again a risk of the final survey estimates not accurately representing the situation within the wider population.

    Simply increasing response rates will not necessarily reduce the extent of inaccuracy or bias that emerges. For instance, a survey could achieve a response rate of 80 per cent, but if it does not capture any unemployed individuals (even when it is well known that there are unemployed people in the population), the labour market statistics will be less representative than a sample based on a 40 per cent response rate that captures those in and out of work. Indeed, the academic literature also highlights that there is no clear association between response rates and bias.

    It was the potential for bias to arise from non-response that prompted us to commission the Institute for Social and Economic Research back in 2021 to examine whether weighting needed to be applied. Their approach to this was as follows. Firstly, it was recognised that for any given cohort, it is possible that the final sample composition could have been different had the survey been run again (holding all else fixed). The sole cause of this would be a change in the group of graduates who choose not to respond. As Graduate Outcomes invites almost all qualifiers to participate, this variation cannot be due to the sample randomly chosen to be surveyed being different from the outset if the process were to be repeated – as might be the case in other survey collections.

    The consequence of this is that we need to be aware that a repetition of the collection process for any given cohort could lead to different statistics being generated. Prior to weighting, the researchers therefore created intervals – including at provider level – for the key survey estimate (the proportion in highly skilled employment and/or further study) which were highly likely to contain the true (but unknown) value among the wider population. They then evaluated whether weighted estimates sat within these intervals and concluded that if they did, there was zero bias. Indeed, this was what they found in the majority of cases, leading to them stating that there was no evidence of substantial non-response bias in Graduate Outcomes.

    What would be the impact of lower response rates on statistics from Graduate Outcomes?

    We are not the only agency running a survey that has examined this question. Other organisations administering surveys have also explored this matter too. For instance, the Scottish Crime and Justice Survey (SCJS) has historically had a target response rate of 68 per cent (in Graduate Outcomes, our target has been to reach a response rate of 60 per cent for UK-domiciled individuals). In SCJS, this goal was never achieved, leading to a piece of research being conducted to explore what would happen if lower response rates were accepted.

    SCJS relies on face-to-face interviews, with a certain fraction of the non-responding sample being reissued to different interviewers in the latter stages of the collection process to boost response rates. For their analysis, they looked at how estimates would change had they not reissued the survey (which tended to increase response rates by around 8-9 percentage points). They found that choosing not to reissue the survey would not make any material difference to key survey statistics.

    Graduate Outcomes data is collected across four waves from December to November, with each collection period covering approximately 90 days. During this time, individuals have the option to respond either online or by telephone. Using the 2022-23 collection, we generated samples that would lead to response rates of 45 per cent, 40 per cent and 35 per cent among the UK-domiciled population by assuming the survey period was shorter than 90 days. Similar to the methodology for SCJS therefore, we looked at what would have happened to our estimates had we altered the later stages of the collection process.

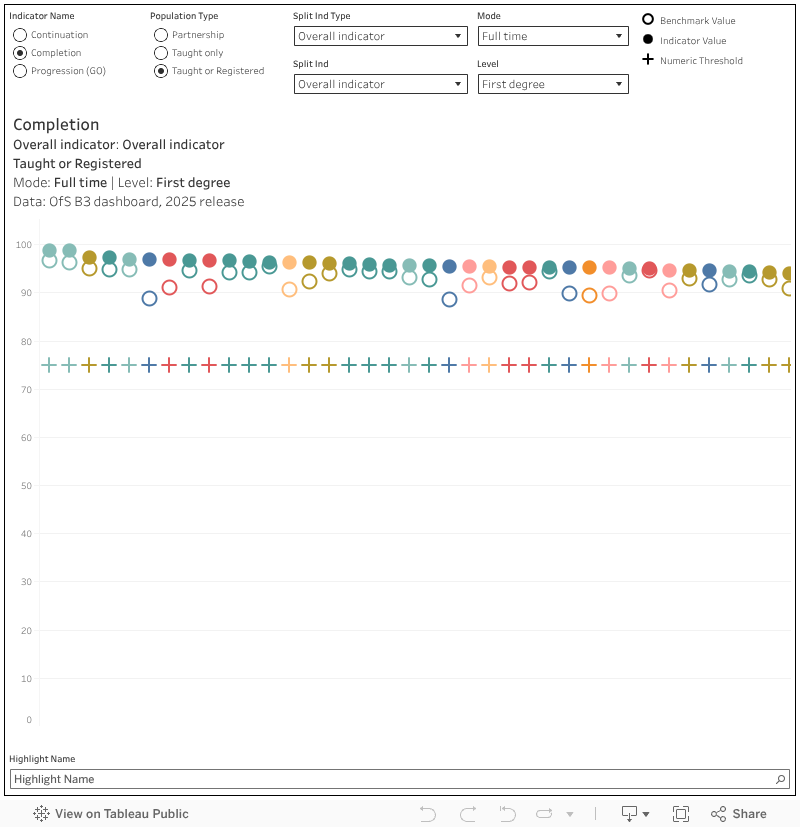
    From this point, our methodology was similar to that deployed by the Institute for Social and Economic Research. For the full sample we achieved (i.e. based on response rate of 47 per cent), we began by generating intervals at provider level for the proportion in highly skilled employment and/or further study. We then examined whether the statistic observed at a response rate of 45 per cent, 40 per cent and 35 per cent sat within this interval. If it did, our conclusion was there was no material difference in the estimates.

    Among the 271 providers in our dataset, we found that, at a 45 per cent response rate, only one provider had an estimate that fell outside the intervals created based on the full sample. This figure rose to 10 (encompassing 4 per cent of providers) at a 40 per cent response rate and 25 (representing 9 per cent of providers) at a 35 per cent response rate, though there was no particular pattern to the types of providers that emerged (aside from them generally being large establishments).

    What does this mean for Graduate Outcomes users?

    Those who work with Graduate Outcomes data need to understand the potential impact of a continuing trend of lower response rates. While users can be assured that the survey team at HESA are still working hard to achieve high response rates, the key-take away message from our study is that a lower response rate to the Graduate Outcomes survey is unlikely to lead to a material change in the estimates for the proportion in highly skilled employment and/or further study among the bulk of providers.

    The full insight and associated charts can be viewed on the HESA website:
    What impact might lower response rates have had on the latest Graduate Outcomes statistics?

    Read HESA’s latest research releases. If you would like to be kept updated on future publications, please sign-up to our mailing list.

    Source link

  • College Gives a Positive ROI for Some, but Outcomes Vary

    College Gives a Positive ROI for Some, but Outcomes Vary

    Chaichan Pramjit/iStock/Getty Images Plus

    Seventy percent of the country’s college graduates see their investment pay off within 10 years, but that outcome correlates strongly to the state where a student obtains their degree, according to the Strada Foundation’s latest State Opportunity Index.

    The report, released Thursday, shows that states such as California and Delaware surpass the average at 76 percent and 75 percent, respectively, while North Dakota, for example, falls significantly short at 53 percent.

    Across the board, the nation still has a ways to go before it can ensure all graduates see a positive return on investment, according to the report.

    “Too many learners invest substantial time and money without achieving strong career and earnings outcomes,” it says. “Meanwhile, many employers struggle to find the skilled talent they need to fill high-wage jobs.”

    Strada hopes that the index and the five categories it highlights—outcomes, coaching, affordability, work-based learning and employer alignment—will provide a framework for policymakers to “strengthen the link between education and opportunity.”

    “The State Opportunity Index reinforces our belief at Strada Education Foundation that we as a nation can’t just focus on college access and completion and assume that a college degree will consistently deliver for all on the promise of postsecondary education as a pathway to opportunity,” Strada president Stephen Moret said in a news release. “We must look at success beyond completion, with a sharper focus on helping people land jobs that pay well and offer growth opportunities.”

    Source link

  • Dual Enrollment and AP Courses Yield Positive Outcomes

    Dual Enrollment and AP Courses Yield Positive Outcomes

    A recent report from the Community College Research Center at Columbia University’s Teachers College found that high school students graduate college at higher rates and earn more after college if they’ve taken a combination of dual-enrollment and Advanced Placement courses.

    The report, released Tuesday, drew on administrative data from Texas on students expected to graduate high school in 2015–16 and 2016–17, as well as some data from students expected to complete in 2019–20 and 2022–23. It explored how different kinds of accelerated coursework, and different combinations of such work, affected student outcomes.

    Researchers found that students who combined Advanced Placement or International Baccalaureate courses with dual-enrollment courses boasted higher completion rates and earnings than their peers. Of these students, 92 percent enrolled in or completed a credential a year after high school, and 71 percent earned a credential by year six.

    These students also showed the strongest earnings outcomes in their early 20s. They earned $10,306 per quarter on average at age 24, compared to $9,746 per quarter among students who took only dual enrollment and $8,934 per quarter for students who took only AP/IB courses. However, students taking both dual-enrollment and AP/IB courses tended to be less racially and socioeconomically diverse than students taking AP/IB courses alone, the report found.

    Students who combined dual enrollment with career and technical education—who made up just 5 percent of students in the study—also reaped positive outcomes later in life. These students earned $9,746 per quarter on average by age 24, compared to $8,097 per quarter on average for students with only a CTE focus.

    “Most dual-enrollment students in Texas also take other accelerated courses, and those who do tend to have stronger college and earnings trajectories,” CCRC senior research associate Tatiana Velasco said in a press release. “It’s a pattern we hadn’t fully appreciated before, which offers clues for how to expand the benefits of dual enrollment to more students.”

    Source link

  • Outcomes data for subcontracted provision

    Outcomes data for subcontracted provision

    In 2022–23 there were around 260 full time first degree students, registered to a well-known provider and taught via a subcontractual arrangement, that had a continuation rate of just 9.8 per cent: so of those 260 students, just 25 or so actually continued on to their second year.

    Whatever you think about franchising opening up higher education to new groups, or allowing established universities the flexibility to react to fast-changing demand or skills needs, none of that actually happens if more than 90 per cent of the registered population doesn’t continue with their course.

    It’s because of issues like this that we (and others) have been badgering the Office for Students to produce outcomes data for students taught via subcontractual arrangements (franchises and partnerships) at a level of granularity that shows each individual subcontractual partner.

    And finally, after a small pilot last year, we have the data.

    Regulating subcontractual relationships

    If anything it feels a little late – there are now two overlapping proposals on the table to regulate this end of the higher education marketplace:

    • A Department of Education consultation suggests that every delivery partner that has more than 300 higher education students would need to register with the Office for Students (unless it is regulated elsewhere)
    • And an Office for Students consultation suggests that every registering partner with more than 100 higher education students taught via subcontractual arrangements will be subject to a new condition of registration (E8)

    Both sets of plans address, in their own way, the current reality that the only direct regulatory control available over students studying via these arrangements is via the quality assurance systems within the registering (lead) partners. This is an arrangement left over from previous quality regimes, where the nation spent time and money to assure itself that all providers had robust quality assurance systems that were being routinely followed.

    In an age of dashboard-driven regulation, the fact that we have not been able to easily disaggregate the outcomes of subcontractual students has meant that it has not been possible to regulate this corner of the sector – we’ve seen rapid growth of this kind of provision under the Office for Students’ watch and oversight (to be frank) has just not been up to the job.

    Data considerations

    Incredibly, it wasn’t even the case that the regulator had this data but chose not to publish it. OfS has genuinely had to design this data collection from scratch in order to get reliable information – many institutions expressed concern about the quality of data they might be getting from their academic partners (which should have been a red flag, really).

    So what we get is basically an extension of the B3 dashboards where students in the existing “partnership” population are assigned to one of an astonishing 681 partner providers alongside their lead provider. We’d assume that each of these specific populations has data across the three B3 (continuation, completion, progression) indicators – in practice many of these are suppressed for the usual OfS reasons of low student numbers and (in the case of progression) low Graduate Outcomes response rates.

    Where we do get indicator values we also see benchmarks and the usual numeric thresholds – the former indicating what OfS might expect to see given the student population, the latter being the line beneath which the regulator might feel inclined to get stuck into some regulating.

    One thing we can’t really do with the data – although we wanted to – is treat each subcontractual provider as if it was a main provider and derive an overall indicator for it. Because many subcontractual providers have relationships (and students) from numerous lead providers, we start to get to some reasonably sized institutions. Two – Global Banking School and the Elizabeth School London – appear to have more than 5,000 higher education students: GBS is around the same size as the University of Bradford, the Elizabeth School is comparable to Liverpool Hope University.

    Size and shape

    How big these providers are is a good place to start. We don’t actually get formal student numbers for these places – but we can derive a reasonable approximation from the denominator (population size) for one of the three indicators available. I tend to use continuation as it gives me the most recent (2022–23) year of data.

    [Full screen]

    The charts showing numbers of students are based on the denominators (populations) for one of the three indicators – by default I use continuation as it is more likely to reflect recent (2022–23) numbers. Because both the OfS and DfE consultations talk about all HE students there are no filters for mode or level.

    For each chart you can select a year of interest (I’ve chosen the most recent year by default) or the overall indicator (which, like on the main dashboards is synthetic over four years) If you change the indicator you may have to change the year. I’ve not included any indications of error – these are small numbers and the possible error is wide so any responsible regulator would have to do more investigating before stepping in to regulate.

    Recall that the DfE proposal is that institutions with more than 300 higher education students would have to register with OfS if they are not regulated in another way (as a school, FE college, or local authority, for instance). I make that 26 with more than 300 students, a small number of which appear to be regulated as an FE college.

    You can also see which lead providers are involved with each delivery partner – there are several that have relationships with multiple universities. It is instructive to compare outcomes data within a delivery partner – clearly differences in quality assurance and course design do have an impact, suggesting that the “naive university hoodwinked by low quality franchise partner” narrative, if it has any truth to it at all, is not universally true.

    [Full screen]

    The charts showing the actual outcomes are filtered by mode and level as you would expect. Note that not all levels are available for each mode of study.

    This chart brings in filters for level and mode – there are different indicators, benchmarks, and thresholds for each combination of these factors. Again, there is data suppression (low numbers and responses) going on, so you won’t see every single aspect of every single relationship in detail.

    That said, what we do see is a very mixed bag. Quite a lot of provision sits below the threshold line, though there are also some examples of very good outcomes – often at smaller, specialist, creative arts colleges.

    Registration

    I’ve flipped those two charts to allow us to look at the exposure of registered universities to this part of the market. The overall sizes in recent years at some providers won’t be of any surprise to those who have been following this story – a handful of universities have grown substantially as a result of a strategic decision to engage in multiple academic partnerships.

    [Full screen]

    Canterbury Christ Church University, Bath Spa University, Buckinghamshire New University, and Leeds Trinity University have always been the big four in this market. But of the 84 registered providers engaged in partnerships, I count 44 that met the 100 student threshold for the new condition of registration B3 had it applied in 2022–23.

    Looking at the outcomes measures suggests that what is happening across multiple partners is not offering wide variation in performance, although there will always be teaching provider, subject, and population variation. It is striking that places with a lot of different partners tend to get reasonable results – lower indicator values tend to be found at places running just one or two relationships, so it does feel like some work on improving external quality assurance and validation would be of some help.

    [Full screen]

    To be clear, this is data from a few years ago (the most recent available data is from 2022–23 for continuation, 2019–20 for completion, and 2022–23 for progression). It is very likely that providers will have identified and addressed issues (or ended relationships) using internal data long before either we or the Office for Students got a glimpse of what was going on.

    A starting point

    There is clearly a lot more that can be done with what we have – and I can promise this is a dataset that Wonkhe is keen to return to. It gets us closer to understanding where problems may lie – the next phase would be to identify patterns and commonalities to help us get closer to the interventions that will help.

    Subcontractual arrangements have a long and proud history in UK higher education – just about every English provider started off in a subcontractual arrangement with the University of London, and it remains the most common way to enter the sector. A glance across the data makes it clear that there are real problems in some areas – but it is something other than the fact of a subcontractual arrangement that is causing them.

    Do you like higher education data as much as I do? Of course you do! So you are absolutely going to want to grab a ticket for The Festival of Higher Education on 11-12 November – it’s Team Wonkhe’s flagship event and data discussion is actively encouraged. 

    Source link

  • Education at a Glance 2025, Part 2

    Education at a Glance 2025, Part 2

    Three weeks ago, the Organization for Economic Co-operation and Development (OECD) released its annual stat fest, Education at a Glance (see last week’s blog for more on this year’s higher education and financing data). The most interesting thing about this edition is that the OECD chose to release some new data from the recent Programme for International Assessment of Adult Competencies (PIAAC) relating to literacy and numeracy levels that were included in the PIAAC 2013 release (see also here), but not in the December 2024 release.   

    (If you need a refresher: PIAAC is kind of like the Programme for International Student Assessment (PISA) but for adults and is carried out once a decade so countries can see for themselves how skilled their workforces are in terms of literacy, numeracy, and problem-solving).

    The specific details of interest that were missing in the earlier data release were on skill level by level of education (or more specifically, highest level of education achieved). OECD for some reason cuts the data into three – below upper secondary, upper secondary and post-secondary non-tertiary, and tertiary. Canada has a lot of post-secondary non-tertiary programming (a good chunk of community colleges are described this way) but for a variety of reasons lumps all college diplomas in with university degrees in with university degrees as “tertiary”, which makes analysis and comparison a bit difficult. But we can only work with the data the OECD gives us, so…

    Figures 1, 2 and 3 show PIAAC results for a number of OECD countries, comparing averages for just the Upper Secondary/Post-Secondary Non-Tertiary (which I am inelegantly going to label “US/PSNT”) and Tertiary educational attainment. They largely tell similar stories. Japan and Finland tend to be ranked towards the top of the table on all measures, while Korea, Poland and Chile tend to be ranked towards the bottom. Canada tends to be ahead of the OECD average at both levels of education, but not by much. The gap between US/PSNT and Tertiary results are significantly smaller on the “problem-solving” measure than on the others (which is interesting and arguably does not say very nice things about the state of tertiary education, but that’s maybe for another day). Maybe the most spectacular single result is that Finns with only US/PSNT education have literacy scores higher than university graduates in all but four other countries, including Canada.

    Figure 1: PIAAC Average Literacy Scores by Highest Level of Education Attained, Population Aged 25-64, Selected OECD Countries

    Figure 2: PIAAC Average Numeracy Scores by Highest Level of Education Attained, Population Aged 25-64, Selected OECD Countries

    Figure 3: PIAAC Average Problem Scores by Highest Level of Education Attained, Population Aged 25-64, Selected OECD Countries

    Another thing that is consistent across all of these graphs is that the gap between US/PSNT and tertiary graduates is not at all the same. In some countries the gap is quite low (e.g. Sweden) and in other countries the gap is quite high (e.g. Chile, France, Germany). What’s going on here, and does it suggest something about the effectiveness of tertiary education systems in different countries (i.e. most effective where the gaps are high, least effective where they are low)?

    Well, not necessarily. First, remember that the sample population is aged 25-64, and education systems undergo a lot of change in 40 years (for one thing, Poland, Chile and Korea were all dictatorships 40 years ago). Also, since we know scoring on these kinds of tests decline with age, demographic patterns matter too. Second, the relative size of systems matters. Imagine two secondary and tertiary systems had the same “quality”, but one tertiary system took in half of all high school graduates and the other only took in 10%. Chances are the latter would have better “results” at the tertiary level, but it would be entirely due to selection effects rather than to treatment effects.

    Can we control for these things? A bit. We can certainly control for the wide age-range because OECD breaks down the data by age. Re-doing Figures 1-3, but restricting the age range to 25-34, would at least get rid of the “legacy” part of the problem. This I do below in Figures 4-6. Surprisingly little changes as a result. The absolute scores are all higher, but you’d expect that given what we know about skill loss over time.  Across the board, Canada remains just slightly ahead of the OECD average. Korea does a bit better in general and Italy does a little bit worse, but other than the rank-order of results is pretty similar to what we saw for the general population (which I think is a pretty interesting finding when you think of how much effort countries put in to messing around with their education systems…does any of it matter?)

    Figure 4: PIAAC Average Literacy Scores by Highest Level of Education Attained, Population Aged 25-34, Selected OECD Countries

    Figure 5: PIAAC Average Numeracy Scores by Highest Level of Education Attained, Population Aged 25-34, Selected OECD Countries

    Figure 6: PIAAC Average Problem Scores by Highest Level of Education Attained, Population Aged 25-34, Selected OECD Countries

    Now, let’s turn to the question of whether or not we can control for selectivity. Back in 2013, I tried doing something like that, but it was only possible because OECD released PIAAC scores not just as averages but also in terms of quartile thresholds, and that isn’t the case this time. But what we can do is look a bit at the relationship between i) the size of the tertiary system relative to the size of the US/PSNT system (a measure of selectivity, basically) and ii) the degree to which results for tertiary students are higher than those for US/PSNT. 

    Which is what I do in Figure 7. The X-axis here is selectivity [tertiary attainment rate ÷ US/PSNT attainment rate rate] for 25-34 year olds on (the further right on the graph, the more open-access the system), and the Y-axis is PIAAC gaps Σ [tertiary score – US/PSNT score] across the literacy, numeracy and problem-solving measures (the higher the score, the bigger the gap between tertiary and US/PSNT scores). It shows that countries like Germany, Chile and Italy are both more highly selective and have greater score gaps than countries like Canada and Korea, which are the reverse. It therefore provides what I would call light support for the theory that the less open/more selective a system of tertiary education is, the bigger the gap tertiary between Tertiary and US/PSNT scores on literacy, numeracy and problem-solving scores.  Meaning, basically, beware of interpreting these gaps as evidence of relative system quality: they may well be effects of selection rather than treatment.

    Figure 7: Tertiary Attainment vs. PIAAC Score Gap, 25-34 year-olds

    That’s enough PIAAC fun for one Monday.  See you tomorrow.

    Source link

  • Graduate outcomes should present a bigger picture

    Graduate outcomes should present a bigger picture

    September marks the start of the next round of Graduate Outcomes data collection.

    For universities, that means weeks of phone calls, follow-up emails, and dashboards that will soon be populated with the data that underpins OfS regulation and league tables.

    For graduates, it means answering questions about where they are, what they’re doing, and how they see their work and study 15 months on.

    A snapshot

    Graduate Outcomes matters. It gives the sector a consistent data set, helps us understand broad labour market trends, and (whether we like it or not) has become one of the defining measures of “quality” in higher education. But it also risks narrowing our view of graduate success to a single snapshot. And by the time universities receive the data, it is closer to two years after a student graduates.

    In a sector that can feel slow to change, two years is still a long time. Whole programmes can be redesigned, new employability initiatives launched, employer engagement structures reshaped. Judging a university on what its graduates were doing two years ago is like judging a family on how it treated the eldest sibling – the rules may well have changed by the time the younger one comes along. Applicants are, in effect, applying to a university in the past, not to the one they will actually experience.

    The problem with 15 months

    The design of Graduate Outcomes reflects a balance between timeliness and comparability. Fifteen months was chosen to give graduates time to settle into work or further study, but not so long that recall bias takes over. The problem is that 15 months is still very early in most careers, and by the time results are published, almost two years have passed.

    For some graduates, that means they are captured at their most precarious: still interning, trying out different sectors, or working in roles that are a stepping stone rather than a destination. For others, it means they are invisible altogether, portfolio workers, freelancers, or those in international labour markets where the survey struggles to track them.

    And then there is the simple reality that universities cannot fully control the labour market. If vacancies are not there because of a recession, hiring freezes, or sector-specific shocks, outcomes data inevitably dips, no matter how much careers support is offered. To read Graduate Outcomes as a pure reflection of provider performance is to miss the economic context it sits within.

    The invisible graduates

    Graduate Outcomes also tells us little about some of the fastest-growing areas of provision. Apprentices, CPD learners, and in future those engaging through the Lifelong Learning Entitlement (LLE), all sit outside its remit. These learners are central to the way government imagines the future of higher education (and in many cases to how universities diversify their own provision) yet their outcomes are largely invisible in official datasets.

    At the same time, Graduate Outcomes remains prominent in league tables, where it can have reputational consequences far beyond its actual coverage. The risk is that universities are judged on an increasingly narrow slice of their student population while other important work goes unrecognised.

    Looking beyond the survey

    The good news is that we are not short of other measures.

    • Longitudinal Education Outcomes (LEO) data shows long-term earnings trajectories, reminding us that graduates often see their biggest salary uplift years into their careers, not at the start. An Institute for Fiscal Studies report highlighted how the biggest benefits of a degree are realised well beyond the first few years.
    • The Resolution Foundation’s Class of 2020 study argued that short-term measures risk masking the lifetime value of higher education.
    • Alumni engagement gives a richer picture of where graduates go, especially internationally. Universities that invest in tracer studies or ongoing alumni networks often uncover more diverse and positive stories than the survey can capture.
    • Skills data (whether through Careers Registration or employer feedback) highlights what students can do and how they can articulate it. That matters as much as a job title, particularly in a labour market where roles evolve quickly.
    • Case studies, student voice, and narratives of career confidence help us understand outcomes in ways metrics cannot.

    Together, these provide a more balanced picture: not to replace Graduate Outcomes, but to sit alongside it.

    Why it matters

    For universities, an over-reliance on Graduate Outcomes risks skewing resources. So much energy goes into chasing responses and optimising for a compliance metric, rather than supporting long-term student success.

    For policymakers, it risks reinforcing a short-term view of higher education. If the measure of quality is fixed at 15 months, providers will inevitably be incentivised to produce quick wins rather than lifelong skills.

    For applicants, it risks misrepresenting the real offer of a university. They make choices on a picture that is not just partial, but out of date.

    Graduate Outcomes is not the enemy. It provides valuable insights, especially at sector level. But it needs to be placed in an ecosystem of measures that includes long-term earnings (LEO), alumni networks, labour market intelligence, skills data, and qualitative student voice.

    That would allow universities to demonstrate their value across the full diversity of provision, from undergraduates to apprentices to CPD learners. It would also allow policymakers and applicants to see beyond a two-year-old snapshot of a 15-month window.

    Until we find ways to measure what success looks like five, ten or twenty years on, Graduate Outcomes risks telling us more about the past than the future of higher education.

    Source link

  • OfS Outcomes (B3) data, 2025

    OfS Outcomes (B3) data, 2025

    The Office for Students’ release of data relating to Condition of Registration B3 is the centerpiece of England’s regulator’s quality assurance approach.

    There’s information on three key indicators: continuation (broadly, the proportion of students who move from year one to year two), completion (pretty much the proportion who complete the course they sign up for), and progression (the proportion who end up in a “good” destination – generally high skilled employment or further study).

    Why B3 data is important

    The power comes from the ability to view these indicators for particular populations of students – everything from those studying a particular subject and those with a given personal characteristic, through to how a course is delivered. The thinking goes that this level of resolution allows OfS to focus in on particular problems – for example a dodgy business school (or franchise delivery operation) in an otherwise reasonable quality provider.

    The theory goes that OfS uses these B3 indicators – along with other information such as notifications from the public, Reportable Event notifications from the provider itself, or (seemingly) comment pieces in the Telegraph to decide when and where to intervene in the interests of students. Most interventions are informal, and are based around discussions between the provider and OfS about the identified problem and what is being done to address it. There have been some more formal investigations too.

    Of course, providers themselves will be using similar approaches to identify problems in their own provision – in larger universities this will be built into a sophisticated data-driven learner analytics approach, while some smaller providers primarily what is in use this release (and this is partly why I take the time to build interactives that I feel are more approachable and readable than the OfS versions).

    Exploring B3 using Wonkhe’s interactive charts

    These charts are complicated because the data itself is complicated, so I’ll go into a bit of detail about how to work them. Let’s start with the sector as a whole:

    [Full screen]

    First choose your indicator: Continuation, completion, and progression.

    Mode (whether students are studying full time, part time, or on an apprenticeship) and level (whether students are undergraduate, postgraduate, and so on) are linked: there are more options for full and part time study (including first degree, taught postgraduate, and PhD) and less for apprenticeships (where you can see either all undergraduates or all postgraduates).

    The chart shows various splits of the student population in question – the round marks show the actual value of the indicator, the crosses show the current numeric threshold (which is what OfS has told us is the point below which it would start getting stuck in to regulating).

    Some of the splits are self-explanatory, others need a little unpacking. The Index of Multiple Deprivation (IMD) is a standard national measure of how socio-economically deprived a small area is – quintile 1 is the most deprived, quintile 5 is the least deprived. Associations Between Characteristics of Students (ABCs) is a proprietary measure developed by OfS which is a whole world of complexity: here all you need to know is that quintile five is more likely to have good outcomes on average, and quintile 1 are least likely to have good outcomes.

    If you mouse over any of the marks you will get some more information: the year(s) of data involved in producing the indicator (by definition most of this data refers to a number of years ago and shouldn’t really be taken as an indication of a problem that is happening right now), and the proportion of the sample that is above or below the threshold. The denominator is simply the number of students involved in each split of the population.

    There’s also a version of this chart that allows you to look at an individual provider: choose that via the drop down in the middle of the top row.

    [Full screen]

    You’ll note you can select your population: Taught or registered includes students taught by the provider and students who are registered with a provider but taught elsewhere (subcontracted out), taught only is just those students taught by a provider (so, no subcontractual stuff), partnership includes only students where teaching is contracted out or validated (the student is both registered and taught elsewhere, but the qualification is validated by this provider)

    On the chart itself, you’ll see a benchmark marked with an empty circle: this is what OfS has calculated (based on the characteristics of the students in question) the value of the indicator should be – the implications being that the difference from the benchmark is entirely the fault of the provider. In the mouse-over I’ve also added the proportion of students in the sample above and below the benchmark.

    OfS take great pains to ensure that B3 measures can’t be seen as a league table, as this would make their quality assurance methodology look simplistic and context-free. Of course, I have built a league table anyway just to annoy them: the providers are sorted by the value of the indicator, with the other marks shown as above (note that not all options have a benchmark value). Here you can select a split indicator type (the group of characteristics you are interested in) and then the split indicator (specific characteristic) you want to explore using the menus in the middle of the top row – the two interact and you will need to set them both.

    You can find a provider of interest using the highlighter at the bottom, or just mouse over a mark of interest to get the details on the pop-up.

    [Full screen]

    With so much data going on there is bound to be something odd somewhere – I’ve tried to spot everything but if there’s something I’ve missed please let me know via an email or a comment. A couple of things you may stumble on – OfS has suppressed data relating to very small numbers of students, and if you ever see a “null” value for providers it refers to the averages for the sector as a whole.

    Yes, but does it regulate?

    It is still clear that white and Asian students have generally better outcomes than those from other ethnicities, that a disadvantaged background makes you less likely to do well in higher education, and that students who studied business are less likely to have a positive progression outcome than those who studied the performing arts.

    You might have seen The Times running with the idea that the government is contemplating restrictions on international student visas linked to the completion rates of international students. It’s not the best idea for a number of reasons, but should it be implemented a quick look at the ranking chart (domicile; non-uk) will let you know which providers would be at risk in that situation: for first degree it’s tending towards the Million Plus end of things, for taught Masters provision we are looking at smaller non-traditional providers.

    Likewise, the signs are clear that a crackdown on poorly performing validated provision is incoming – using the ranking chart again (population type: partnership, splits: type of partnerships – only validated) shows us a few places that might have completion problems when it comes to first degree provision.

    If you are exploring these (and I bet you are!) you might note some surprisingly low denominator figures – surely there has been an explosion in this type of provision recently? This demonstrates the achillies heel of the B3 data: completion data relates to pre-pandemic years (2016-2019), continuation to 2019-2022. Using four years of data to find an average is useful when provision isn’t changing much – but given the growth of validation arrangements in recent years, what we see here tells us next to nothing about the sector as it currently is.

    Almost to illustrate this point, the Office for Students today announced an investigation into the sub-contractual arrangement between Buckinghamshire New University and the London School of Science and Technology. You can examine these providers in B3 and if you look at the appropriate splits you can see plenty of others that might have a larger problem – but it is what is happening in 2025 that has an impact on current students.

    Source link

  • If we are serious about improving student outcomes, we can’t treat teacher retention as an afterthought

    If we are serious about improving student outcomes, we can’t treat teacher retention as an afterthought

    In the race to help students recover from pandemic-related learning loss, education leaders have overlooked one of the most powerful tools already at their disposal: experienced teachers.

    For decades, a myth has persisted in education policy circles that after their first few years on the job, teachers stop improving. This belief has undercut efforts to retain seasoned educators, with many policymakers and administrators treating veteran teachers as replaceable cogs rather than irreplaceable assets.

    But that myth doesn’t hold up. The evidence tells a different story: Teachers don’t hit a plateau after year five. While their growth may slow, it doesn’t stop. In the right environments — with collaborative colleagues, supportive administrators and stable classroom assignments — teachers can keep getting better well into their second decade in the classroom.

    This insight couldn’t come at a more critical time. As schools work to accelerate post-pandemic learning recovery, especially for the most vulnerable students, they need all the instructional expertise they can muster.

    That means not just recruiting new teachers but keeping their best educators in the classroom and giving them the support they need to thrive.

    Related: A lot goes on in classrooms from kindergarten to high school. Keep up with our free weekly newsletter on K-12 education.

    In a new review of 23 longitudinal studies conducted by the Learning Policy Institute and published by the Thomas B. Fordham Institute, all but one of the studies showed that teachers generally improve significantly during their first five years. The research review also found continued, albeit slower, improvement well into years 6 through 15; several of the studies found improvement into later years of teaching, though at a diminished pace.

    These gains translate into measurable benefits for students: higher test scores, fewer disciplinary issues, reduced absenteeism and increased postsecondary attainment. In North Carolina, for example, students with highly experienced English teachers learned more and were substantially less likely to skip school and more likely to enjoy reading. These effects were strongest for students who were most at risk of falling behind.

    While experience helps all teachers improve, we’re currently failing to build that experience where it’s needed most. Schools serving large populations of low-income Black and Hispanic students are far more likely to be staffed primarily by early career teachers.

    And unfortunately, they’re also more likely to see those teachers leave after just a few years. This churn makes it nearly impossible to build a stable, experienced workforce in high-need schools.

    It also robs novice teachers of the veteran mentors who could help them get better faster and robs students of the opportunity to learn from seasoned educators who have refined their craft over time.

    To fix this, we need to address both sides of the equation: helping teachers improve and keeping them in the classrooms that need them most.

    Research points to several conditions that support continued teacher growth. Beginning teachers are more likely to stay and improve if they have had high-quality preparation and mentoring. Teaching is not a solo sport. Educators who work alongside more experienced peers improve faster, especially in the early years.

    Teachers also improve more when they’re able to teach the same grade level or subject year after year. Unfortunately, those in under-resourced schools are more likely to be shuffled around, undermining their ability to build expertise.

    Perhaps most importantly, schools that have strong leadership and which foster time for collaboration and a culture of professional trust see greater gains in teacher retention over time.

    Teachers who feel supported by their administrators, who collaborate with a team that shares their mission and who aren’t constantly switching subjects or grade levels are far more likely to stay in the profession.

    Pay matters too, especially in high-need schools where working conditions are toughest. But incentives alone aren’t enough. Short-term bonuses can attract teachers, but they won’t keep them if the work environment drives them away.

    Related: One state radically boosted new teacher pay – and upset a lot of teachers

    If we’re serious about improving student outcomes, especially in the wake of the pandemic, we have to stop treating teacher retention as an afterthought. That means retooling our policies to reflect what the research now clearly shows: experience matters, and it can be cultivated.

    Policymakers should invest in high-quality teacher preparation and mentoring programs, particularly in high-need schools. They should create conditions that promote teacher stability and collaboration, such as protected planning time and consistent teaching assignments.

    Principals must be trained not just as managers, but as instructional leaders capable of building strong school cultures. And state and district leaders must consider meaningful financial incentives and other supports to retain experienced teachers in the classrooms that need them most.

    With the right support, teachers can keep getting better. In this moment of learning recovery, a key to success is keeping teachers in schools and consciously supporting their growing effectiveness.

    Linda Darling-Hammond is founding president and chief knowledge officer at the Learning Policy Institute. Michael J. Petrilli is president of the Thomas B. Fordham Institute, a visiting fellow at the Hoover Institution and an executive editor of Education Next.

    Contact the opinion editor at [email protected].

    This story about teacher retention was produced by The Hechinger Report, a nonprofit, independent news organization focused on inequality and innovation in education. Sign up for Hechinger’s weekly newsletter.

    The Hechinger Report provides in-depth, fact-based, unbiased reporting on education that is free to all readers. But that doesn’t mean it’s free to produce. Our work keeps educators and the public informed about pressing issues at schools and on campuses throughout the country. We tell the whole story, even when the details are inconvenient. Help us keep doing that.

    Join us today.

    Source link

  • Graduate Outcomes, 2022-23 graduating year

    Graduate Outcomes, 2022-23 graduating year

    The headline numbers from this year’s graduate outcomes data – which represents the activities and experiences of the cohort that graduated in 2022-23 around 15 months after graduation look, on the face of it, disappointing.

    There’s a bunch of things to bear in mind before we join the chorus claiming to perceive the end of graduate employment as a benefit of higher education due to some mixture (dilute to preference) of generative AI, the skills revolution, and wokeness.

    We are coming off an exceptional year both for graduate numbers and graduate recruitment – as the pandemic shock dissipates numbers will be returning to normal: viewed in isolation this looks like failure. It isn’t.

    But we’ve something even more fundamental to think about first.

    Before we start

    We’re currently living in a world in which HESA’s Graduate Outcomes data represents the UK’s only comprehensive official statistics dealing with employment.

    If you’ve not been following the travails of the ONS Labour Force Survey (the July overview is just out) large parts of the reported results are currently designated “official statistics in development” and thus not really usable for policy purposes – the response rate is currently around 20 per cent after some very hard work by the transformation team, having been hovering in the mid-teens for a good while.

    Because this is Wonkhe we’re going to do things properly and start with looking at response rates and sample quality for Graduate Outcomes, so strap in. We’ll get to graduate activities in a bit. But this stuff is important.

    Response rates and sample quality

    Declining survey response rates are a huge problem all over the place – and one that should concern anyone who uses survey data to make policy or support the delivery of services. If you are reading or drawing any actionable conclusions from a survey you should have the response rate and sample quality front and centre.

    The overall completion rate for the 2022-23 cohort for Graduate Outcomes was 35 per cent, which you can bump up to 39 per cent if you include partial completions (when someone started on the form but gave up half-way through). This is down substantially from 48 per cent fully completing in 2019-20, 43 per cent in 2020-21, and 40 per cent in 2021-22.

    There’s a lot of variation underneath that: but provider, level of previous study (undergraduate responses are stronger than postgraduate responses), and permanent address all have an impact. If you are wondering about sampling errors (and you’d be right to be at these response rates!) work done by HESA and others assures us that there has been no evidence of a problem outside of very small sub-samples.

    Here’s a plot of the provider level variation. I’ve included a filter to let you remove very small providers from the view based on the number of graduates for the year in question – by default you see nothing with less than 250 graduates.

    [Full screen]

    What do graduates do?

    As above, the headlines are slightly disappointing – 88 per cent of graduates from 2022-23 who responded to the survey reported that they were in work or further study, a single percentage point drop on last year. The 59 per cent in full-time employment is down from 61 per cent last year, while the proportion in unemployment is up a percentage point.

    However, if you believe that (on top of the general economic malaise) that generative AI is rendering entry level graduate jobs obsolete (a theme I will return to) you will be pleasantly surprised by how well employment is holding up. The graduate job market is difficult, but there is no evidence that it is out of the ordinary for this part of the economic cycle. Indeed, as Charlie Ball notes, we don’t see the counter-cyclical growth in further study that would suggest a full-blown downturn.

    There are factors that influence graduate activities – and we see a huge variation by provider. I’ve also included a filter here to let you investigate the impact of age: older graduates (particularly those who studied at a postgraduate level) are more likely to return to previous employment, which flatters the numbers for those who recruit more mature students.

    [Full screen]

    One thing to note in this chart is that the bar graph at the bottom shows proportions of all graduates, not the proportions of graduates with known destinations as we see at the top. I’ve done this to help put these results into context: though the sample may be representative it is not (as is frequently suggested) really a population level finding. The huge grey box at the top of each bar represents graduates that have not completed the survey.

    A lot of the time we focus on graduates in full-time employment and/or further study – this alternative plot looks at this by provider and subject. It’s genuinely fascinating: if you or someone you know is thinking about undergraduate law with a view to progressing a career there are some big surprises!

    [Full screen]

    Again, this chart shows the proportion of graduates with a known destination (ie those who responded to the Graduate Outcomes survey in some way), while the size filter refers to the total number of graduates.

    Industrial patterns

    There’s been a year-on-year decline in the proportion of graduates from UG courses in paid employment in professional services – that is the destination of just 11.92 per cent of them this year, the lowest on record. Industries that have seen growth include public administration, wholesale and retail, and health and social care.

    There’s been a two percentage point drop in the proportion of PG level graduates working in education – a lot of this could realistically put down to higher education providers recruiting fewer early-career staff. This is a huge concern, as it means a lot of very capable potential academics are not getting the first jobs they need to keep them in the sector.

    And if you’ve an eye on the impact of generative AI on early career employment, you’d be advised to keep an eye on the information and communication sector – currently machine generated slop is somehow deemed acceptable for many industrial applications (and indeed employment applications themselves, a whole other can of worms: AI has wrecked the usual application processes of most large graduate employers) in PR, media, and journalism. The proportion of recent undergraduates in paid employment in the sector has fallen from nearly 8 per cent in 2020-21 to just 4.86 per cent over the last two years. Again, this should be of national concern – the UK punches well above its weight in these sectors, and if we are not bringing in talented new professionals to gain experience and enhance profiles then we will lose that edge.

    [Full screen]

    To be clear, there is limited evidence that AI is taking anyone’s jobs, and you would be advised to take the rather breathless media coverage with a very large pinch of salt.

    Under occupation

    Providers in England will have an eye on the proportion of those in employment in the top three SOC codes, as this is a key part of the Office for Students progression measure. Here’s a handy chart to get you started with that, showing by default providers with 250 or more graduates in employment, and sorted by the proportion in the top three SOC categories (broadly managers and directors, professionals, and associate professionals).

    [Full screen]

    This is not a direct proxy for a “graduate job”, but it seems to be what the government and sector have defaulted to using instead of getting into the weeds of job descriptions. Again, you can see huge differences across the sector – but do remember subject mix and the likely areas in which graduates are working (along with the pre-existing social capital of said graduates) will have an impact on this. Maybe one day OfS will control for these factors in regulatory measures – we can but hope.

    Here’s a plot of how a bunch of other personal characteristics (age of graduates, ethnicity, disability, sex) can affect graduate activities, alongside information on deprivation, parental education, and socio-economic class for undergraduates. The idea of higher education somehow levelling out structural inequalities in the employment market completely was a fashionable stick to beat the sector with under the last government.

    [Full screen]

    [Full screen]

    Everything else

    That’s a lot of charts and a lot of information to scratch the surface of what’s in the updated graduate outcomes tables. I had hoped to see the HESA “quality of work” measure join the collection – maybe next year – so I will do a proxy version of that at some point over the summer. There’s also data on wellbeing which looks interesting, and a bunch of stuff on salaries which really doesn’t (even though it is better than LEO in that it reflects salaries rather than the more nebulous “earnings”) There’s information on the impact of degree classifications on activity, and more detail around the impact of subjects.

    Look out for more – but do bear in mind the caveats above.

    Source link

  • Centralized IT governance helps improve learning outcomes

    Centralized IT governance helps improve learning outcomes

    Key points:

    As school districts continue to seek new ways to enhance learning outcomes, Madison County School District represents an outstanding case study of the next-level success that may be attained by centralizing IT governance and formalizing procedures.

    When Isaac Goyette joined MCSD approximately seven years ago, he saw an opportunity to use his role as Coordinator of Information Technology to make a positive impact on the most important mission of any district: student learning. The district, located in northern Florida and serving approximately 2,700 students, had made strides towards achieving a 1:1 device ratio, but there was a need for centralized IT governance to fully realize its vision.

    Goyette’s arrival is noted for marking the beginning of a new era, bringing innovation, uniformity, and central control to the district’s technology infrastructure.  His team aimed to ensure that every school was using the same systems and processes, thereby advancing the students’ access to technology.

    Every step of the way, Goyette counted on the support of district leadership, who recognized the need for optimizing IT governance. Major projects were funded through E-rate, grants, and COVID relief funds, enabling the district to replace outdated systems without burdening the general fund.  MCSD’s principals and staff have embraced the IT team’s efforts to standardize technology across the district, leading to a successful implementation. Auto rostering and single sign-on have made processes easier for everyone, and the benefits of a cohesive, cross-department approach are now widely recognized.

    To successfully support and enable centralization efforts, Goyette recognized the need to build a strong underlying infrastructure. One of the key milestones in MCSD’s technology journey was the complete overhaul of its network infrastructure. The existing network was unreliable and fragmented in design. Goyette and his team rebuilt the network from the ground up, addressing connectivity issues, upgrading equipment, and logically redoing district systems and processes, such as the district’s IP network addressing scheme. This transformation has had a positive impact on student learning and engagement. With reliable connectivity, students no longer face disruptions.

    The implementation of an enterprise-grade managed WAN solution has further transformed the educational experience for MCSD’s students and educators, serving as the backbone for all other technologies. Goyette’s innovative co-management approach, coupled with his deep understanding of network topology, has enabled him to optimize the resources of an experienced K-12 service provider while retaining control and visibility over the district’s network.

    New School Safety Resources

    Another significant milestone MCSD has achieved is the successful deployment of the district’s voice system. This reliable phone system is crucial for ensuring that MCSD’s schools, staff, and parents remain seamlessly connected, enhancing communication and safety across the district.

    Goyette’s innovative leadership extends to his strategies for integrating technology in the district. He and his team work closely with the district’s curriculum team to ensure that technology initiatives align with educational goals. By acting as facilitators for educational technology, his team prevents app sprawl and ensures that new tools are truly needed and effective.

    “Having ongoing conversations with our principals and curriculum team regarding digital learning tools has been critical for us, ensuring we all remain aligned and on the same page,” said Goyette. “There are so many new apps available, and many of them are great. However, we must ask ourselves: If we already have two apps that accomplish the same goal or objective, why do we need a third? Asking those questions and fostering that interdepartmental dialogue ensures everyone has a voice, while preventing the headaches and consequences of everyone doing their own thing.”   

    MCSD’s IT transformation has had a profound impact on student learning and engagement. With reliable connectivity and ample bandwidth, students no longer face disruptions, and processes like single sign-on and auto account provisioning have streamlined their access to educational resources. The district’s centralization efforts have not only improved the educational experience for students and educators but have also positioned Madison County School District as a model of success and innovation.

                                                                                                                ###

    Latest posts by eSchool Media Contributors (see all)

    Source link