Get stories like this delivered straight to your inbox. Sign up for The 74 Newsletter
This story was originally published by CalMatters. Sign up for their newsletters.
When Brigitta Hunter started her teaching career, she had $20,000 in student loans and zero income – even though she was working nearly full time in the classroom.
“We lived on my husband’s pathetic little paycheck. I don’t know how we did it,” Hunter said. “And we were lucky – he had a job and my loans weren’t that bad. It can be almost impossible for some people.”
Each year, about 28,000 people in California work for free for about a year as teachers or classroom aides while they complete the requirements for their teaching credentials. That year without pay can be a dire hardship for many aspiring teachers, even deterring them from pursuing the profession.
A new bill by Assemblymember Al Muratsuchi, a Democrat from Torrance, would set aside money for school districts to pay would-be teachers while they do their student teaching service. The goal is to help alleviate the teacher shortage and attract lower-income candidates to the profession.
“Nothing makes a bigger difference in improving the quality of public education than getting highly qualified teachers in the classroom,” Muratsuchi said. “This bill helps remove some of the obstacles to that.”
Big loans, low pay
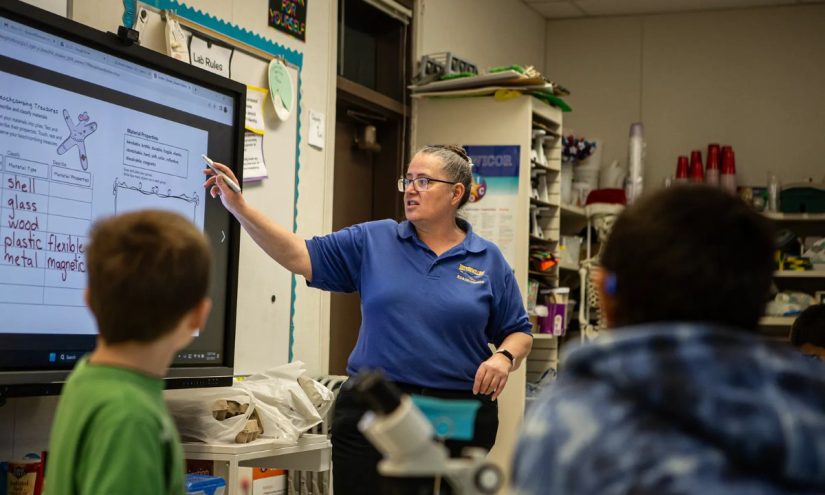
To be a K-12 public school teacher in California, candidates need a bachelor’s degree and a teaching credential, typically earned after completing a one-year program combining coursework and 600 hours of classroom experience. During that time, candidates work with veteran teachers or lead their own classes.
Teacher credential programs cost between $20,000 and $40,000, depending on where a student enrolls and where they live. In 2020, about 60% of teachers borrowed money to finish their degrees, according to a recent study by the Learning Policy Institute, with loans averaging about $30,000 for a four-year bachelor’s degree and a credential program.
Entering the profession with hefty student loans can be demoralizing and stressful, the report said, adding to the challenges new teachers face. The average starting teacher salary in California is $58,000, according to the National Education Association, among the highest in the country but still hard to live on in many parts of the state. It could take a decade or more for teachers to pay off their loans.
Muratsuchi’s bill, AB 1128, passed the Assembly on Monday and now awaits a vote in the Senate. It would create a grant program for districts to pay student teachers the same amount they pay substitute teachers, which is roughly $140 a day. The overall cost would be up to $300 million a year, according to Assembly analysts, but Gov. Gavin Newsom has set aside $100 million for the program in his revised budget.
Muratsuchi has another bill related to teacher pay, also working its way through the Legislature. Assembly bill 477, which passed the Assembly this week, would raise teacher salaries across the board.
Paying teachers, saving money
Christopher Carr, executive director of Aspire Public Schools in Los Angeles, a network of 11 charter schools, called the bill a potential “game changer.”
Teacher candidates often have to work second jobs to make ends meet, and sometimes finish with debt of $70,000 or more, he said. That can be an insurmountable barrier for people with limited resources. Paying would-be teachers would attract more people to the teaching profession, especially Black and Latino candidates, he said.
School districts around the state have been trying to diversify their teacher workforces, based on research showing that Black and Latino students tend to do better academically when they have at least one teacher of the same race.
Carr’s schools pay their teachers-in-training through grants and a partnership with a local college, which has led to more of them staying on to teach full time after they receive their credentials, he said. That has saved the schools money by reducing turnover.
“This could open doors and be a step toward racial justice,” Carr said. “California has a million spending priorities, but this will lead to better outcomes for students and ultimately save the state money.”
Tyanthony Davis, chief executive director of Inner City Education Foundation, a charter school network in Los Angeles, put it this way: “If we have well paid, qualified, happy teachers, we’ll have happier classrooms.”
No opposition, yet
Muratusuchi’s bill has no formal opposition. The California Taxpayers Association has not taken a position. The California Teachers Association, the state’s largest teachers union, is a supporter.
“This legislation comes at a critical time as we continue to face an educator recruitment and retention crisis,” said David Goldberg, the union president. “Providing new grants to compensate student teachers for important on-the-job training is a strong step forward in the right direction to strengthening public education.”
Hunter survived her student-teaching experience and went on to teach fourth grade for 34 years, retiring last year from the Mark West Union School District in Santa Rosa. The last 15 years of her career she served as a mentor to aspiring teachers. She saw first-hand the stress that would-be teachers endure as they juggle coursework, long days in the classroom and often second jobs on nights and weekends.
But paying student-teachers, she said, should only be the beginning. Novice teachers also need smaller class sizes, more support from administrators and more help with enrichment activities, such as extra staff to lead lessons in art and physical education.
“We definitely need more teachers, and paying student teachers is a good start,” Hunter said. “But there’s a lot more we can do to help them.”
This article was originally published on CalMatters and was republished under the Creative Commons Attribution-NonCommercial-NoDerivatives license.
Get stories like these delivered straight to your inbox. Sign up for The 74 Newsletter