This audio is auto-generated. Please let us know if you have feedback.
Dive Brief:
Academic performance drops when temperatures rise, according to a study released Thursday by the NWEA. When test-day temperatures clocked over 80 degrees, students had lower math MAP Growth scores, the organization that administers the assessment found.
Extreme heat affects high-poverty students especially. The NWEA study found that high heat negatively impacted math scores up to twice as much for students in high-poverty schools than for those from low-poverty schools.
The study recommends educators set testing schedules around weather conditions when possible, create better testing conditions by moving testing to cooler areas and testing during the morning, invest in updated HVAC infrastructure, and ensure that districts’ infrastructure planning takes into account high-poverty communities.
Dive Insight:
In 2020, over half of the nation’s schools (54%) needed to update or replace multiple building systems or features in their schools, according to a report released by the Government Accountability Office. About 41% of public school districts needed to update or replace the HVAC systems in at least half of their schools, according to the report.
“If not addressed, such problems can lead to indoor air quality problems and mold, and in some cases caused schools to adjust schedules temporarily,” the GAO report found.
At the same time, the school year is getting hotter.
Heat waves impact schools “seemingly everywhere,” according to the Climate Action Campaign, including in Arizona, Georgia, Michigan and Wisconsin. In August, for example, schools in Portland, Oregon, closed early in anticipation of a heat wave, according to local reports.
And by this year, about 2,671 additional school districts were expected to log 32 or more days of weather over 80 degrees — the heat threshold where cooling systems are typically installed. That number of school districts is a 39% increase since 1970, according to a 2021 project by the Center for Climate Integrity.
Such climate changes impact academics, a finding confirmed by the NWEA study released Thursday.
It gathered data from nearly 3 million MAP Growth tests administered to students in grades 3-6 across six states between 2022 and 2024. The study found that on days hotter than 101 degrees, students’ math performance was about 0.06 standard deviations below students who tested in 60 degree weather. The difference is about 10% of a 5th grader’s learning during a school year.
“Our findings show that as temperatures continue to rise, disparities in school facilities, such as having appropriate HVAC systems, can deepen existing inequities and make school infrastructure and building conditions significant issues of educational equity,” said Sofia Postell, research analyst at NWEA, in a Thursday statement.
The findings expand on previous ones examining heat’s impacts on student achievement.
In 2020, a study published by the American Economic Association found that “heat directly disrupts learning time,” and that without air conditioning, a school year hotter by 1 degree reduces that year’s learning by 1%. The same study also found that hot school days disproportionately impact minority students, and even account for about 5% of the racial achievement gap.
Securing steady enrollment growth and keeping students happily on board are top priorities in higher education. But how do you ensure you’re truly meeting student needs and demands? It’s all about measuring performance effectively. Gone are the days of navigating blindly through raw data; Key Performance Indicators (KPIs) are the laser-focused measures that cut through the noise, providing clear direction and a true sense of what’s working. It’s time to harness the power of data to steer your institution toward success.
Key Performance Areas
So, where do you start?
Determining your institution’s unique strategic goals is the first step. Once you know your target destination, KPIs become the navigation tools that guide you there. Look beyond generic metrics and choose a balanced set of KPIs across six performance areas:
AI Readiness
AI Readiness is the next-generation key area that proves you’re building a university that is smarter, more efficient and more responsive than anything the old systems could produce. If AI isn’t a core part of your institution’s DNA, you’re not just falling behind, you’re becoming obsolete. This isn’t about having a chatbot on your admissions page. It’s about a complete institutional transformation.
You can’t manage what you don’t measure. Here are the metrics that will expose whether your institution has truly embraced the future.
AI density: Percentage of keywords that are ranking in AI overviews.
Engagement metrics from AI chatbots such as engaged sessions and views.
AI-Driven Workflow Automation Rate: Percentage of key administrative processes (e.g., admissions review, financial aid queries) that are fully or partially automated by AI.
AI-Informed Decision-Making Rate: Percentage of high-level strategic decisions made based on predictive analytics and AI models.
Student Support AI Integration: The percentage of student inquiries (e.g., in financial aid, advising or registrar services) handled by AI-powered tools.
Personalized Learning Platform Adoption: The percentage of courses or students utilizing AI-powered platforms to tailor educational content and pace.
Enrollment and Student Retention Metrics
Strong enrollment and retention lead to higher graduation rates, reduced revenue loss and an improved institutional reputation. Driving college or university enrollment and retention involves pinpointing relevant Persistence, Progression, Retention and Completion (PPRC) metrics, gathering data from all angles (think systems, surveys, records) and using those insights to craft action plans.
These numbers aren’t just about growth. They are a measure of your institution’s ability to engage and keep students in a hyper-competitive market.
We delve deeper into this area by tracking:
Enrollment rate: Percentage of applicants who accept and enroll in the program.
Retention rate: Percentage of students who continue their studies from one semester/year to the next.
Time-to-degree completion: Average time it takes students to graduate.
Student satisfaction: Overall satisfaction with the educational experience, measured through surveys or feedback.
Application start rate: Percentage of people who begin an application.
Application completed rate: Percentage of people who finish and submit an application.
New student start rates: Percentage of accepted students who actually begin their studies.
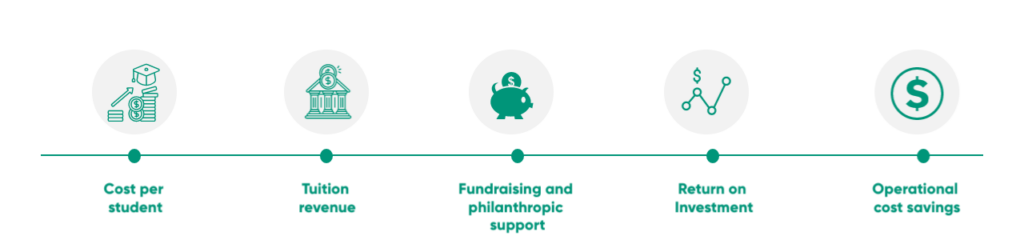
Financial and Operational Performance
A healthy financial and operational performance ensures sustainability, resource optimization, and the ability to reinvest in student success. We monitor:
Cost per student: Average cost of educating each student.
Tuition revenue: Income generated from student tuition fees.
Fundraising and philanthropic support: Donations and grants received to support the institution.
Return on investment: Measurable benefit in relation to resources invested.
Operational cost savings: Reductions in operational expenses without compromising quality.
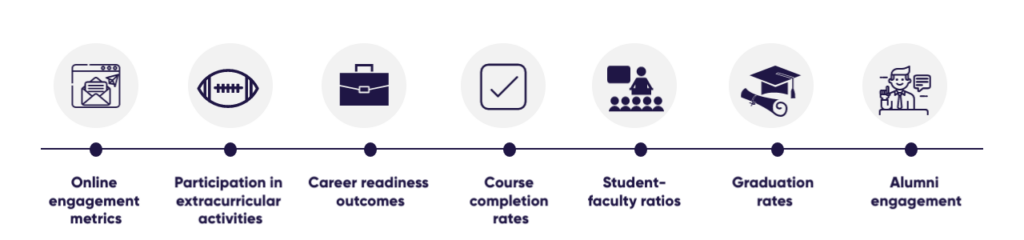
Student Engagement and Learning Outcomes
High student engagement and successful learning outcomes translate to greater student satisfaction, improved graduate employability and a boost to your institution’s reputation. Track the following key performance indicators:
Online engagement metrics: Measures of student interaction and participation in online learning platforms.
Participation in extracurricular activities: Level of student involvement in non-academic activities.
Career readiness outcomes: Success of graduates in securing employment and achieving career goals.
Course completion rates: Percentage of students who successfully complete each course.
Student-faculty ratios: Number of students assigned to each faculty member.
Graduation rates: Percentage of students graduating within the expected or predefined timeframe.
Alumni Engagement: Level of engagement and involvement of graduates with the institution.
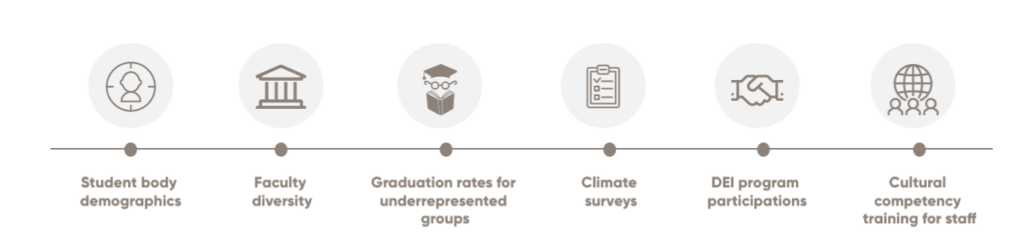
Diversity, Equity and Inclusion
Fostering a diverse and inclusive environment promotes equity in student success, attracts a wider talent pool, and strengthens your community. We assess:
Student body demographics: Representation of different ethnicities, genders, socioeconomic backgrounds, etc. in the student population.
Faculty diversity: Representation of different groups among faculty members.
Graduation rates for underrepresented groups: Success rates of students from minority or disadvantaged backgrounds.
Climate surveys: Assessments of the campus environment in terms of inclusivity and belonging.
DEI program participations: Number of students, faculty, and staff engaging in diversity, equity, and inclusion initiatives.
Cultural competency training for staff: Efforts to equip staff with knowledge and skills to support a diverse student body.
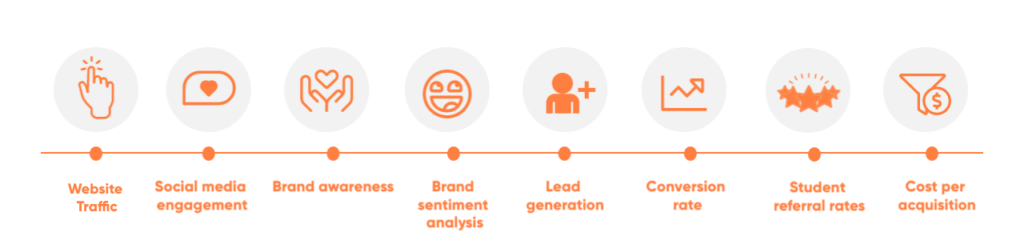
Brand Key Performance Indicators for Reputation and Marketing Effectiveness
Effective marketing strategies to increase student enrollment play a key role in establishing a strong brand reputation and contributing to a positive public image. We monitor these key performance indicators:
Website traffic: Number of visitors to the institution’s website.
Social media engagement: Likes, shares, comments, and other interactions on social media platforms.
Brand awareness: Recognition and familiarity with the institution by the target audience.
Brand sentiment analysis: Understanding public perception and opinion of the institution.
Lead generation: Number of potential students identified through marketing efforts.
Conversion rate: Percentage of leads who actually enroll in the program.
Student referral rates: Number of new students enrolled through recommendations from current or former students.
Cost per acquisition: Average cost of acquiring a new student through marketing campaigns.
Implementing KPIs for Success
You’ve chosen your key performance indicators (KPIs). But hold up, don’t get lost in a sea of data just yet. We must translate those fancy metrics into real action.
First things first, let’s talk SMART goals. Ditch the vague aspirations and define clear, measurable objectives. Instead of “improve student satisfaction,” aim for “increase student satisfaction score by 5% within the next semester.” See how much more focused and actionable that is?
Data is your fuel, but dashboards are your engine. Imagine analyzing spreadsheets manually – cumbersome, right? Data visualization tools and dashboards are your secret weapons for making sense of all that information. They reveal trends, highlight areas for improvement and showcase your progress in a clear, digestible way.
Collaboration is key. Don’t work in silos! Involve different departments – admissions, finance, academics, marketing – everyone who plays a role in achieving your goals. Share your KPIs, gather their insights and work together to track progress and make informed decisions. Remember, a data-driven culture thrives on shared ownership and collective action.
Remember, adaptability is your superpower. The higher education landscape is dynamic, so your KPIs should be too. Review and update them based on new priorities, data-driven insights and feedback regularly. Be flexible, be responsive and embrace continuous improvement as your guiding principle.
The Future is Not an Improvement. It’s a Revolution.
Your competitors—the legacy players—are selling you on a slightly better version of the past. More data, a slightly cleaner CRM, a new consulting strategy. But what if the problem isn’t a lack of optimization but a fundamental design flaw?
The next generation of enrollment demands a completely new approach built on intelligence, not just data.
From “Sticker Shock” to Financial Clarity You can’t afford to lose students to sticker price anxiety. The future is about radical transparency. It’s about a clear, simple financial aid process that tells a student their true cost of attendance from day one. No surprises. No opaque spreadsheets. Just clarity.
From Data Overload to Predictive Intelligence: Stop drowning in data. The future is about leveraging AI and predictive analytics to identify the students most likely to enroll and graduate. It’s about understanding their unique needs before they even ask and delivering a hyper-personalized experience that feels like it was designed just for them.
From Siloed Chaos to a Seamless Student Journey: Overthrow the departmental silos. The future of enrollment is an all-in-one platform that connects every stage of the student journey—from initial search to application, financial aid and enrollment. It’s one portal, one point of contact, one seamless experience.
Stop Tinkering. Start Transforming.
You have a choice. You can keep doing what you’ve always done, hoping a better website or a new consulting firm will solve a systemic problem. Or you can admit the old way of doing things is broken and choose to fundamentally transform your approach.
Your KPIs aren’t just a measure of your progress; they are proof that the traditional system is failing. It’s time to stop measuring the problem and start building the solution.
Ready to dismantle the old way and build the next generation of enrollment? Partner with EDDY to identify crucial KPIs, develop effective strategies to increase student enrollment, and track progress toward sustainable growth. Together, we can turn your data into a powerful force for positive change and empower your institution to reach its full potential.
Take the first step today! Contact EDDY to learn how we can help you leverage the power of KPIs and achieve your strategic goals.
In higher education, assignment titles often serve a functional purpose, indicating the sequence of assignments rather than their specific objectives. However, intentionally structuring assignment titles and formats can significantly influence student engagement and learning outcomes, especially in online courses. Applying adult learning theory, we redesigned assignments to emphasize process-based learning and offer scaffolded opportunities for students to engage with authentic tasks. This approach clarified expectations, enhanced performance, and fostered a more collaborative relationship between faculty and instructional designers.
We grounded our redesign in adult learning theory (andragogy) because our student population skews older, with an average age of 25, and many are returning learners balancing coursework with careers and family responsibilities. Adult learning theory emphasizes that adults learn best when they understand why they are learning something, see clear relevance to real-world contexts, and are given opportunities to reflect and apply their knowledge authentically. With these principles in mind, we aligned assignments with professional scenarios, built feedback opportunities into the workflow, and broke tasks into logical phases to support reflection and critical thinking.
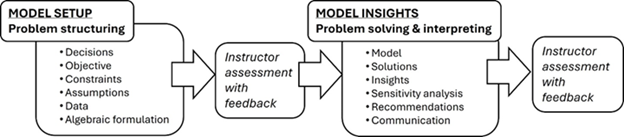
Building on this foundation, we reconsidered how assignments were labeled and structured. Traditionally, assignments were labeled “Homework 1” or “Homework 2.” These labels communicated sequence but not purpose. To foster student understanding and engagement in a Prescriptive Analytics course that focuses on model building and model analysis, we restructured assignments around two key phases—Model Setup and Model Insights—and renamed them using a consistent structure—Model Setup and Model Insights—followed by a number (e.g., Model Setup 3, Model Insights 3). This format clarified each assignment’s stage in the modeling process without overwhelming students with overly complex titles.
Figure 1. The revised prescriptive analytics modeling format and goals emphasize the modeling process and are split into two submissions with interim instructor feedback.
To enhance student learning, we divided the homework assignments into two submissions with an interim instructor assessment. For instance, in one assignment where students had to match project managers to various projects, they first reviewed fictional emails presenting the problem, constraints, and necessary data. After completing their project’s initial setup, students received individualized instructor feedback that encouraged them to think critically about how they approached the problem and the assumptions they made before moving on to analyze their results. This opportunity for early intervention provided support, reduced confusion, and built students’ confidence to better prepare them for creating and running their spreadsheet models. Overall, this two-step approach fostered deeper thinking and engagement with the instructional material and interpreted the outcomes through additional questions and presentations.
To support student learning and prepare them for the graded modeling assignments, we introduced each module with a sequence of low-stakes, formative quizzes built around simplified case-based scenarios using business-style communication such as mock emails and voicemails. These activities helped students build familiarity with core modeling concepts and decision-making logic before tackling more complex tasks.
Graded modeling assignments were framed using business-style communications such as mock emails and memos to reinforce real-world relevance. For example, in Model 4, students received a series of emails outlining a realistic assignment problem, including objectives, constraints, and relevant data. Students submitted their Model 4 Setup individually and received instructor feedback before advancing to the Model 4 Insights phase, where they used Excel to build an optimization model, interpret the results, and respond to scenario-specific questions in a timed quiz. A short video presentation accompanied their submissions to explain their recommendations and rationale. Excel was selected as the modeling platform because it is freely accessible to our students and includes Solver functionality. This two-phase assignment format, supported by structured templates and clearly defined expectations, offered early guidance, encouraged iterative learning, and promoted deeper engagement with course concepts while supporting individual accountability.
The results were clear when comparing course participation before and after implementing the new approach. Submission rates for all modeling assignments increased by 18 percentage points. In addition to higher completion rates, students demonstrated measurable improvements in problem formulation, critical thinking, and communication skills. These changes aligned closely with the course learning outcomes and were reinforced through targeted quiz prompts and structured instructor feedback.
Most notably, engagement in the “new approach course” extended beyond basic requirements. While at least one sensitivity analysis was required, nearly half of the students voluntarily completed an additional, optional analysis. Given how difficult it can be to motivate students to complete even required coursework, this level of voluntary participation highlights the power of purposeful assignment design to drive deeper student investment.
Based on this redesign experience, we recommend several strategies for instructors and instructional designers aiming to create more engaging, authentic assignments. These include using purposeful titles, scaffolding complex tasks, framing assignments in real-world contexts, and integrating tools that support communication and feedback.
Table 1 provides an overview of these strategies and design recommendations:
Strategy
Example
Purpose
Descriptive Titles
“Model Setup 4” “Model Insights 4”
Clarifies the purpose and phase of work
Scaffolding
Two-part submissions with feedback
Reduces cognitive overload, reinforces learning
Real-World Framing
Case-based prompts, mock business emails
Builds relevance and engagement
Technology Integration
Spreadsheet model, video reflection
Supports student modeling practice, professional communication of a problem statement, solution approach, and recommendation with diverse student expression
By renaming assignments, scaffolding tasks, incorporating real-world scenarios, and integrating student-centered feedback mechanisms, we helped students move from performative task completion to meaningful, process-oriented learning. Our collaboration demonstrated that intentional course design, grounded in adult learning principles, can make assignments more than a grade. It can make them matter.
Most importantly, these strategies are highly transferable. While our work was rooted in a prescriptive analytics course, the principles of clear purpose, scaffolded structure, and authentic engagement can be applied across disciplines and modalities. Faculty and instructional designers can adapt these approaches for various disciplines in the humanities, sciences, or professional programs to support meaningful learning.
This redesign also reinforces the value of partnership between instructors and instructional designers. Through open collaboration, we combined disciplinary expertise with design thinking to create a learning experience that was more intentional, more engaging, and ultimately, more effective.
Salina Randall, MEd, is the Associate Director of the Center for Teaching, Learning, and Technology at the University of West Florida. She leads initiatives focused on instructional design, faculty development, and digital accessibility. With over a decade of experience in higher education, she supports faculty in designing inclusive, engaging, and data-informed learning experiences. Her work spans course design, accessibility compliance, and strategic communication, with a particular emphasis on empowering faculty through collaboration and practical solutions.
Dr. Julie Ann Stuart Williams is a Professor of Business Administration at the University of West Florida. Her research spans operations management and business education, with recent work focusing on improving business student writing and modeling-based learning. She has co-authored papers with students in journals such as the European Journal of Operational Research and Business and Professional Communication Quarterly. A recipient of UWF’s Faculty Excellence in Teaching Award, Dr. Williams also serves on the editorial board of INFORMS Transactions on Education and as 2nd Vice Chair of the INFORMS Committee on Teaching and Learning. She holds a Ph.D. in Industrial and Systems Engineering from Georgia Tech.
With the release of AI on a broad scale and the evolving procedural policies for policing and supporting its use in online higher education classrooms, instructor hesitancy to implement AI in ethical and effectual ways is shared by many. To emphasize, research indicates that curriculum designers and university stakeholders need to provide best-practice examples of how to utilize AI tools to effectively and positively promote the use of AI for students’ advantage (Deroncle-Acosta et al. 2024, 9). Clearly, AI offers many benefits as it can drive efficiency, creativity, and innovation. AI comes in various forms from generative AI to gamification to chatbots to adaptive learning platforms amidst other formats. Due to the sheer volume of AI options, pairing high-impact AI tools with highly desirable outcomes aids in the promotion and implementation of such usage in the online classroom.
Elevating Engagement
Engagement is an important factor driving retention in online classrooms; furthermore, dynamic environments capture the attention of students, ensuring greater dedication to learning. AI can considerably improve engagement in the classroom (A. Huang et al. 2023, 11). One way that online instructors can use AI in the classroom is to become a digital master and use generative AI, such as ChatGPT, to develop deeper content ideas or analyze student contributions within discussion (Mora and Semingson 2023, 57). Such tailored discussions add depth and rigor to courses, captivating students and bringing forth relevant and dynamic topics.
Furthermore, a second way to further improve engagement is through the development of AI developed feedback for formative assessments (Perry 2023, 78). Timely and personalized feedback plays an essential role in engaging students and motivating them (Wang and Lehman 2021, 571); AI can aid in streamlining and fast-tracking feedback. In deeply engaging students in an immersive and individualized way, students are more motivated to learn and more satisfied with educational outcomes.
Finally, while generative AI can offer just-in-time support to students, it also simulates a social presence, which is a “crucial component in technology-rich learning environments” (X. Huang et al. 2023, 396). Considered as a study companion, generative AI provides direct and immediate assistance and support, reducing anxiety and improving student motivation and psychological and personal contentment (Luan et al. 2024, 6). Ultimately, AI as a guide to both instructors and students can aid in boosting wholesale engagement in the online classroom.
Prompting Productivity
Another satisfactory outcome regarding the use of AI involves student productivity. Research notes, “By leveraging AI-driven solutions, students can streamline mundane tasks, optimize time management, and achieve higher levels of performance and academic excellence” (Capinding and Dumayas 2024, 647). With AI readily available to aid in the completion of so many activities, it behooves instructors to promote the ethical and practical use of applicable AI tools. For instance, a productivity tool for aiding in the completion of schoolwork is Quillbot, an AI tool on steroids; this one-stop-shop program paraphrases, translates, corrects grammar, and generates citations. Such a tool also ensures more accuracy in terms of performance.
Additionally, an entertaining and useful tool in maximizing time management is the gamified timer app called Forest. With this app, you grow a digital and real-tree forest based on the ability to focus on one’s work for extended clocked times, thus avoiding the distractions of one’s phone. While this may seem like a novel suggestion, its need for implementation is real and underused. In one study based on 106 college students with ADHD, achievement was negatively associated with the sound mode of cell phone; turning off the phone substantially improved accuracy and achievement in quantifiable ways (Albert et al 2023, 1192). Used wisely, AI can boost productivity for students, allowing students to earn higher grades while leaving them more time for the creativity and critical thinking required of top-performing students.
Incorporating Inclusivity
A final desired outcome associated with AI tools is the promotion of inclusivity and accessibility in the online classroom. More than 1 billion people across the world have disabilities and AI optimizes accessibility, inclusion, and equity, thus ensuring fairer access to educational information of all types (Nacheva 2025, 137). A top AI tool for accessibility is Otterai; this transcription service provides captions for recordings and videos. Transcriptions ease and enable learning for many students with disabilities. Likewise, translation AI tools, such as Quillbot or Google Translate, aid English Language Learner (ELL) students. Similarly, Seeing AI from Microsoft is a free app that identifies currency, objects, text, and people for people with visual impairments. Not only is AI valuable for students with disabilities, facilitators can also use it to enhance instruction regarding accessibility. For instance, AI can be used to create visuals for students. Canva has a Dream Lab feature that will generate images. Meeting the dual coding needs of students with audio-visual processing requirements can also improve accessibility while adding depth and engagement to one’s classroom. Using and offering ethical ways to use AI tools benefits student experiences while increasing the impact of instructors.
Conclusion
As instructors, we are curators of learning resources, and AI tools can aid student engagement, productivity, and accessibility. In promoting AI-driven options that enrich and improve student learning, we position students for success and teach them empowering ways to support their autonomous educational growth. AI stands for Artificial Intelligence, but with the right implementation, it can also stand for Adds Insight; Accelerates Improvements, and Assists Instruction.
Amy Winger is an online instructor for the University of Phoenix and American InterContinental University. She holds a BA in English from the University of Iowa and a MEd in English Education from the University of Minnesota. For over 19 years, she has taught English and general education courses and enjoys pioneering the use of tech tools. Prior to that, she taught English at the secondary level. Her academic research primarily focuses on retention strategies, technology tools, and social media implementation in the online classroom. She is also a freelance fiction writer.
References
Albert, Gila, Shimon Fridkin, and Or Delevski. 2023. “Mobile Phone Distraction and Its Effects on Academic Performance of Israeli College Students.” Israel Affairs 29 (6): 1181–99. doi:10.1080/13537121.2023.2257472.
Deroncele-Acosta, Angel, Omar Bellido-Valdiviezo, María de los Ángeles Sánchez-Trujillo, Madeleine Lourdes Palacios-Núñez, Hernán Rueda-Garcés, and José Gregorio Brito-Garcías. 2024. “Ten Essential Pillars in Artificial Intelligence for University Science Education: A Scoping Review.” SAGE Open 14 (3). https://research.ebsco.com/linkprocessor/plink?id=2ab6bfc4-e5ec-33d7-a5d5-d7a6f9747bfb.
Huang, Anna Y.Q., Owen H.T. Lu, and Stephen J.H. Yang. 2023. “Effects of Artificial Intelligence–Enabled Personalized Recommendations on Learners’ Learning Engagement, Motivation, and Outcomes in a Flipped Classroom.” Computers & Education 194 (March): N.PAG. doi:10.1016/j.compedu.2022.104684.
Huang, Xiaoshan, Alejandra Ruiz-Segura, Chengyi Tan, Tingting Wang, Robin Sharma, and Susanne P. Lajoie. 2023. “Social Presence in Technology-Rich Learning Environments: How Real We Are Feeling Connected and How Does It Matter for Learning?” Information & Learning Science 124 (11/12): 396–424. doi:10.1108/ILS-04-2023-0034.
Nacheva, Radka. 2025. “Analysis of AI Mobile Applications for Ensuring Digital Accessibility in Higher Education for People with Disabilities.” Acta Educationis Generalis 15 (1): 133–45. doi:10.2478/atd-2025-0009.
There’s something wonderfully postmodern about Edward Peck’s committee hearing ahead of his likely appointment as the next chair of the Office for Students.
While the first chair of the regulator, Michael Barber, arrived with a fully documented quasi-academic theory of delivery – and while the second, James Wharton, brought a certain kind of political cunning – Edward Peck has a fully fledged multi-disciplinary research-informed theory of leadership as performance.
How should we understand leadership as performance?
The idea of performativity – broadly speaking that the descriptive language we use in a given situation has a direct impact on the situation itself – has informed a conceptualisation of leadership as a performance that interrelates both with the wider ideas of what it is to be a leader and the narrower immediate context as a particular leadership “act”. This shifts the focus on leadership from a kind of all-powerful “strongman” (with the consequent cod-psychological popular literature on essential attributes of successful leaders available at an airport near you) to something more subtle around relationships, language, and behavior across multiple settings as shaping experiences of leadership.
Leaders – in other words – are sensemakers, both in terms of explaining (and thus shaping) reality for those around them, and in collaboratively situating activities carried out by an organisation within this negotiated reality. Sometimes these acts can be almost ritualistic (“is” performance) like in representing the university at a graduation ceremony where roles and norms are predetermined.
At other points these are more spontaneous (“as” performance) a narrative (a pre-existing conceptualisation of an experience or situation) enacted to an audience in response to an everyday stimulus – something like a discussion of university finances during a spontaneous conversation with a member of staff on campus).
Not an actual theatre
This isn’t a literal assertion that leadership is theatre – that it is a kind of scripted reality that lacks authenticity – but the idea that the actions of leaders reiterate (and thus endorse) organisational norms and organisational cultures. So when Peck repeatedly qualified his responses to the education committee with reference to what the OfS had learned in eight years of regulatory activity, and in his need to understand the way in which the legal framework in which regulation takes place has been interpreted he is situating himself as a part of an ongoing story rather than attempting to begin telling a new one.
This is likely to be important to those who might think a return to a HEFCE-like situation in which leaders were former vice chancellors and things were, apparently, nicer (they weren’t nicer, but this is the story some like to tell) – Peck is entering the stage in the middle of the play and is clearly looking to be an evolutionary rather than a revolutionary chair.
What he does seem to want to do, in narrative terms, is to use more of the language that institutional leaders themselves use within regulation. In Peck’s performativity theory – these linguistic shifts are important in that they themselves have an impact on the collective understanding of what is going on.
Usually about six
The best example of this was, inevitably, about university finances. To Peck there are “usually about six” things that universities do to balance income with expenditure in times of financial constriction – he didn’t name the six, but the impression he was looking to give is that these are well-known and familiar interventions among those who run universities. With this frame, he was able to put the onus on universities rather than regulators to act (“a lot of institutions are still on this journey”), allowing him the appeal to accepted wisdom in being clear that it was not for the Office for Students to bail out universities, and to go further to suggest that if there was a credible route to sustainable business it would be visible to banks (and, I guess, other lenders) and it should not be for the government to create a “moral hazard” by stepping in.
Committee member Manuela Perteghella pushed him on what he had specifically learned from what Nottingham Trent University had done to stave off financial problems (NTU ran a £9.5m surplus last year, but saw around a 10 per cent reduction in student numbers this year). The first example he reached for can again be traced back to the way he has written about leadership in the past – he made much of the need to “be clear with colleagues” about the problems that the university was facing and do so regularly and openly (there is a quarterly town hall meeting).
As a leader you do have the chance to control the narrative – and this shapes the way problems are understood. Peck noted the problems that other providers had faced in submitting unrealistic income or recruitment projections to the Office for Students – grand (if broad) plans that made any subsequent need for economy harder to sell internally. He was able to sell a 10 per cent reduction in staff numbers at NTU on the basis of needing less staff to teach less students (based on historical precedent) – and being clear about recruitment problems early allowed him to say that all these job losses would be voluntary.
The historical precedent – an appeal to a quantifiable and shared memory within the organisation – also made it easier to make the case for a lower staff headcount maintaining the quality of education. If, after all, we could teach this number of students at an acceptable level a few years back with this number of staff, why can’t it be done in 2025?
Independence day
One of the stories that has become accepted fact about the Office for Students is that it is too close to the government – reverse regulatory capture, if you like. The Behan report (and to a lesser extent the House of Lords Industry and Regulators Committee report) undermined this assumption a little – there are examples of places where OfS pushed back against the department, although the very nature of the beast means that such independence is rarely visible in public.
As chair Peck would clearly need to work with government on the underpinning policy framework – hinting at a “new” policy under development for release in the summer, most likely the much-heralded “HE reform” package – but emphasised that “operational” decisions would be independent, and that his network of contacts across the sector would help OfS build better relationships with institutions.
Again, this isn’t new – or even particularly notable – but it’s another pointer to his explanatory mode of leadership. It suggests that the problem is one of communication, and he even suggests his own ability to communicate as the solution. Virtuoso performance as leadership. When we get to the actual structural changes there’s a sense that OfS has been on the right track recently – revamped student panels, more student surveys. The only novelty is a promised re-engagement with NUS.
Curtain call
There’s a lot of stuff that would remain in a Peck-led OfS: he’s keen on B3 as driving value for money, keen to get stuck in on regulating modular provision, feel like we are in the right place on freedom of speech given recent changes, pleased with TEF and access and participation plan (though he asked a fascinating question around what happens to those who register with UCAS – he is interim chair there, currently – but are not placed by the end of the cycle).
For much of this, regulation is a matter of establishing codes of practice and ensuring that the actions of universities are within these bounds – Peck’s government work on student mental health should have provided the clue there. The codes themselves set the stage, the universities act within those boundaries. You could argue this as legalism, but it makes more sense as freedom within set parameters, something which universities (and indeed academics) will find comfortingly familiar.
In their 2009 book, “Performing Leadership” Peck and Helen Dickinson (now a professor at the University of New South Wales) cite one compelling example (an unpublished conference paper by Druckett from 2007) of the way the performance of a particular style of management has an impact on lived experience of university staff.
the case study… illustrates that the assertion, arguably the over-assertion, of the hierarchical and individualist ways of organising by senior management is generating negative feedback from the academics in the organisation. The consequences of not allowing the isolate and enclave approaches to contribute adequately to the organisational settlement may be having, or have in future, significant detrimental consequences for the university.
The classic postmodernist understanding of the organisation, in contrast, is one of multiple narratives within a common framework. If you feel that OfS has been too deterministic – too rules based rather than risk based – within the first eight years, the way in which Peck (and whoever he chooses as a senior executive team) allows other voices to fill the stage will be fascinating to watch.
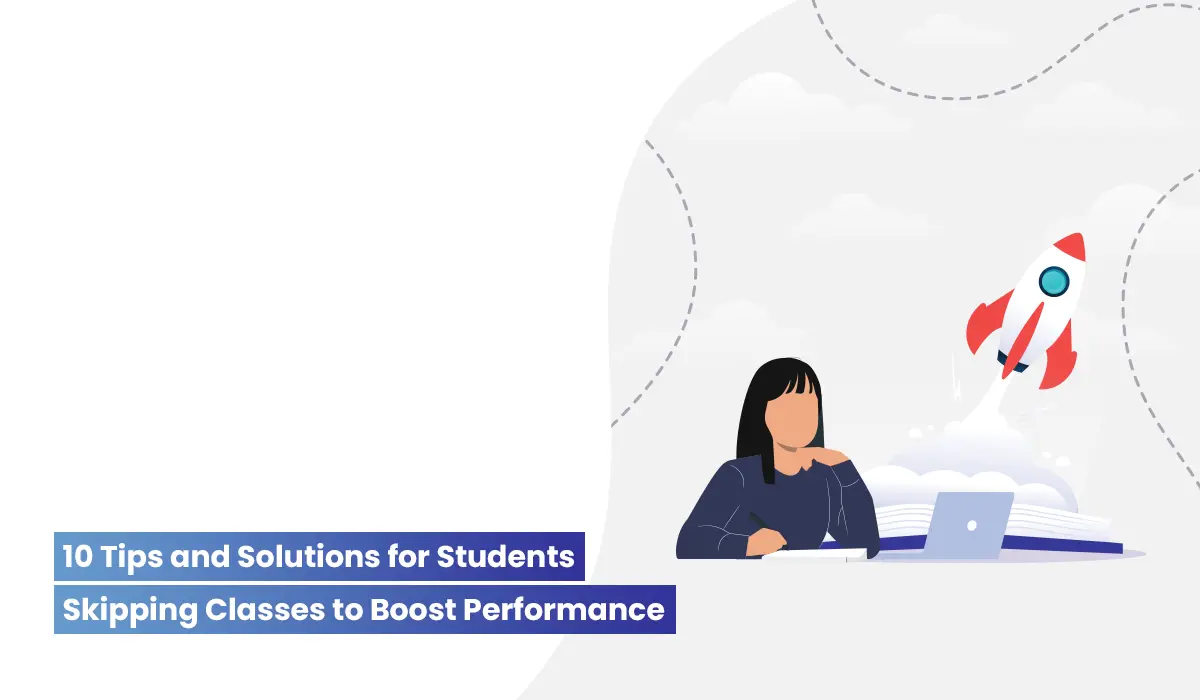
High education institutions and colleges are trying hard to suppress student skipping rates to boost performance and improve education standards. Management is trying hard to tackle truancy by imposing strict penalties on students skipping classes. Suspensions can only count as time missed from classroom instructions. Parents also face a blitz on attendance, and they are trying to keep students in higher education.
No more students skipping classes – try these out!
With nearly 25% of students admitting to skipping classes, we have churned out 10 sure-fire ways to tackle the issue behind students skipping classes. Easy to adopt, try these out for a result in a split-second.
Techniques to tackle students skipping classes
Monitor Attendance
This is practically the first and foremost way when trying to clock in to stop students from skipping classes. Monitoring attendance at high education is not new. Forget the days when faculty used to pass a piece of paper around the classroom to check attendance. It was ideally to support students who silently disengage. But trust us, of the hundreds of students attending lectures, 10-20% can even be missing without the lecturer realizing. Do not think of suspensions – for even they count as time missed from classroom instructions. Having an attendance policy in place works better! With electronic registrations, there can be a more structured attendance pattern. RFID-based attendance management system tracks unauthorized absence or lateness of higher education students in real-time. This will reduce the scenario of students skipping classes keep up-to-date records for all courses and improve student outcomes.
Track Discipline
When it comes to tackling the problem of chronic absenteeism, students who already have a track record of skipping class can be a particularly tough crowd to sway. So infectious they could be! The overall strategy for tackling such high education absenteeism should be to prioritize discipline. Getting into a friendly discussion helps. Figure out ways to help such students. Pool in mentors! Take complete ownership. Alternatively, manage and track behavior incidents of students using discipline software and generate automated reports for quicker decision-making.
Parent Communication
Get parents involved! This can be a way to reduce tardiness amidst such irregular students. Increased communication with parents will curb the notion of students skipping classes. Today, there are many parents connect software that provides real-time access to student’s academic information.
Manage Assessments
Another reason for students to skip classes could be their exam anxiety. If these classic signs of test uneasiness fill your classroom, attendance muddles will be there. Make assessments tension-free by creating online tests and assignments and sharing results with students and parents often. This will reduce the rising numbers of withdrawals from assessments and remove fears and inhibitions from students and parents.
Review of Curriculum
Hard to believe, but yes attendance truancy could be a result of the ill-fitting curriculum too. Teachers can review the curriculum and align the portfolio of courses to deliver quality learning for the institution. The curriculum management system provides student access to all the relevant course and curriculum data.
Smart Classrooms
Students feel aloof when teachers do not spend little or quality time with them. With smart classrooms paperwork gets eliminated, enabling teachers to spend quality time to improve teaching and learning.
Teacher Evaluations
Never neglect students who are chronically absent themselves – be all ears and resolve it at the earliest. This strategy works better! Analyze the teacher’s effectiveness in classrooms with a strong evaluation system and set performance goals to improve their skills. An ineffective faculty is but a drabby asset to the class. After all, it is they who matter the most in the classroom.
Role-based Security
The high education management system provides role-based authorization which facilitates discipline and eliminates privacy concerns of students. This information is protected and will be visible only to the targeted students or groups. Parents will be able to access and see the information about his or her children.
Event Management
Turn mundane days into gripping ones by scheduling events and announcements! With many departments and units, scheduling an event might seem like a task. Using an online calendar can be a lifesaver here. With such a calendar in place, make instant academic information available to students, teachers, parents, and alumni for specific purposes.
Automated Notifications
Don’t wait for the students to turn up the next day to notify them. Sending mass notifications with pre-built templates helps! Dish it out to students, teachers, staff, and parents via email, SMS alerts, and push notifications.
How Creatrix Campus Cloud Can Transform Your Institution and Simplify Student Life
Here’s a tip: Cloud and mobile technology can tackle regular and chronic absenteeism and benefit in many ways. They drastically result in increased attendance rate, improved student performance, reduced staff workload, and improved efficiencies of the institution.
Creatrix Campus offers the most advanced cloud and mobile-based cloud suite of solutions designed for higher education institutes. Adaptable, it easily integrates with other modules and provides secure access to track all your information in a single unified system.


