Tag: provider

  • UCAS End of Cycle, 2025: provider recruitment strategies

    UCAS End of Cycle, 2025: provider recruitment strategies

    On the face of it, running a successful recruitment round is fairly straightforward.

    It’s a bit like making a salad. Everything needs to look fresh and appetising, and you don’t want too much of one thing in case people don’t like it.

    I mean, it’s not rocket science.

    The provider level data from UCAS nicely illustrates the other, less straightforward end of the equation. We know surprisingly little about what applicants actually want to do, and where they want to do it.

    Sure, there’s near-certainties – medicine at UCL is unlikely to want for well-qualified applicants any time soon – but some things are rather less expected. Computing and IT focused courses, which have been growing in popularity for years, appear to have hit a wall. Is it the onset of generative AI “vibe coding” hitting employment prospects? Is it a change in the public perception of technology companies?

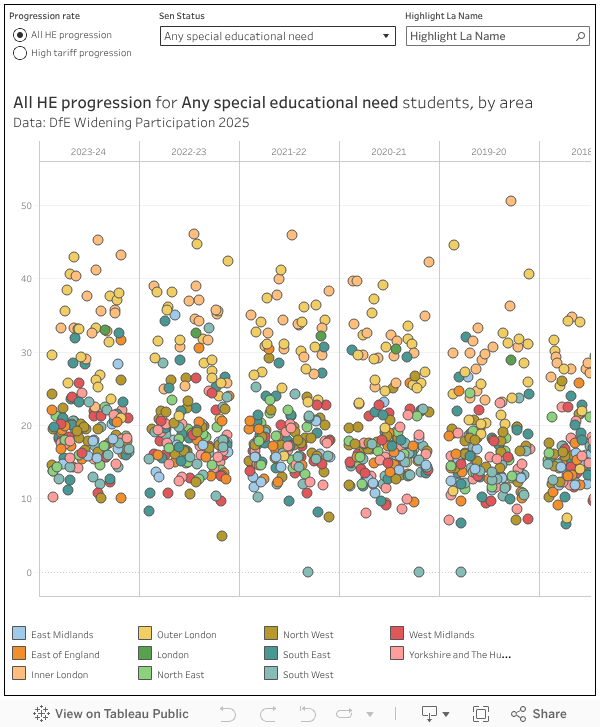
    We pretty much know it is affordability (and the slow atrophy of the student maintenance system) that prompts applicants from less advantaged socio-economic backgrounds to choose to study locally. But we don’t know why selective providers that have historically recruited nationally have decided en masse to move into this very specialised market, or what changes they have made to their standard teaching (and indeed offer-making) approach to make this work.

    It’s questions like these that make the insights available from this year’s UCAS End of Cycle data so fascinating, and the choice of data that is released so frustrating.

    The Russell Group ate my students!

    There’s been a lot of talk (and a lot of quite informed data driven evidence) to suggest that traditionally selective providers have been accepting students with uncharacteristically low grades in greater numbers than in previous years.

    A couple of unexpected new additional data tables shed a little more light. This last (2025) cycle saw selective (high tariff) providers recruit more students with 15 A level points or below than in any previous year – while medium tariff providers are doing less well in students with between 9 and 11 points than any year outside the pandemic, and low tariff providers had their worst year on record for between 10 and 12 points, and their worst year since the pandemic for between 8 and 6 points.

    [Full screen]

    A level points? Yes, for reasons best known to UCAS this is not the same as tariff points (so only includes A level performance, not vocational qualifications or grade 8 piano). You get 6 points for an A*, down to 1 point for an E – and only your best three A levels count. So 12 points means three Bs or thereabouts.

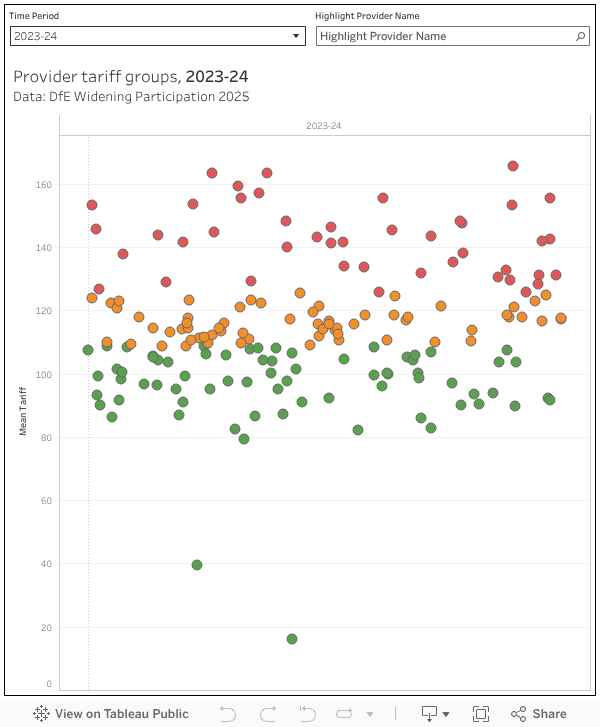
    The counter story is that this change in behavior hasn’t shifted the overall averages by that much. For high tariff providers the average accepted applicant has 13.9 A level points (down from 14 last year or 14.3 in 2016 – that’s round about AAB. Medium tariff is about BCC (10.4), Lower tariff is near enough CCC (9.4 – up very slightly on the historic average).

    [Full screen]

    Usually I’d suggest that this stasis is down to a regular recalculation of tariff groups – but I know that the last time UCAS allocated providers to groups was back in 2012. We’ve also never been told which providers are in which tariff group – this is a different split to the DfE or OfS variants, unhelpfully. And we don’t get data on A level (or tariff) points by provider, which would offer a much more helpful level of granularity to this point of sector-wide interest.

    A peep at provider strategies

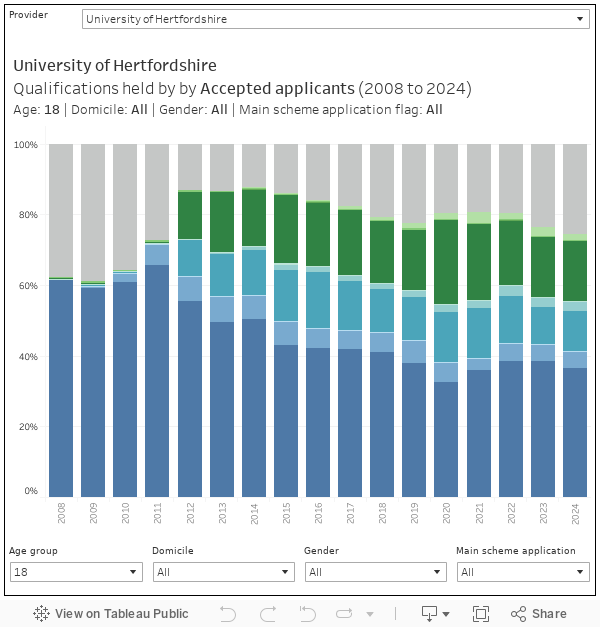
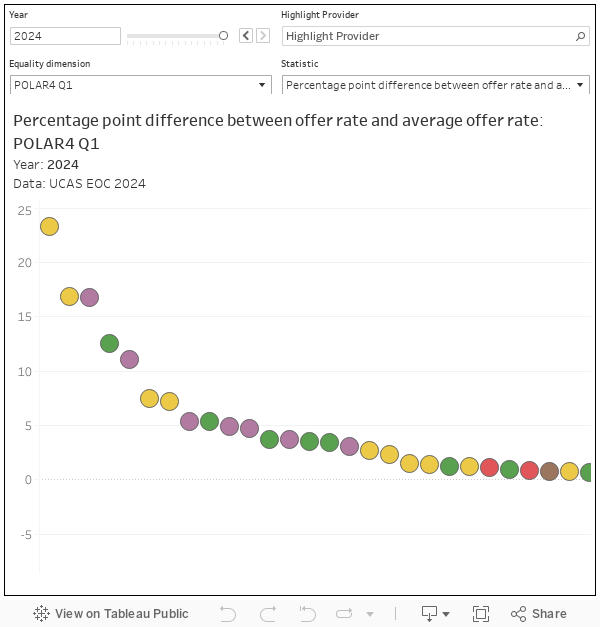
    There’s been a welcome update to the release of the provider level End of Cycle dataset: previously we used to get offermaking only within a rather vestigial dataset known as “equalities” – 2025 adds the offermaking data plus a range of new equalities parameters to the main provider level release.

    For all tariff bands or sector-level data is interesting, the increasing diversity of (and increasing competition within) the sector means that provider-level changes in behavior are by far the most interesting component of this release. The new information means that the chart that you lost your morning to last year is now looking very likely to make you lose your entire day.

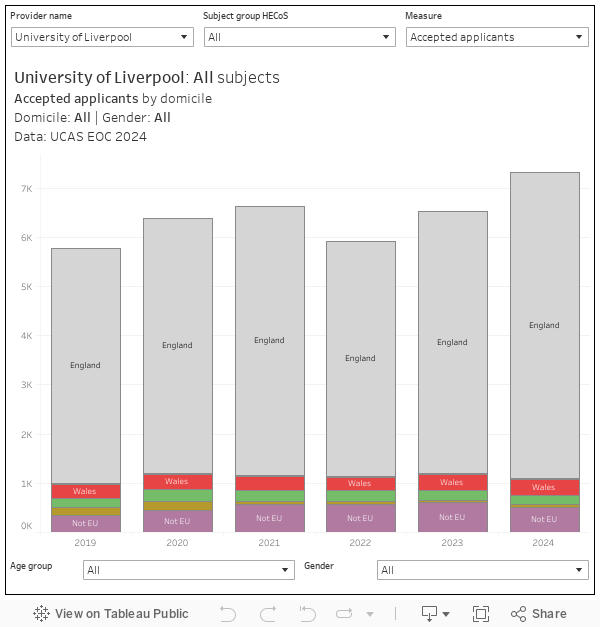
    This is a complex but powerful dashboard, which shows the difference between the most recent year (2025) of data and a comparator year you can choose (by default last year but you can choose any year since 2019) across two dimensions (you can choose from applications, offers, and accepted applicants for each). I’ve added filters by domicile (UK, international, or all) and subject group (the familiar top level – CAH1 – list).

    It’s a lot of data on one chart, so I’ve added a group filter, which by default removes some smaller providers from the display – and there’s a highlighter to help you find a provider of interest.

    A dot being further up or further right means that measure has grown between the comparator year and the current year, further down or further left means it has shrunk.

    [Full screen]

    There’s a nearly infinite number of stories to tell from this chart. Here’s some notable ones.

    Firstly Canterbury Christ Church University has accepted substantially fewer applicants in 2025 than in 2024. A dig around in the data suggests that decline is focused on UK domiciled applicants studying business subjects, which suggests to me that this shows the end of one or more franchise or partnership arrangements. I asked Canterbury Christ Church University for a comment – nothing yet but I’ll add it if it comes in – I’d imagine that this is the most visible of a wave of providers calculating that the increasing regulatory risk (with both OfS and DfE taking action) is not worth the hassle of running such provision – I’m tentatively pointing at Buckinghamshire New University and Oxford Brookes University as other similar (but smaller) examples).

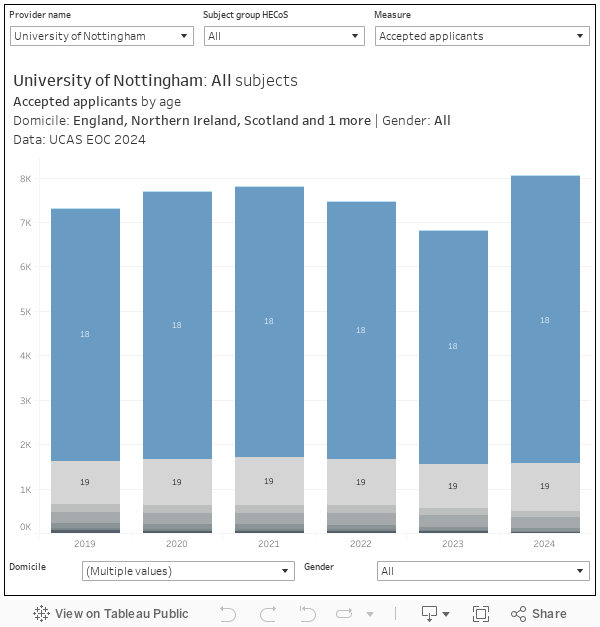
    Not all of the Russell Group is following the same recruitment strategy – there are instances (Nottingham, Glasgow, Cardiff) where fewer applicants have been accepted than in 2024. Some Russell Group providers (for example Leeds, York, Southampton, and Cardiff) have seen fewer applications than in previous years – the first three in that list have nevertheless increased acceptances over last year. Because we can now see the number of offers made using the filters at the top, it is apparent that the entire group (excepting Cardiff and Southampton) made more offers than last year.

    League leaders

    If you are playing along with the dashboard you’ll have spotted that University College London accepted nearly 2,500 more applicants than last year (after making a genuinely startling 12,000 more offers) . The majority of this increase (2,290 accepted applicants, 10,650 offers) related to international applicants – with growth in pretty much every subject area contributing to this performance.

    That’s not the largest growth in accepted applicants, however (it’s the second largest). For the league leaders, we look to the University of Wolverhampton – which accepted an impressive 3,625 extra applicants compared to last year. Unlike UCL, these are all UK-domiciled students, and nearly all (2,970) are studying business subjects. To me, this suggests a new partnership – I asked Wolverhampton about this, and am waiting to hear back.

    But who made the most offers in 2025? For international students, it’s UCL and it isn’t even close. But for home students it was the University of Exeter, which made 7,130 more UK domiciled offers this year than last year (a total of 37,515 offers in the 2025 cycle!) across a mix of subject areas. Exeter wasn’t able to get me a comment before publication – I’ll add one if it comes in later.

    And I did promise a look at computing recruitment. It is a decline in both applications and acceptances pretty much across the board – with the exception of an 800 student growth in accepted applicants at Bath Spa University. UCL did recruit 40 more students than last year, but this is against a 1,520 decline in applications. There’s still a bit of growth at the University of Manchester, and the University of York – but note also Escape Studios (a growing independent visual effects specialist that was once known as Pearson College, which delivers degrees validated by the Coventry University).

    School leavers

    I’ve also put together a version of this chart that shows only the recruitment of 18 year olds. The direct path between school or college and university is no longer the dominant one in the UK, and hasn’t been for some time – but in policymaking and political discussions it is still where minds tend to go.

    [Full screen]

    Focusing on UK 18 year olds, we can see that the University of Exeter has grown most spectacularly compared to last year on applications, offers, and acceptances. Large amounts of growth in this part of the market tends to be concentrated in more selective providers, but we can also see credible performances from big civic providers like Nottingham Trent University, Manchester Metropolitan University, and Liverpool John Moores University.

    Conversely we can see smaller but notable declines in applications and acceptances from providers including the University of the West of England, Birmingham City University, and the University of East London. The noticeable pattern is that there is no pattern – recruitment among school leavers can go cold anywhere at any time it would seem. And there are some ways around this – both the University of York (up 1,285) and the University of Leeds (up 3,180) upped school-leaver offer making despite a small decline in applications

    A sense of the sector

    Competition is clearly heating up. For those who have hit on a winning recruitment formula, the challenge becomes a need to ensure that every additional undergraduate gets the high quality experience they have been led to expect. An increase in fee income is almost all going to go to investment in capacity (be that more staff, retaining existing staff, or providing more resources). If your expansion has been into applicant groups you have little experience in teaching, the need to invest rises.

    Conversely, for those who have yet to hit upon the way to attract applications reliably there will already have been internal discussions about what needs to be done or what needs to change. Recruitment can and does figure in portfolio review and course revalidation questions: all of which comes down to whether a provider can afford to do what it would like to continue doing. Losing resources or capacity is a very last resort – once you wave goodbye to a course or department it is very difficult to spin back up.

    There will also be attention paid to sector trends – the kind of stuff I plotted back in December when we got the first phase of the End of Cycle release. Is it something your provider is doing, or a more general societal change, that means recruitment is growing or shrinking on a particular course. These are difficult, painful conversations, and need careful, considered, responses.

    Source link

  • Proposed Changes to Provider Pay Could Lead to Child Care Rate Hikes, Closures – The 74

    Proposed Changes to Provider Pay Could Lead to Child Care Rate Hikes, Closures – The 74


    Join our zero2eight Substack community for more discussion about the latest news in early care and education. Sign up now.

    For months now, Shannon Hampson has had August 1 etched in her mind. 

    That day marks an important shift for her and other early care and education providers in Nebraska who serve low-income families. On that date, the state intended to begin paying providers a consistent rate for families who use government subsidies to pay for child care. 

    Instead of reimbursing providers based on children’s attendance — which can vary wildly, especially this time of year, based on factors like illness and family travel — Nebraska would pay providers the same amount each month based on enrollment. 

    Last year, because of the change expected to come in summer 2026, Hampson, who owns a home-based child care program in Lincoln, Nebraska, felt comfortable filling more of her program slots with children whose families pay with subsidies. Today, she does not have one private-paying family. She made the shift assuming the enrollment-based pay would insulate her from the instability that often accompanies subsidy slots. 

    “I was super excited to know more of these families were going to get that quality, consistent care,” Hampson said, adding that reaching more low-income families is important in the field. “It’s not that providers don’t want to.”

    Now, though, that could all be about to change. 

    Nebraska’s transition to enrollment-based pay was part of an effort to get in compliance with a rule established by the Biden administration in 2024. Enrollment-based payments, that administration believed, would create greater predictability for providers, allowing them to serve more low-income families who need child care and, eventually, could entice more providers to participate in the subsidy program. 

    The rule was one of a handful of changes made by the prior administration related to the Child Care and Development Fund (CCDF), the primary federal program that states use to provide financial assistance to low-income families in need of child care. Other shifts include paying providers up front for child care, rather than reimbursing them the following month, and encouraging the use of grants and contracts with providers. State timelines for implementing these changes have varied. As of September 2025, 24 states were paying based on enrollment, according to an analysis by New America. For the others, the latest deadline granted was Aug. 1, 2026. 

    Just this week, however, the U.S. Department of Health and Human Services, through the Administration for Children and Families (ACF), announced that it would seek to rescind many of the 2024 rules, returning these issues to states. 

    The proposed changes cannot be enforced right away. Under federal law, the agency is required to take public comments, review them, and use that input to make final decisions, noted Alex Adams, who leads ACF. He declined to give a timeline for any changes to take effect.

    If approved, the changes would not “make any net new policy decisions,” he added. “It simply goes back to where we were prior to 2024 regulations.”

    The administration wants to rescind the 2024 rules, he said, because all 50 states had requested waivers related to some or all of these rules due to budget constraints and other implementation challenges. 

    “Any time 50 states are asking for a waiver from something,” Adams said, “it suggests to me that maybe the rule isn’t working as intended.”

    He also noted that “attendance-verified payment,” rather than enrollment-based, “is more of a deterrent to fraud.” Leaders in the Trump administration are concerned about programs with “phantom attendance” — suggesting they receive government payments but don’t actually serve the children they say they do — Adams said, but he declined to share specifics of ongoing investigations. 

    Many early care and education advocates and policy experts have expressed skepticism that rampant fraud and abuse is going unchecked. 

    Casey Peeks, senior director of early childhood policy at the Center for American Progress, a left-leaning think tank, called the allegations “unfounded” and worried that they would undo real progress made in the field in recent years. 

    “It is very unhelpful and destabilizing to the sector, in the immediate- and long-term, to take some of these most foundational levers we have to stabilize the sector and claim that they result in fraud,” Peeks said.

    Upon hearing the news this week, Hampson said she’s had to remind herself to “just breathe.” She knew she was taking a risk by enrolling 100% of families on subsidies.

    Now, she said, she will have to rearrange her budget to continue to serve all of those families. Under an attendance-based pay structure, her income is just that much more volatile.

    In December, for example, between holidays, vacation time and children’s absences, Hampson was only able to bill the state for 18 child care days. If the children in her program were from private-paying families, she would have been paid for 23 days, she said. 

    But Hampson’s operational costs didn’t see a material decrease in December. 

    “Without a provider being at fault at all, they could be at 50% attendance one day just because the flu is going around. That shouldn’t harm their bottom line,” Peeks said. 

    “It’s really unpredictable and unfair for the provider,” she added. “Just because attendance is down doesn’t mean operation costs go down.”

    In West Virginia, where providers have been paid based on enrollment since 2020, Katelyn Vandal emphasized how critical the change has been to keeping her rural, center-based program open. 

    “Our mortgage payment doesn’t cost less because two kids in the classroom have the flu,” noted Vandal, director of A Place to Grow, a child care center in Oak Hill, West Virginia. Nor does her electricity bill and a host of other overhead costs. 

    If her state returns to attendance-based pay, she’s not sure A Place to Grow would be able to continue operating. The center serves about 100 kids, with 60% from families that pay with subsidies. 

    “We run such a fine budget line anyway that if, six months from now, we were going back to attendance, we would be looking at closing,” she said. “We would not survive transitioning back to that.”

    Sheryl Hutzenbiler, owner of Munchkin Land Daycare in Billings, Montana, said she suspects that, under attendance-based pay, providers will either raise tuition rates on families — many of whom are already paying the maximum they can afford without one parent leaving the workforce — or, like Vandal, be forced to close their doors. 

    But that is not a decision Hutzenbiler will have to face, should the Trump administration successfully restore attendance-based pay. Since she lives in Montana, where enrollment-based pay became law in 2023, she and other providers in the state are protected from policy fluctuations at the federal level. 

    That’s true for a handful of states, which have either passed laws protecting enrollment-based pay or have continued paying based on enrollment, on a temporary basis, since the pandemic. (West Virginia is in the latter category.)

    Enrollment-based pay has been pivotal for Hutzenbiler, whose home-based program consists of about 60% of families who pay with subsidies. Back when she was paid based on attendance, she said her first sacrifice during low-attendance months would be her own wages. She would pay her full-time teacher first and make sure program costs were covered, often leaving nothing for herself and relying on her husband’s income instead. With the consistent subsidy income each month, though, she’s not only been able to avoid missed paychecks for herself, she’s been able to add two part-time workers to the payroll. 

    Hampson, in Nebraska, said she was part of a group last year advocating for the state to pass legislation around enrollment-based pay. It was ultimately unsuccessful.

    “We wanted to know our state had already said yes, so we wouldn’t go backwards,” she said. “And here we are going backwards.”

    In an industry where profit margins are estimated at less than 1%, these changes will inevitably leave providers who participate in the subsidy program with less revenue to survive on. The shifts will likely also deter providers who participate in the subsidy program, or who might have considered participating, from doing so in the future, said Peeks. This will likely, in effect, leave low-income families with fewer choices about where to go for child care. 

    “When you’re stabilizing providers overall, you’re often creating more options for families overall,” said Peeks. “I think it could definitely have a chilling effect.”


    Did you use this article in your work?

    We’d love to hear how The 74’s reporting is helping educators, researchers, and policymakers. Tell us how

    Source link

  • Podcast: AI and jobs, provider closure, UCAS figures

    Podcast: AI and jobs, provider closure, UCAS figures

    This week on the podcast we examine the challenges facing UK higher education as another tough academic year begins

    Source link

  • Just 329 students with an EHCP got to a high tariff provider last year

    Just 329 students with an EHCP got to a high tariff provider last year

    Everyone who can benefit from higher education deserves to do so. That’s pretty much what people remember the Robbins report as saying – and it is a comforting story that higher education likes to tell itself.

    But it doesn’t really hold true in the experiences of an increasingly diverse pool of potential applicants.

    The state of the art of supporting and regulating fair access to (and participation in) higher education in England has moved far beyond the (rather unsophisticated) idea of national targets and metrics. Like it or loathe it, the risk-based approach taken by the Office for Students is commendably grounded both in the experience of individual students and the academic literature.

    However a weakness of this approach is the temptation to argue that any access gaps represent a failure of higher education providers rather than taking a whole system (educational and, indeed socio-economic) perspective. When we do glance at wider problems with, say schools attainment it may not always be universities that are best placed (or adequately supported) to address them.

    And let us not be coy here – there are gaps:

    [Full screen]

    The chart shows progression rates to HE, either to all providers or “high tariff providers” (of which more later) for each year since 2009-10. The size of the dots represent the number of students in that population, the colours represent the groups of characteristics: you get everything from measures of economic disadvantage, to ethnicity, to disability and – new for this year – care experience. We are looking at the students that might usually be expected to enter HE that academic year (so the cohort that turned 18 the previous year – those who took a year out before university or who progress after resits will not be shown as progression to HE).

    SEN and EHCP

    There’s thousands of potential stories in this data – for this article I’m going to focus on special educational needs (SEN) as a factor influencing progression.

    As you can see from the chart 21.1 per cent of students with any special educational need progressed to higher education by the age of 19 in 2023-24. This is the highest on record, but before you break open the champagne we should add that the progression rate for their peers without SEN was more than 50 per cent. And for progression to high tariff providers the gap is even starker: 14.9 per cent without SEN, 3.8 with.

    Though a traditional image of a student with SEN may be of someone who is less academically able, there are many very academically inclined students who have SEN and are able to progress to any destination you can think of if they can access the right support. Support is not exactly easy to come by, and it is very much a lottery whether support is available to a particular child or not. Progression to any higher education setting by 19 was 25.4 per cent for those with SEN who had more generalised support, and just 9.4 for those who managed to get an education, health, and care plan (EHCP).

    Again, the experience of pupils with an EHCP may make it more likely that they apply later on (and thus not feature in their cohort data) – those who do progress often need to top up their level 2 or 3 qualifications before being able to progress to the next level of study, all of which takes time.

    But just 1.5 per cent of students with an EHCP, 327 students, progressed to a high tariff provider. To me, that’s a systemic failing.

    Regional dimensions

    More so than any other characteristic, where you live (and, more germanely, where you go to school) has a huge impact on your educational experience with SEN. In Kensington and Chelsea, 45.5 per cent of students with SEN are in HE by the age of 19. In Thurrock, the figure is more like 10 per cent.

    The variation is similar for all students – 71 per cent get to university in Redbridge, 26 per cent in Knowsley.

    [Full screen]

    But this core variation (which covers everything from socio-economic status to school quality to aspirations) is overlaid by the varying proportions of students with SEN in each area, and the varying levels (and quality) of the support that can be provided.

    [Full screen]

    Some 23.3 per cent of all students in Middlesbrough have a SEN marker. In Havering the figure is 8.85 per cent (there are some outliers with low numbers of students in total)

    What is being done?

    As Alex Grady of nasen wrote on the UCAS blog earlier this year, the many misconceptions around SEN indicating some form of “learning difficulty” that makes higher education irrelevant or impossible still persist. Students with SEN very often flourish at university, but the assumption that they will not attend higher education – so thinking around support through and beyond the transition between compulsory education and higher education often happens late or in a piecemeal fashion.

    It is comparatively rare for a university to visit a non-mainstream school, or vice-versa. There are many reasons (not least financial) for this not to happen, but there is a clear benefit to introducing students from all settings to a range of post-compulsory routes early and often. Sometimes special schools and other alternate provision partner with larger local schools to make this happen.

    Student records do not transition neatly between the compulsory sector and higher education, a situation not helped by the presumption that an EHCP extends to age 25 if you don’t go to university, but ends if they do (this, beautifully, is considered a “positive outcome”). A student may be used to assuming staff understand the best way to support them (as this is what happened at school) and feel uncomfortable or ill-equipped to effectively argue for similar support in HE.

    Universities do address this, both in highlighting the support that they offer students and in signposting what is available via the Disabled Students’ Allowance (many students with SEN do not identify themselves as “disabled”, and the variations in terminology are a recognised issue). But schools also have a role to play in preparing students for an application and choice experience that is pretty bewildering for all students.

    Additional data

    The DfE Widening Participation release is the only place where you get a definition of a “high tariff” provider – in 2023-24 this term referred to higher education providers with a mean tariff of 125.8 or above (last year this was 129.4).

    [Full screen]

    Source link

  • Podcast: AI and jobs, provider closure, UCAS figures

    Podcast: AI and jobs, provider closure, UCAS figures

    This week on our final podcast before the summer break, we unpack the mounting panic about graduate jobs – is AI really to blame, or are today’s students simply paying the price for a sluggish economy, a stalling skills strategy, and shifting recruitment practices?

    Plus we discuss new figures from UCAS that show a record number of 18-year-olds applying to university, and we look at a major new report on how provider closures are affecting students, and what the sector should do next to avoid chaos when courses collapse.

    With Hillary Gyebi-Ababio, Head of Public Affairs at Jisc, Hugh Jones, independent consultant and higher education postcard maestro, Michael Salmon, News Editor at Wonkhe, and presented by Jim Dickinson, Associate Editor at Wonkhe.

    UCAS applications and offer making by June deadline, 2025

    Student protection through market exit is not a compliance exercise

    Source link

  • Ignite Reading Again Approved as 1:1 High-Dosage Early Literacy Tutoring Provider in Massachusetts

    Ignite Reading Again Approved as 1:1 High-Dosage Early Literacy Tutoring Provider in Massachusetts

    BOSTON — Ignite Reading — a Science of Reading-based virtual tutoring program serving students in 18 states nationwide — today announced its approval by the Massachusetts Department of Elementary and Secondary Education (DESE) to continue providing 1:1 high-dosage evidence-based literacy tutoring to K-3 students across the commonwealth.

    Massachusetts Governor Maura Healey’s administration called on her state to invest heavily in high-dosage tutoring (HDT) earlier this year, earmarking $25 million in her state budget proposal to help accelerate literacy growth, “complementing the more systemic, long-term improvement work” being supported under the administration’s five-year literacy improvement campaign, Literacy Launch.

    In its approval process, DESE evaluated Ignite Reading’s services to Massachusetts districts over the past three school years and approved the literacy company to again provide school districts and charter schools with tutoring that is focused on building foundational skills — including phonological awareness, phonics knowledge and decoding skills — to help students become independent fluent readers in the early grades.

    Since Ignite Reading first gained DESE approval during the 2022-23 school year:

    • 30 Massachusetts schools and districts have partnered with Ignite Reading to provide students with 15 minutes of daily, 1:1 virtual tutoring.
    • Ignite Reading’s tutor educators have delivered differentiated, evidence-based early literacy instruction to more than 7,800 Massachusetts students.
    • Researchers at Johns Hopkins University’s Center for Research and Reform in Education have followed approximately 2,000 Massachusetts 1st graders enrolled in the program. The quasi-experimental study found the number of students reading on benchmark increased 213% after a year of Ignite Reading tutoring. At the same time, the percentage of students who required intensive reading intervention decreased 55%. All student groups — including Black and Hispanic students, those with IEPs and Multilingual Learners — had equitable skills growth, and those meeting end-of-year reading benchmarks grew more than 125%.

    The Healey-Driscoll Administration recently announced that schools and districts in Massachusetts are invited to apply for high-dosage early literacy tutoring for K-3 students with 1st grade as the state’s top priority.

    “When we get kids reading proficiently by the end of 1st grade, we set them up for a lifetime of academic success,” said Ignite Reading CEO Jessica Sliwerski. “Our continued approval by DESE means we can keep delivering the intensive, personalized support that Massachusetts 1st graders need to learn to read on grade level and on time. We are honored to be able to continue to partner with Massachusetts districts to ensure all students can access the tools they need to succeed as readers.”

    For more information about Ignite Reading’s Massachusetts partnerships, visit https://info.ignite-reading.com/massachusetts.

    About Ignite Reading

    Ignite Reading is on a mission to ensure every student can access the tools they need to be a confident, fluent reader by the end of 1st grade. School districts nationwide depend on Ignite Reading’s virtual tutoring program to deliver literacy support at scale for students who need help learning to read. Our highly trained tutors provide students with 1:1 tutoring in foundational literacy skills each school day, helping them go from learning to read to reading to learn.

    A recent study by the Center for Research and Reform in Education at Johns Hopkins University found that Ignite Reading students across demographics — including students who are English Learners, Black, Hispanic, and those with Individualized Education Programs (IEPs) — achieve the same outstanding gains of more than 5 months of additional learning during a single school year.  For more information about Ignite Reading, visit www.ignite-reading.com.

    eSchool News Staff
    Latest posts by eSchool News Staff (see all)

    Source link

  • Top Hat Named Courseware Solution Provider of the Year

    Top Hat Named Courseware Solution Provider of the Year

    Prestigious EdTech Breakthrough award highlights Top Hat’s leadership in delivering flexible, AI-powered courseware to support faculty and students.

    TORONTO – June 6, 2025  – Top Hat, the leader in student engagement solutions for higher education, has been named the 2025 Courseware Solution Provider of the Year. The annual EdTech Breakthrough Awards honor organizations that push the boundaries of educational technology—benefiting students, educators, and institutions across North America and around the world. In a global field of over 2,700 nominations, Top Hat stood out for its efforts to empower faculty to create and deliver engaging, connected, and affordable learning experiences for students.

    “Receiving this award is an honor and supports our belief that better student outcomes begin with the course itself,” said Maggie Leen, CEO of Top Hat. “We’re proud to support thousands of faculty with tools that make it easier to adopt proven teaching practices, and grateful to our team for the creativity and care they show everyday in making great learning experiences a reality for more students.”

    Now in its seventh year, the EdTech Breakthrough Awards have become a benchmark for excellence in educational technology. The program celebrates the industry’s most visionary companies—those dreaming bigger, innovating further, and setting new standards for enhancing the practice of teaching and learning. Top Hat’s selection reflects its track record of building solutions that drive measurable academic outcomes and dramatic improvements in student engagement, inside and outside the classroom. 

    Top Hat’s courseware platform gives instructors unprecedented flexibility to tailor content to their teaching goals. The platform integrates interactive assessments, multimedia, and AI-powered tools that allow educators to instantly create in-class questions and reflection prompts. This makes it easier than ever for instructors to apply evidence-based practices like active learning and low-stakes assessment. Students also benefit from AI-powered on-demand study support and unlimited practice questions rooted directly in course content. 

    Top Hat has a long-standing commitment to helping faculty adopt, adapt, or create modern, interactive course materials that improve engagement and comprehension while advancing institutional goals around student affordability and equity. By supporting the use of low- or no-cost learning materials—including customizable OpenStax and OER titles enriched with interactive features—Top Hat empowers educators to design meaningful learning experiences that reflect their unique pedagogical goals while reducing costs for students.

    About Top Hat

    As the leader in student engagement solutions for higher education, Top Hat enables educators to employ evidence-based teaching practices through interactive content, tools, and activities in in-person, online, and hybrid classroom environments. Thousands of faculty at 900 leading North American colleges and universities use Top Hat to create meaningful, engaging and accessible learning experiences for students before, during, and after class. To learn more, please visit tophat.com.

    Source link

  • Podcast: Regret, ABA, provider collapse

    Podcast: Regret, ABA, provider collapse

    This week on the podcast we discuss new research on student regret, as a report from the University of Bristol reveals that while two-thirds of current undergraduates are happy with their choice of degree, it drops to less than half among recent graduates. Are improved advice and guidance really the answer?

    Plus we look at the collapse of the Advanced Business Academy (ABA) and its aftermath, as an Office for Students (OfS) investigation uncovers serious concerns about student placements and course delivery. And we examine new research on widening participation “cold spots” and the stark disparities in teachers’ expectations for students based on geography and school ratings.

    With Mary Curnock Cook, non-executive in education and edtech, Pete Quinn, inclusion consultant, Mack Marshall, Community and Policy Officer at Wonkhe and presented by Jim Dickinson, Associate Editor at Wonkhe.

    XXXXX

    Hindsight is a wonderful thing – but foresight is better

    When tuition fee payments are suspended, what happens to students left behind?

    25 unanswered questions about the collapse of ABA

    The UPP Foundation is launching a new inquiry into widening participation to support the government’s opportunity mission

    Students can make a real difference to educational opportunity in their regions through tutoring

    Source link

  • UCAS End of Cycle provider data, 2024

    UCAS End of Cycle provider data, 2024

    Chat to anyone involved in sector admissions and you will hear a similar story.

    And the story appears to be true.

    It is now clear “high tariff” providers have been lowering their entry tariff (often substantially) in order to grow recruitment – meaning students with less-than-stellar grades have been ending up in prestigious institutions, and the kinds of places students like this would more usually attend have been struggling to recruit as a result.

    In other words, the 2024 looks a lot like a lockdown cycle (without the examnishambles and Zoom pub quizzes).

    Any major dude will tell you

    We noted, at a sector level, the rise in the number of offers made by high-tariff providers – it was the highest number on record. There was no parallel rise in A level attainment, which suggests a strategic decision, made early on, to widen access.

    Today’s release of UCAS End of Cycle data for 2024 at provider level illustrates that this picture is a generalisation. Some high-tariff providers have acted in the way described above, others have pursued alternative strategies. And other providers have hit on other ways to drive undergraduate recruitment.

    Starting with my favourite chart, we can think about these individual strategies in more detail. This scatter plot shows the year-on-year change in the number of applications along the horizontal axis and the year-on-year change in acceptances on the vertical. There’s filters for gender, domicile, age group and subject group (at the top level) – and I’ve provided a choice of comparator years if you want to look at changes over a longer term. The size of the dots represents the total recruitment by that provider in 2024, given the parameters we can see.

    [Full screen]

    In essence this illustrates popularity (among applicants) and selectivity. What we can see here for 2024 (defaulting to UK 18 year olds applying to all subjects compared to 2023) is that pretty much the entire Russell group has made significant (c500 or above) increases in recruitment, whether or not they saw a corresponding growth in applications.

    It’s not the full story – the picture for other pre-92 and post-92 providers is more mixed, with some providers able to leverage popularity (or desperation) to find growth.

    My old school

    We can’t look directly at provider behaviour by tariff, but we can examine what qualifications students placed at the provider have – here a key indicator might be an increase in the number of students entering without A levels (a group that tends to have lower tariffs overall).

    [Full screen]

    The trouble is, A level entry rates have also increased – pretty much anyone who wants to and can do A levels is now doing A levels. With the decline in BTEC popularity, and the still uncertain interest in T levels, this is to be expected. All this means most providers have seen an increase or steady state in the number of students entering with A levels (when you include that A level plus project options). In Scotland – and recall we don’t get the complete picture of Scottish applications from UCAS because of a wonderful little thing called intercalation – it’s SQA pretty much all the way.

    Everything you did

    If you are wondering whether a change in age groups placed as undergraduates could also have an impact on recruitment patterns, it looks as if the pattern of low and slowly falling mature recruitment continues for most providers. For larger universities most of the action is around 18 year old home recruitment – and specialist providers that focus on mature students (often via part-time or flexible study) tend to struggle.

    [Full screen]

    The other key factor is domicile – the changes to visa arrangements this time last year had a huge impact on international applications (particularly from countries like India and Nigeria that have become important for lower tariff providers) and coupled with some of the changes described above this has resulted in some providers seeing undergraduate international admissions fall off a cliff.

    [Full screen]

    As always, undergraduate isn’t the full story – we’ve still no reliable way of understanding postgraduate recruitment in the round until we get the HESA data long after the academic year in question has finished. I just hope that regulators with new duties to understand the financial stability of the sector have more of a clue.

    Any world that I’m welcome to

    With some providers stuffed to the seams and beyond with students they wouldn’t usually accept – many with support needs it is unclear whether they are able to meet – it is unclear who exactly benefits from this new state of affairs. The claim we regularly hear is that universities lose money on educating home students, and that these must be cross subsidised by international recruitment.

    The corollary of this is that in times where international student recruitment is restricted you would expect to see the number of home students at providers reliant on this income fall – after all, if you lose money on every home student the more you recruit the more money you lose. Though measures to widen access and participation are important (and indeed, we see welcome evidence of contextual admissions at selective providers in the chart below) the fact of it is that you need to spend money to support students without the cultural capital to succeed.

    [Full screen]

    The rather painful conclusion I reach is that the only way to make this year’s sums add up is a reduction in spend per student – and, thus, most likely, the quality of the student experience among precisely the students who would have been overjoyed to get a place at a famous university. We should keep a close eye on continuation metrics and the national student survey this year.

    Source link