What is public scholarship? And, if it’s something you value as an academic, how do you house the resources you want to share online? Dr. Ben Railton and Dr. Vaughn Joy are featured in this episode of The Social Academic podcast. Jennifer van Alstyne asks them about their just-launched public website collaboration, Black and White and Read All Over.
Who do you hope visits your website? How do you hope they engage with what you share with them? When this married couple wanted a permanent space for their public scholarship, they chose to create it together. A special thank you to Dr. Walter Greason for sharing #ScholarSunday would make for a great podcast episode! I’m delighted to have these two on the show for you just in time for the launch of their new website. Congratulations!
This episode was broadcast live on September 29, 2025.
This episode will be available on Spotify soon. English captions for the video and a full text transcription will be added for you in the next 1-2 weeks. Thank you.
Bios

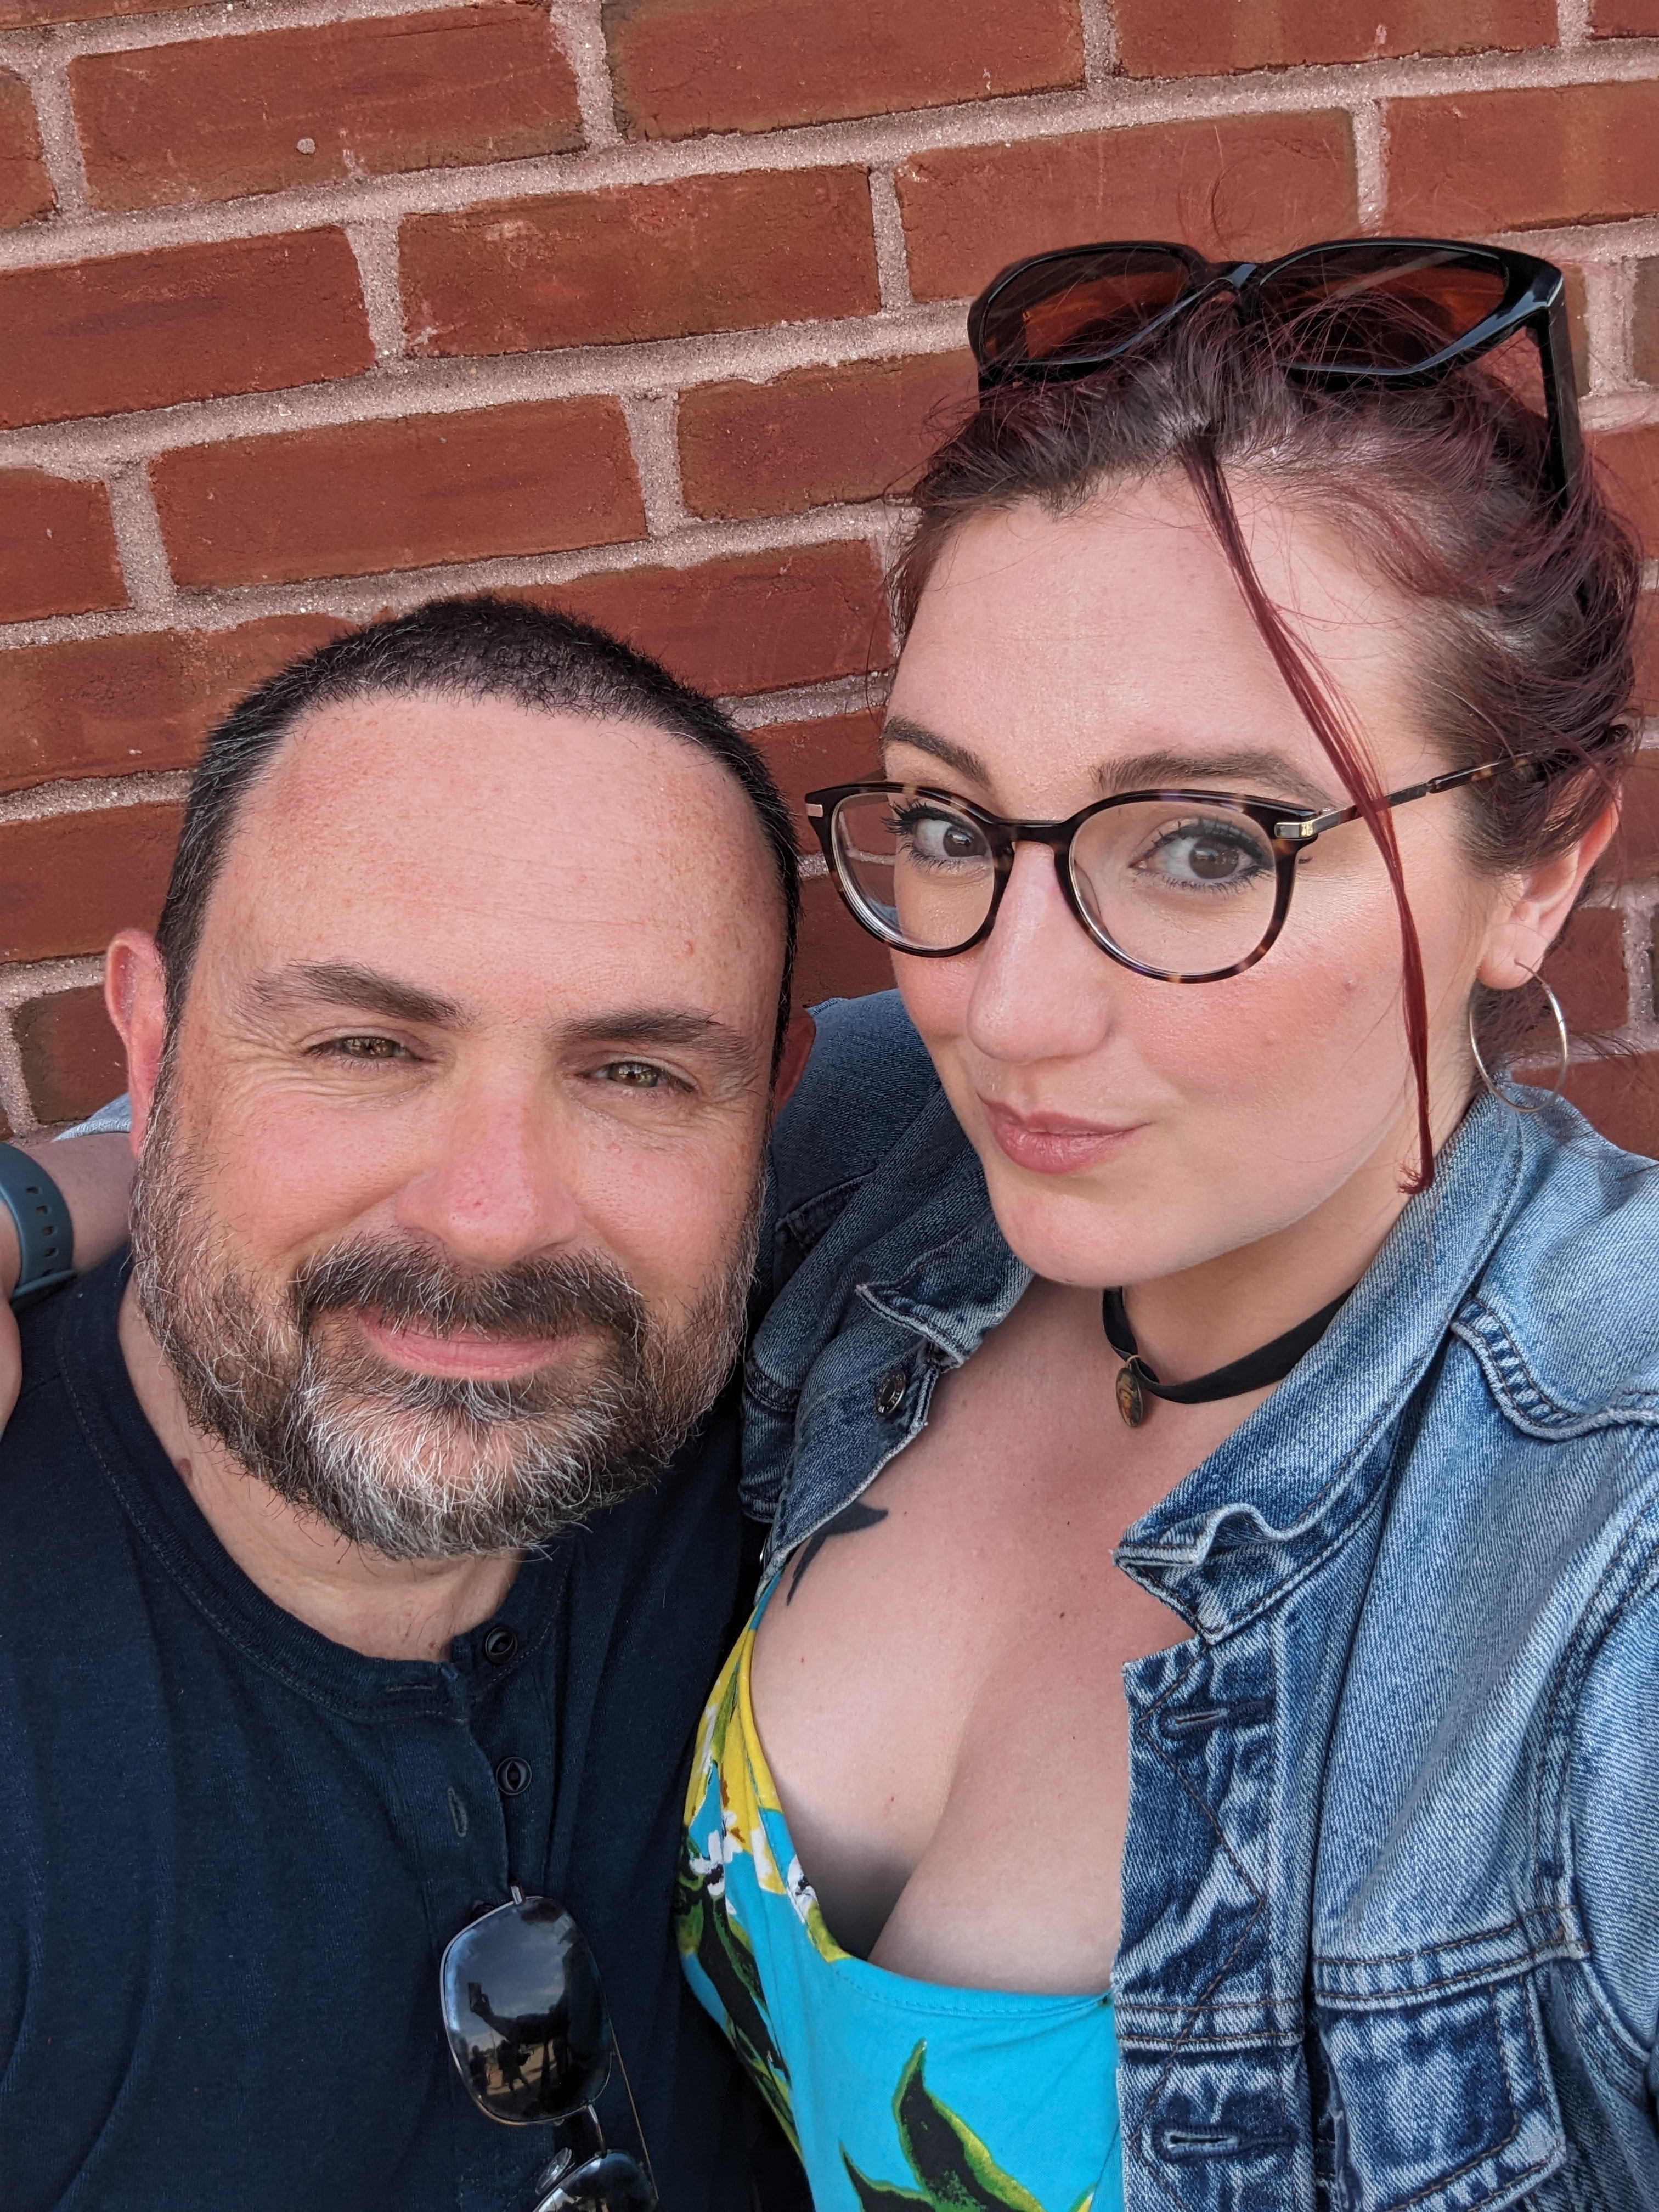
Dr. Ben Railton
Ben Railton is Professor of English Studies, Director of Graduate English, and Coordinator of American Studies at Fitchburg State University. He’s the author of six books, most recently Of Thee I Sing: The Contested History of American Patriotism (2021). He also contributes the bimonthly Considering History column to the Saturday Evening Post. He’s most proud to be Dad to two college student sons, Aidan and Kyle; and husband to his badass wife and website co-host Vaughn.
Dr. Vaughn Joy
Vaughn Joy is an independent researcher and recent graduate with a PhD in History from University College London. Her first book, Selling Out Santa: Hollywood Christmas Films in the Age of McCarthy, explores how Hollywood manipulated the American Christmas holiday for socially conservative ends in the post-war, early Cold War period in response to federal pressures on the motion picture industry. Her other work concerns McCarthyism, Hollywood business practices and politics, and media literacy of pop culture.

Black and White and Read All Over
Ben and Vaughn have recently launched a shared website that hosts Ben’s daily AmericanStudier blog and weekly round up of public scholarship in his #ScholarSunday threads, as well as Vaughn’s weekly film review newsletter, Review Roulette.
The site, called Black and White and Read All Over, also welcomes announcements from other scholars to share their achievements, upcoming events, and forthcoming publications to promote academic pride and joy in our community.