New research from Wake Forest University shows that boosting a student’s sense of belonging in college can significantly increase their likelihood of earning a degree.
The findings draw on nationally representative survey data from more than 21,000 undergraduates enrolled in two- and four-year colleges across the country.
The survey measured belonging by asking students to rate their agreement with the statement “I feel that I am a part of [school]” on a five-point scale, where 1 means strongly disagree and 5 means strongly agree.
Students who rated their sense of belonging in their second year one step higher on the five-point scale than they did in their first year—such as moving from neutral to agree—were 3.4 percentage points more likely to graduate within four years.
That pattern held over time: Each one-step increase in a student’s reported sense of belonging was linked to a 2.7-percentage-point higher likelihood of earning a degree within six years.
“What stood out to me was just how consistent the findings were,” said Shannon Brady, a Wake Forest University psychology professor and the study’s author. “We’re seeing this relationship hold across different kinds of students and institutions.”
Students in the study began college during the 2011–12 academic year, and their graduation outcomes were measured four and six years later. That’s the most recent nationally representative data available, Brady explained.
She said the findings send a clear message that fostering a sense of belonging is vital on campus, and that its impact on persistence and graduation rivals the effect of thousands of dollars in additional financial aid.
“One of the things that’s nice about belonging is that it doesn’t have to cost a lot,” Brady said, adding that intentional support—such as structuring first-year seminars or addressing hurdles in registering for classes—can make a meaningful difference in creating a sense of belonging with relatively few resources.
“It takes attention, and it takes people doing the work to make it happen,” she said.
The findings: The study identified two statistically significant differences in how belonging related to graduation outcomes for specific student groups.
The link between belonging and four-year graduation rates was stronger for students whose parents had attended college than for first-generation students. The report suggests this gap may be due to first-generation students being more likely to “face structural and psychological challenges that may, at times, weaken the benefits of belonging.”
“These challenges can take many forms,” the report said, including limited guidance in navigating college systems, financial pressures that compete with academic engagement and systemic cultural mismatches between institutional and home environments.
Belonging also had a weaker connection to six-year graduation rates for Asian students compared to non-Asian students. The report attributes this, in part, to the fact that Asian students are more likely to have “alternative supports that promote academic persistence.”
Those supports can include family expectations that emphasize educational achievement, peer networks with strong academic norms and cultural orientations that prioritize sustained effort over socio-emotional connection to an institution.
The authors caution that the broad “Asian” category includes considerable diversity across countries and regions of origin, generation status, and socioeconomic background; such diversity shapes both students’ access to support and their experiences of belonging and credential attainment.
The implications: Brady pointed to the City University of New York’s Accelerated Study in Associate Programs as a “fantastic” model for fostering student belonging.
The ASAP program works to remove everyday barriers, such as transportation costs, complicated scheduling and limited advising, and has been shown to improve graduation rates while also helping students feel connected to their campus.
“If you can’t get the classes you need, it’s hard to feel connected to school,” Brady said. “And if transportation is complicated—if you’re dependent on buses or rides from friends because you can’t afford a bus pass—it’s hard to build the relationships you want.”
Beyond individual programs, Brady recommended institutions adopt a standardized measure of student belonging across campuses.
“Almost no cross-institution conversation happens on this because the measures that schools are using are different,” she said. “You can’t aggregate knowledge as well as we might if we had a more standardized measure.”
Ultimately, Brady said, colleges have a responsibility to create environments where students feel they belong.
“I don’t want to suggest that belonging is always inherently a good thing, but we want to create institutions where it is reasonable and positive to build a connection to them,” she said.
Get more content like this directly to your inbox. Subscribe here.
Sense of belonging is a significant predictor of student retention and completion in higher education; students who believe they belong are more likely to bounce back from obstacles, take advantage of campus resources and remain enrolled.
For community colleges, instilling a sense of belonging among students can be challenging, since students often juggle competing priorities, including working full-time, taking care of family members and commuting to and from campus.
To help improve retention rates, the California Community Colleges replicated a belonging intervention developed at Indiana University’s Equity Accelerator and the College Transition Collaborative.
Data showed the intervention not only increased students’ academic outcomes, but it also helped close some equity gaps for low-income students and those from historically marginalized backgrounds.
What’s the need: Community college students are less involved on campus than their four-year peers; they’re also less likely to say they’re aware of or have used campus resources, according to survey data from Inside Higher Ed.
This isolation isn’t desired; a recent survey by the ed-tech group EAB found that 42 percent of community college students said their social life was a top disappointment. A similar number said they were disappointed they didn’t make friends or meet new people.
Methodology
Six colleges in the California Community Colleges system participated in the study, for a total of 1,160 students—578 in the belonging program and 582 in a control group. Students completed the program during the summer or at the start of the term and then filled out a survey at the end.
Moorpark Community College elected to deliver the belonging intervention during first-semester math and English courses to ensure all students could benefit.
How it works: The Social Belonging for College Students intervention has three components:
First, students analyze survey data from peers at their college, which shows that many others also worry about their academic success, experience loneliness or face additional challenges, to help normalize anxieties about college.
Then, students read testimonies from other students about their initial concerns starting college and how they overcame the challenges.
Finally, students write reflections of their own transition to college and offer advice to future students about how to overcome these concerns or reassure them that these feelings are normal.
The goal of the exercise is to achieve a psychological outcome called “saying is believing,” said Oleg Bespalov, dean of institutional effectiveness and marketing at Moorpark Community College, part of the Ventura Community College District in California.
“If you’ve ever worked in sales, like, say I worked at Toyota. I might not like Toyota; I just really need a job,” Bespalov said. “But the more I sell the Toyota, the more I come to believe that Toyota is a great car.” In the same way, while a student might not think they can succeed in college, expressing that belief to someone else can change their behaviors.
Without the intervention, students tend to spiral, seeing a poor grade as a reflection of themselves and their capabilities. They may believe they’re the only ones who are struggling, Bespalov said. Following the intervention, students are more likely to embrace the idea that everyone fails sometimes and that they can rebound from the experience.
At Moorpark, the Social Belonging for College Students intervention is paired with teaching on the growth mindset, explained Tracy Tennenhouse, English instructor and writing center co-coordinator.
“Belonging is a mindset,” Bespalov said. “You have to believe that you belong here, and you have to convince the student to change their mindset about that.”
The results: Students who participated in the belonging program were more likely to re-enroll for the next term, compared to their peers in the control group. This was especially true for students with high financial need or those from racial minorities.
In the control group, there was a 14-percentage-point gap between low- and high-income students’ probability of re-enrolling. After the intervention, the re-enrollment gap dropped to six percentage points.
Similarly, low-income students who participated in the intervention had a GPA that was 0.21 points higher than their peers who did not. Black students who participated in the exercise saw average gains of 0.46 points in their weighted GPA.
To researchers, the results suggest that students from underrepresented backgrounds had more positive experiences at the end of the fall term if they completed the belonging activity. Intervention participants from these groups also reported fewer identity-related concerns and better mental and physical health, compared to their peers who didn’t participate.
What’s next: Based on the positive findings, Moorpark campus leaders plan to continue delivering the intervention in future semesters. Tennenhouse sees an opportunity to utilize the reflection as a handwritten writing sample for English courses, making the assignment both a line of defense against AI plagiarism and an effective measure for promoting student belonging.
Administrators have also considered delivering the intervention during summer bridge programs to support students earlier in their transition, or as a required assignment for online learners who do not meet synchronously.
In addition, Tennenhouse would like to see more faculty share their own failure stories. Research shows students are more likely to feel connected to instructors who open up about their own lives with students.
How does your college campus encourage feelings of belonging in the classroom? Tell us more here.
Rating colleges against each other is a tricky enterprise on a good day. For community colleges it’s particularly vexed, given how intensely local they are and the simple fact that most of them don’t compete with each other. If, say, a community college in Illinois or Arizona does something terrific, I don’t feel threatened by it; our students in Pennsylvania aren’t going to move there in large numbers based on ratings.
Still, the lure of lists is powerful. The new Carnegie classifications, as outlined by Inside Higher Ed, rate community colleges largely by the subsequent earnings of their students compared to local labor markets. The article outlines one key objection based on economic geography: In some parts of the country, the median wages and cost of living are so high that even students coming out of very successful vocational programs will struggle economically at first.
It’s similar to the objection I noted a few years ago to the “social mobility” ratings that Washington Monthly offered, in which colleges were graded based on how many quartiles of income their students jumped. To score really well on that metric, you’d better have most of your students start in the bottom quartile. A college located in an area with more students in the second quartile simply couldn’t compete, no matter how well it did its job.
The measurement error in this case is more well-meaning than in many others, but it’s still an error. And I’m still unconvinced that it adequately captures the value of students who transfer, whether with a degree or just with a bunch of classes.
Presumably, those objections could be incorporated into a more refined effort. But even the objections implicitly concede that the only relevant scale on which to measure education is income. Postcollege income matters, of course, but it’s not the only thing that matters. If it were, we would stop training early-childhood teachers and social workers immediately.
Part of the attraction of measuring income is that it’s quantifiable. Even I sometimes get twitchy when academics refer to the “ineffable” benefits of something; it can be hard to disentangle idealism from wishful thinking. But some noneconomic benefits of higher education are relatively easy to quantify in the short term.
What if we measured colleges on the voting rates of new graduates?
Voting is quantifiable, at least for now. It’s a basic form of adult civic engagement. It doesn’t rely on economic cycles that can wreak havoc with starting salaries. And we know from decades of political science that on average, people who vote are more knowledgeable about politics and social issues than people who don’t. (Contrary to popular myth, people who consistently vote a party line are more informed on average than ticket-splitters, but that’s another article.)
Voting rates also wouldn’t be distorted by the low earnings of students who transferred and are in their junior or senior years of college when surveyed. Yes, voting rates are higher in presidential years, but presidential years happen at the same time for every college in the country, so they wouldn’t affect comparisons between institutions.
If we took postgraduation voting rates seriously, colleges would be incentivized to improve the civic literacy and involvement of their students. That strikes me as an excellent outcome. That’s especially true for community colleges, given that their student bodies are much more representative of America than the elite selective universities.
Community colleges train, yes, but they also educate. Why not educate for democracy? And why not support—with funding and publicity—the colleges that do a particularly good job of that?
The key goal of any administered national survey is for it to be representative.
That is, the objective is to gather data from a section of the population of interest in a country (a sample), which then enables the production of statistics that accurately reflect the picture among that population. If this is not the case, the statistic from the sample is said to be inaccurate or biased.
A consistent pattern that has emerged both nationally and internationally in recent decades has been the declining levels of participation in surveys. In the UK, this trend has become particularly evident since the Covid-19 pandemic, leading to concerns regarding the accuracy of statistics reported from a sample.
A survey
Much of the focus in the media has been on the falling response rates to the Labour Force Survey and the consequences of this on the ability to publish key economic statistics (hence their temporary suspension). Furthermore, as the recent Office for Statistics Regulation report on the UK statistical system has illustrated, many of our national surveys are experiencing similar issues in relation to response rates.
Relative to other collections, the Graduate Outcomes survey continues to achieve a high response rate. Among the UK-domiciled population, the response rate was 47 per cent for the 2022-23 cohort (once partial responses are excluded). However, this is six percentage points lower than what we saw in 2018-19.
We recognise the importance to our users of being able to produce statistics at sub-group level and thus the need for high response rates. For example, the data may be used to support equality of opportunity monitoring, regulatory work and understand course outcomes to inform student choice.
We also need, on behalf of everyone who uses Graduate Outcomes data, to think about the potential impact of an ongoing pattern of declining response rates on the accuracy of key survey statistics.
Setting the context
To understand why we might see inaccurate estimates in Graduate Outcomes, it’s helpful to take a broader view of survey collection processes.
It will often be the case that a small proportion of the population will be selected to take part in a survey. For instance, in the Labour Force Survey, the inclusion of residents north of the Caledonian Canal in the sample to be surveyed is based on a telephone directory. This means, of course, that those not in the directory will not form part of the sample. If these individuals have very different labour market outcomes to those that do sit in the directory, their exclusion could mean that estimates from the sample do not accurately reflect the wider population. They would therefore be inaccurate or biased. However, this cause of bias cannot arise in Graduate Outcomes, which is sent to nearly all those who qualify in a particular year.
Where the Labour Force Survey and Graduate Outcomes are similar is that submitting answers to the questionnaire is optional. So, if the activities in the labour market of those who do choose to take part are distinct from those who do not respond, there is again a risk of the final survey estimates not accurately representing the situation within the wider population.
Simply increasing response rates will not necessarily reduce the extent of inaccuracy or bias that emerges. For instance, a survey could achieve a response rate of 80 per cent, but if it does not capture any unemployed individuals (even when it is well known that there are unemployed people in the population), the labour market statistics will be less representative than a sample based on a 40 per cent response rate that captures those in and out of work. Indeed, the academic literature also highlights that there is no clear association between response rates and bias.
It was the potential for bias to arise from non-response that prompted us to commission the Institute for Social and Economic Research back in 2021 to examine whether weighting needed to be applied. Their approach to this was as follows. Firstly, it was recognised that for any given cohort, it is possible that the final sample composition could have been different had the survey been run again (holding all else fixed). The sole cause of this would be a change in the group of graduates who choose not to respond. As Graduate Outcomes invites almost all qualifiers to participate, this variation cannot be due to the sample randomly chosen to be surveyed being different from the outset if the process were to be repeated – as might be the case in other survey collections.
The consequence of this is that we need to be aware that a repetition of the collection process for any given cohort could lead to different statistics being generated. Prior to weighting, the researchers therefore created intervals – including at provider level – for the key survey estimate (the proportion in highly skilled employment and/or further study) which were highly likely to contain the true (but unknown) value among the wider population. They then evaluated whether weighted estimates sat within these intervals and concluded that if they did, there was zero bias. Indeed, this was what they found in the majority of cases, leading to them stating that there was no evidence of substantial non-response bias in Graduate Outcomes.
What would be the impact of lower response rates on statistics from Graduate Outcomes?
We are not the only agency running a survey that has examined this question. Other organisations administering surveys have also explored this matter too. For instance, the Scottish Crime and Justice Survey (SCJS) has historically had a target response rate of 68 per cent (in Graduate Outcomes, our target has been to reach a response rate of 60 per cent for UK-domiciled individuals). In SCJS, this goal was never achieved, leading to a piece of research being conducted to explore what would happen if lower response rates were accepted.
SCJS relies on face-to-face interviews, with a certain fraction of the non-responding sample being reissued to different interviewers in the latter stages of the collection process to boost response rates. For their analysis, they looked at how estimates would change had they not reissued the survey (which tended to increase response rates by around 8-9 percentage points). They found that choosing not to reissue the survey would not make any material difference to key survey statistics.
Graduate Outcomes data is collected across four waves from December to November, with each collection period covering approximately 90 days. During this time, individuals have the option to respond either online or by telephone. Using the 2022-23 collection, we generated samples that would lead to response rates of 45 per cent, 40 per cent and 35 per cent among the UK-domiciled population by assuming the survey period was shorter than 90 days. Similar to the methodology for SCJS therefore, we looked at what would have happened to our estimates had we altered the later stages of the collection process.
From this point, our methodology was similar to that deployed by the Institute for Social and Economic Research. For the full sample we achieved (i.e. based on response rate of 47 per cent), we began by generating intervals at provider level for the proportion in highly skilled employment and/or further study. We then examined whether the statistic observed at a response rate of 45 per cent, 40 per cent and 35 per cent sat within this interval. If it did, our conclusion was there was no material difference in the estimates.
Among the 271 providers in our dataset, we found that, at a 45 per cent response rate, only one provider had an estimate that fell outside the intervals created based on the full sample. This figure rose to 10 (encompassing 4 per cent of providers) at a 40 per cent response rate and 25 (representing 9 per cent of providers) at a 35 per cent response rate, though there was no particular pattern to the types of providers that emerged (aside from them generally being large establishments).
What does this mean for Graduate Outcomes users?
Those who work with Graduate Outcomes data need to understand the potential impact of a continuing trend of lower response rates. While users can be assured that the survey team at HESA are still working hard to achieve high response rates, the key-take away message from our study is that a lower response rate to the Graduate Outcomes survey is unlikely to lead to a material change in the estimates for the proportion in highly skilled employment and/or further study among the bulk of providers.
Photo illustration by Justin Morrison/Inside Higher Ed | Remigiusz Gora/iStock/Getty Images
It was legit: She was a beneficiary of the Colorado Re-Engaged Initiative (CORE), which draws on reverse-transfer policies to allow the state’s four-year institutions to award degrees to stopped-out students who have fulfilled the requirements of an associate of general studies degree.
Created by state legislation in 2021, CORE seeks to reduce the share of the 700,000 plus students in the state who have completed some college credits but don’t hold a degree.
“It has always been problematic for me to think that people could have gone three years, three and a half years to college and the highest credential that they have is a high school diploma,” said Angie Paccione, executive director of Colorado’s Department of Higher Education.
For Varkevisser, getting recognized for her years’ worth of credit accumulation was simple; she just had to say yes to the email. “It came out of nowhere, but I have my college degree now,” Varkevisser said.
Colorado isn’t the only state aiming to reduce the millions of individuals who fall in the some college, no degree population in the U.S. And reverse transfer—awarding an associate degree to students who have met the credit threshold—is a relatively simple way to do it, thanks to new technologies and state initiatives to streamline policies.
But one barrier has tripped up colleges for over a decade: working with students to make them aware so they participate in these programs. In Colorado, for example, fewer than 5 percent of eligible students have opted in to CORE.
“I can’t imagine why” a student wouldn’t opt in, Paccione said. “You’ve already paid money; you don’t have to do anything, all you have to do is call [the institution] up and say, ‘Hey, I understand I might be eligible for an associate degree.’ It takes a phone call, essentially.”
Credits but No Credential
In the 2010s, reverse transfer was a popular student success intervention, allowing students who transferred from a two-year to a four-year institution to pass their credits back to their community college to earn a credential.
Experts say awarding an associate degree for credits acquired before a student hits the four-year degree threshold can support their overall success in and after college, because it provides a benchmark of progress. A 2018 report found that most community colleges students who transferred to another institution left their two-year college without a degree, putting them in limbo between programs with credits but no credential.
Now, reverse-transfer policies are being applied to students who have enrolled at a four-year college and left before earning a degree, who often abandon a significant number of credits.
The National Student Clearinghouse Research Center’s latest report on the some college, no credential (SCNC) population found that 7.2 percent of stopped-out students had achieved at least two years’ worth of full-time-equivalent enrollment over the past decade. In other words, 2.6 million individuals in the U.S. have completed two years’ worth of college credits but don’t hold a credential to prove it.
In addition to Colorado, Florida, Maryland, Michigan, Missouri, Oregon and Texas are introducing or modifying policies to award associate degrees to stopped-out students who have earned enough credits. The trend reflects a renewed focus on better serving stopped-out students instead of simply pushing them to re-enroll.
“What’s happening at the national level is that folks are recognizing that we’re still not seeing the completion that we want,” said Wendy Sedlak, the Lumina Foundation’s strategy director for research and evaluation. “It’s taking a long time to make headway, so nationally, people are looking back, and looking into what are those initiatives, what are those policies, what are those practices that have really helped us push ahead?”
Photo illustration by Justin Morrison/Inside Higher Ed | stphillips/iStock/Getty Images
Obstacles to Implementation
Reverse transfer, while simple on paper, faces a variety of hurdles at the state, institutional and individual levels.
At the highest level, most universities cannot award associate degrees due to state legislation. Before CORE, Colorado universities were limited to being “dual mission” (awarding two- and four-year degrees) or awarding higher degrees, such as master’s or doctorates.
There’s also a stigma around offering two-year degrees to students. Only eight universities are participating in CORE, because “some of the institutions don’t want to be associated with an associate degree,” Paccione said. “They pride themselves on the bachelor’s degree and they want to make sure students complete that.”
Critics of reverse transfer claim that awarding students an associate degree if they fail to complete a bachelor’s gives them an incentive to stop out, but most of these programs require students to have left higher education for at least two years to be eligible for reverse transfer.
Restrictions on student eligibility has further limited the number who can benefit from reverse-transfer programs.
To earn an associate degree retroactively through traditional reverse-transfer processes, students have to begin their college journey at a two-year institution and earn at least one-quarter of their credits there. They are also required to take a certain number (typically 60 or more) and type of credits to fulfill requirements for the degree, whether that’s an associate of arts, science or general studies. So a student who completed 59 credits of primarily electives or upper-level credits in their major would not be able to earn the degree, for example.
While 700,000 students in Colorado have earned some college credit but no degree, only about 30,000 residents have earned the minimum 70 credits at a four-year state university within the past 10 years that makes them eligible for CORE, according to the state.
Most colleges require students to opt in to reverse transfer due to FERPA laws, meaning that students need to advocate for receiving their award and facilitate transcript data exchanges between institutions. This can further disadvantage those who are unfamiliar with their college’s bureaucratic processes or the hidden curriculum of higher education.
In addition, getting up-to-date emails, addresses or phone numbers for students who were enrolled nearly a decade ago can be difficult for the institution.
For some students, the opportunity may seem too good to be true.
Peter Fritz, director of student transitions and degree completion initiatives at the Colorado Department of Higher Education, talked to CORE participants at their graduation ceremony in 2023 who—like Varkevisser’s partner—initially thought the program was a scam. Media attention and support from the governor have helped build trust in CORE. And the state’s Education Department continues to affirm messaging that this isn’t a giveaway or a money grab, but recognition of work already completed.
Thousands of Colorado residents are eligible for CORE, but Varkevisser said she hasn’t heard of anyone in her community who’s taken advantage of it. “Actually, I am the one that’s telling everyone I know, and they go, ‘That’s crazy!’”
Photo illustration by Justin Morrison/Inside Higher Ed
Giving Students Degrees
Between CORE’s launch in 2022 and January 2025, 1,032 stopped-out students earned associates degrees, according to Colorado’s education department.
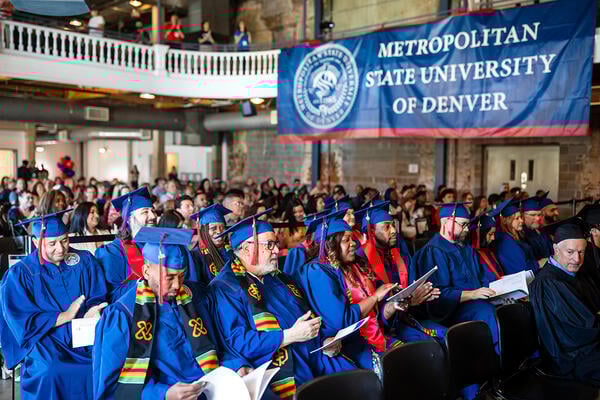
At Metropolitan State University of Denver, one of the Colorado institutions that opted in to CORE, when administrators began combing through institutional data to see which students would be eligible for the associate of general studies degree, they found 4,256 that could earn an A.G.S.
Another few thousand were eligible for a different degree entirely. If students had completed 15 or more credits at the community college system, “you wouldn’t be eligible for us to award you anything,” said Shaun Schafer, associate vice president of curriculum academic effectiveness and policy development. “Guess what? It’s reverse transfer.”
MSU Denver identified nearly 2,000 students who could receive a two-year degree from their community college. “We sent that back to the different institutions saying, ‘Hey, this person is actually eligible to reverse transfer and get an associate’s from you,’” Schafer said. “We can’t really do anything for them.”
In 2024, 336 students accepted an A.G.S. from MSU Denver, just under 9 percent of those eligible. An additional 130 or so students had reached 120 credit hours or more, so the university offered to help them re-enroll to finish their degree, and 300 had resumed coursework at other institutions.
National data shows policies like reverse transfer are making a dent in the “some college no degree” population by eliminating the barrier of re-enrollment to attain a credential. In the past year, about one in four SCNC students who earned a credential in the U.S. (15,500 students in total) did so without re-enrolling, according to National Student Clearinghouse data.
In Colorado, a total of 2,100 SCNC students completed a credential during the 2023–24 academic year alone, and 800 of those did not need to re-enroll, NSC data shows.
Some states, including Colorado, Michigan, Missouri and Oregon, require institutions to contact upward transfer students to make them aware of their reverse-transfer eligibility. In Texas, students consent to participating in reverse transfer when they fill out their application; they have to uncheck the box to opt out, giving universities leeway to enroll them in the process when they become eligible.
“Students often don’t do optional,” Sedlak said. “When you create additional barriers, you’re not going to see things get done.”
Alyson McClaran/MSU Denver
The first Summer Ceremony for Associate’s Degrees on June 22, 2024, in the Tivoli Turnhalle.
Leveraging Tech
Some universities have implemented new reverse transfer policies that capture students while they’re still enrolled, utilizing technology to expedite the process.
The University of Nebraska system, which includes the Lincoln, Omaha and Kearney campuses, implemented an automatically triggered reverse-transfer initiative in 2023. All eligible students need to do is respond to an email.
“Rather than putting the responsibility on the students to do that work—most of whom are not going to do that work—the system thought it would be better to create a mechanism that would automatically notify students when the courses that they’ve taken have gotten to that threshold,” said Amy Goodburn, senior associate vice chancellor at UNL.
To be eligible, students must complete at least 15 credits at a community college and then transfer to the University of Nebraska. The registrar’s office monitors a dashboard and, after confirming a student completed the appropriate number and type of credits for an associate degree, notifies the student. If the student responds to the email, the university processes the reverse transfer with the prior institution to confirm the associate degree.
“We’re trying to take the need for students to be proactive off their backs,” Goodburn said.
The process is not a heavy lift, Goodburn said, and it boosts the community college’s completion rate, making it mutually beneficial.
Still, the uptake remains stubbornly low.
At UNL, February 2025 data showed that 2,500 students were eligible to participate in reverse transfer, but only 10 percent have opted in. A reverse-transfer initiative in Tennessee a decade ago saw similar numbers; 7,500 were eligible, but only 1,755 students chose to participate and 347 degrees were awarded.
“I’m curious about the other 90 percent, like, are they not doing it because they don’t want it on their transcript?” Goodburn said. “Or they’re just not reading their emails, which is often the case? Or is there some other reason?”
The University of Montana is in the early stages of building its own process for the reverse transfer of stopped-out students. The institution has offered an associate of arts degree for years as part of Missoula College, an embedded two-year institution within the university. Now, through the Big Sky Finish initiative, officials will be able to retroactively award degrees to former students.
Brian Reed, the University of Montana’s associate vice president for student success, has been leading the project, convening with stakeholders—including the president, the provost, Missoula College leaders and the registrar’s office—to develop the process. The goal, Reed said, is to address the some college, no degree population while also investing in state goals for economic development.
Big Sky Finish hinges on a partnership with the ed-tech provider EAB, which has created a dashboard connecting various institutional data sets to identify which students are eligible for reverse transfer. The system highlights former students who have 60 credits or more that fulfill a general studies associate degree, as well as stop-outs who are mere credits away from meeting the requirement.
So far, Montana staff have identified just 11 students who are eligible to earn an A.A. degree and 150 more who are a class or two short of the needed credits.
Photo illustration by Justin Morrison/Inside Higher Ed | silverlining56/E+/Getty Images
Putting Degrees to Work
While CORE and similar initiatives are helping students earn a degree of value after leaving higher education, it’s less clear what impact associate degrees are having on students. Is it advancing their careers or getting them re-engaged in college?
About 10 percent of Colorado’s stopped-out students have chosen to re-enroll in higher education to pursue their bachelor’s degree, Fritz said.
For Varkevisser, receiving an A.G.S. degree provided the impetus to re-enroll and work toward a bachelor’s degree. The associate degree also gave her access to a variety of resources for alumni, including discounted tuition rates and career services.
“We recognize that it may not be for everybody to do this as a bachelor’s completion model, but the advantage of having an associate over a high school diploma, I think, helps,” Paccione.
But after students have their degrees, the career benefits and long-term implications for A.G.S. graduates are still murky. Median earnings of full-time, year-round workers with an associate degree are 18 percent higher than those with only a high school diploma, but still 35 percent lower than bachelor’s degree completers, according to the National Center for Education Statistics.
In Colorado, the average high school graduate in their mid-20s will earn about $25,000 per year, whereas a graduate with an associate of general studies degree will earn closer to $34,000 per year, according to 2021 data.
“There was an assumption that maybe an A.G.S. wasn’t really worth much, but the data we had on hand locally said there’s not really much difference financially and employment-wise between the different types of associate degrees,” Fritz said.
“I still don’t really know what all [the A.G.S.] can do for me,” Varkevisser said. “I was never not going to go for it once I got the email and found out it was a real thing, but I don’t know what to do with it necessarily.” She’s considered other forms of employment that require an associate degree, such as a laboratory or X-ray technician, while she finishes her bachelor’s degree in mathematics.
In Montana, there’s a slight wage premium for individuals who hold an associate degree compared to those with only a high school diploma, Reed said. An associate degree also opens doors in some career fields, such as bookkeeping.
The University of Montana is hoping to partner with the city of Missoula to identify small businesses looking for credentialed talent so completers can have a career pathway to transition into .
“I don’t think people are going into six-figure jobs after this,” Reed said. “But it’s creating a step toward something else for these folks. They get another job a little higher up, a little higher up, that prepares them for the next thing.”
But an A.G.S. isn’t a great target for workers and it can’t guarantee further education, MSU Denver’s Schafer noted.
“I hate to say it, but it’s a little bit of, it’s a lovely parting gift,” Schafer said. “Here, you have something that you can now show to the world. But how do I [as an administrator] build you on to the next thing when you’ve already stopped out? Maybe that’s the best hope. Even then, maybe it doesn’t work quite as magically as we want it to.”
For the first time in more than a decade, interest rates across the world are rising from what some say were their lowest levels in 5,000 years.
You heard that right. The idea of lending money — and charging a fee for doing so — is as old as civilisation. Central banks, the institutions now responsible for guiding a country’s rates, are much more recent. Sweden’s Riksbank, in 1668, was the first, closely followed by the Bank of England in 1694.
Don’t worry. This spin through history is meant only to show that interest rates have a long, if not always respected, past.
In our drama-filled present, the world is watching — with interest — where they will go from here.
So why do interest rates matter? And why now, in particular?
Why do interest rates matter?
To vastly oversimplify the argument: lending rates matter because prices matter. And interest rates are the most tried-and-tested tool for keeping prices under control.
Even those who prefer getting their financial advice from TikTok and YouTube, rather than consulting traditional financial institutions, would be hard-pressed to miss the fact that prices for essentials such as food, fuel and cooking oil are rising faster across the industrialized world than they have in decades.
This can be particularly hard for those starting their working lives. Nearly half the Generation Zs and Millennials in a 46-country Deloitte poll said they live paycheque to paycheque. Of the thousands surveyed, nearly one-third (29% of Gen Zs and 36% of Millennials) said inflation was their most pressing worry right now.
The global rise in prices is the result of a perfect storm of factors: among others, a food shortage caused by Russia’s blockade of Ukraine’s ports, soaring energy costs and the effects of droughts, heatwaves and other climate-linked extreme weather on agriculture; a resurgence in consumer buying deferred during COVID-19 lockdowns; and a surge in demand for workers.
And while wages are also rising after years of near dormancy, they are not increasing fast enough to keep pace with prices. So even the most carefully managed household budget is facing new strains.
That’s where interest rates come in.
Slowing inflation without stalling economies
Central banks hope that by making it more expensive to borrow, they can slow the pace of inflation. That they have been able to keep rates at or near zero for so long is because the world was in an extraordinary period of extended price stability.
There is little that even the cleverest economic steward can do to fix the external factors affecting inflation — Ukraine, droughts, labour shortages — but they can try to put the brakes on internal drivers such as consumer demand.
So that’s why rates are increasing in most major economies faster than they have since the latter part of the last century.
The U.S. Federal Reserve, arguably the world’s most powerful central bank, has raised rates three times this year and is expected to increase them again this week. Peers such as the European Central Bank and the Bank of England are following suit, although some are taking a cautious approach because they want to slow their economies without stalling them completely.
The question is: How far will rates rise and how will that affect a global economy that has been buffeted in the past few years by a pandemic, geopolitical turmoil and a supply chain crisis?
Consider hypothetical futures.
Economists say a few possible paths lie before us.
The best-case scenario is what they call a “soft landing”: interest-rate rises could put a quick end to the price spiral without causing a halt or, worse, a reversal in economic growth. When prices stop rising, rates do too.
There are potential pluses for the young in this brightest of hypothetical futures. It could allow wages to catch up with costs, boosting buying power. And if there is a halt or reversal in property prices, they could at last have a chance to buy without having to face cripplingly high mortgage rates.
The second-best scenario is a brief recession that ends quickly and brings with it tamer prices and stable or lower lending rates. See above for benefits.
“I am not confident in the soft-landing scenario,” said Greg McBride, Chief Financial Analyst at Bankrate.com. “A recession is very likely the price to be paid for getting inflation under control. And painful as recessions are — even mild recessions are not fun for anybody — that is medicine we are better off taking now in an effort to get back to price stability.”
If interest rates rise too slowly or not enough, this opens the door to the worst of all possible worlds — a phenomenon known as stagflation.
Stagflation is an ugly thing. Prices soar, economic growth slows and it becomes harder and harder to make ends meet. The fact is that economic growth will slow as rates rise, even in the best of our possible outcomes. But as long as prices follow, we will escape the economic purgatory that big economies faced in the 1970s.
Now is the time for smart financial management.
Whatever future lies ahead, McBride said, the best way to ride it out is to practice sound financial management. That applies whether you are a student, just joining the job market or starting your own business.
“The fundamentals are critically important,” he said. “That is: invest in yourself and your future earning power; watch your expenses; live beneath your means; save and invest the difference; and don’t rely on debt to support your lifestyle if your income cannot.”
This last is particularly important in a time of rising rates.
“There are points in life where you need debt,” he said. “You may need to borrow to get through school. You’re probably going to have to borrow to buy a house.”
But you must never lose sight of “the end game” of paying that debt off, particularly if, as with most credit cards, it carries high or variable interest rates. And don’t borrow for non-essentials.
McBride said: “Leaning against debt, like a crutch to support a lifestyle your income cannot, doesn’t lead anywhere good.”
QUESTIONS TO CONSIDER
1. What is stagflation and why is it the worst-case scenario?
2. How can policymakers tame inflation?
3. How have the prices for food, fuel and other goods changed where you live?
Since hitting a record high in 2022, national chronic absenteeism rates have dropped modestly — by about five percentage points — according to the most recent available data, but still remain persistently higher than pre-pandemic levels.
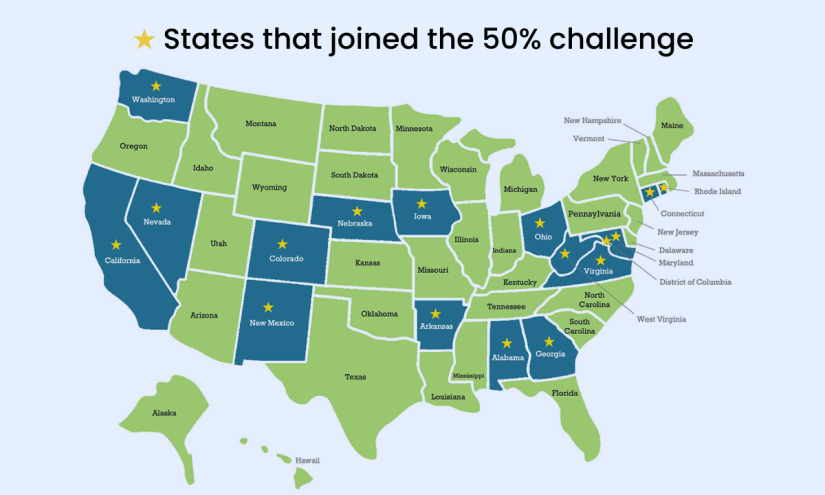
States that joined a national pledge led by three high-profile education advocacy and research groups to cut chronic absenteeism in half over five years fared better. The 16 states and Washington, D.C. posted results “substantially above the average rate” of decline, though exact numbers are not yet available, said Nat Malkus, deputy director of education policy studies at the American Enterprise Institute, one of the trio.
The national chronic absenteeism average dropped from 28.5% in 2022 to 25.4% in 2023, and fell an additional two points to 23.5% in 2024. Virginia, which is among the 16 participating states, cut its chronic absenteeism by 4.4 percentage points, year over year, to 15.7%, as of spring 2024.
Speaking of the states collectively, Malkus told The 74, “That’s good but it’s not as good as we need it to be. I think it points to the need for sustained pressure and a sustained campaign to bring absence rates down and to bring more students back to consistent attendance.”
Last July, AEI and EdTrust, right-and left-leaning think tanks, respectively, and the national nonprofit Attendance Works joined forces to launch The 50% Challenge. This week, the organizations hosted an event in Washington, D.C., to report on their progress, re-up the call to action and hear insights from state, district and community partners on how they are improving student attendance and engagement.
With California and Georgia recently joining, the 16 states and D.C. who signed on to the pledge account for more than a third of all students nationally. While Malkus doesn’t necessarily attribute their better results to the pledge itself, he noted that their participation shows a willingness to commit to the cause and be publicly accountable for their results.
“I will hold their feet to the fire on this goal,” he added during his opening remarks in D.C.
While felt most acutely by students of color and those in poorer districts, the spike in chronic absenteeism — students missing more than 10% of school days a year — cut across districts regardless of size, racial breakdown or income. Chronic absenteeism surged from 13.4% in 2017 to 28.5% in 2022 before beginning to drop in 2023.
Only about one-third of students nationally are in districts that are on pace to cut 2022 absenteeism in half by 2027, according to an AEI report, and rates improved more slowly in 2024 than they did in 2023, “raising the very real possibility that absenteeism rates might never return to pre-pandemic levels.
AEI
Research has shown that students with high rates of absenteeism are more likely to fall behind academically and are at a greater risk of dropping out of school. About 8% of all learning loss from the pandemic is attributed just to chronic absenteeism, according to soon-to-be-released AEI research.
The continued disproportionate impacts of chronic absenteeism were confirmed by recent RAND research, which found that in roughly half of urban school districts, more than 30% of students were chronically absent — a far higher share of students than in rural or suburban school districts.
RAND also found that the most commonly reported reason for missing school was sickness and one-quarter of kids did not think that being chronically absent was a problem.
SchoolStatus, a private company that works with districts to reduce chronic absenteeism, also released new numbers this week for some 1.3 million K-12 students across 172 districts in nine states. Districts using proactive interventions, the company reports, drove down chronic absenteeism rates from 21.9% in 2023–24 to 20.9% in 2024–25.
At this week’s event, numerous experts across two panels emphasized the importance of a tiered approach to confronting the issue, which has resisted various remedies. Schools must build enough trust and buy-in with kids and their families that they are willing to share why they are absent in the first place. Once those root causes are identified, it is up to school, district and state leaders to work to remove the barriers.
And while data monitoring must play a significant role, it should be done in a way that is inclusive of families.
“We need to analyze data with families, not at them,” said Augustus Mays, EdTrust’s vice president of partnerships and engagement.
Augustus Mays is the vice president of partnerships and engagement at EdTrust. (EdTrust)
It’s imperative to understand the individual child beyond the number they represent and to design attendance plans and strategies with families so they feel supported rather than chastised.
“It’s around choosing belonging over punitive punishment,” Mays added.
One major and common mistake schools make is “accountability without relationships,” said Sonja Brookins Santelises, the superintendent of Baltimore City Public Schools.
“You can’t ‘pull people up’ if you don’t have enough knowledge of what they’re really going through,” she said.
Panelists were transparent that all this would require immense funding, staff and community partnerships.
Virginia achieved its noteworthy drop in chronic absenteeism after launching a $418 million education initiative in the fall of 2023, in part after seeing their attendance data sink, with about 1 in 5 students chronically missing school. At least 10% of those funds are earmarked to prioritize attendance solutions in particular, according to panelist Emily Anne Gullickson, the superintendent of public instruction for the Virginia Department of Education.
These strategies are far-reaching, she noted: Because parents had been told throughout the pandemic to keep their kids home at the slightest sign of illness, schools partnered with pediatricians and school nurses to help counter the no-longer-necessary “stay home” narrative.
Hedy Chang is the founder and executive director of Attendance Works. (Attendance Works)
Gullickson said she also broke down bureaucratic silos, connecting transportation directors and attendance directors, after realizing the role that transit played in chronic absenteeism. The state now has second chance buses as well as walking and biking “buses,” led by parents or teachers along a fixed route, who pick up students along the way.
And they are “on a mission to move away from seat time and really deliver more flexibility on where, when and how kids are learning,” she said.
“This isn’t one strategy. It’s a set of strategies,” said Attendance Works founder and executive director Hedy Chang, who moderated the panel.
In Connecticut, state leaders have launched the Learning Engagement and Attendance Program, a research-based model that sends trained support staff to families’ homes to build relationships and better understand why their kids are missing school.
Charlene Russell-Tucker is the commissioner of the Connecticut State Department of Education. (Connecticut State Department of Education)
A recent study confirmed that six months after the program’s first home visits, attendance rates improved by approximately 10 percentage points for K-8 students, and nearly 16 percentage points for high schoolers, said Charlene Russell-Tucker, the commissioner of the Connecticut State Department of Education.
Schools must also work to motivate kids to want to show up in the first place, panelists said, making it a meaningful place that students believe will support and help them in the long run. The only way to do this is to start with student and family feedback, said Brookins, the Baltimore schools chief.
During the pandemic many parents saw up-close for the first time what their kids’ classrooms and teacher interactions looked like, “and I don’t think a lot of folks liked what they saw for a variety of different reasons,” Brookins said.
“I think it opened up boxes of questions that we — as the education establishment — were unprepared to answer,” she added. But chronic absenteeism cannot be successfully fought without engaging in those uncomfortable conversations.
Disclosure: The Bill & Melinda Gates Foundation provides financial support to EdTrust and The 74.
College Possible’s latest alumni survey shows strong outcomes for participants in its coaching program, including a 93 percent five-year graduation rate for those who attended a four-year college and high rates of employment and job satisfaction.
According to the report, which is based on a survey of 1,300 of the college access nonprofit’s more than 100,000 graduates, 95 percent are employed, 83 percent are employed full-time and more than four in five respondents said they felt fulfilled by their jobs.
The salaries of College Possible graduates are also high, with half reporting salaries over $60,000. The median salary for those working in STEM fields is $101,650, while those in non-STEM careers made a median income of $46,680. Sixty-eight percent of respondents indicated they feel at least somewhat financially secure.
The report also highlights that most of College Possible’s graduates say they benefited significantly from the coaching program, with nine in 10 saying they would recommend College Possible to others and 17 percent returning to coach other students or work for the organization in another capacity.
Autistic college students are experiencing anxiety and depression at significantly higher rates than their non-autistic peers, according to new research from Binghamton University that analyzed data from nearly 150,000 undergraduate students across 342 institutions nationwide.
The study, published in the Journal of Autism and Developmental Disorders, represents one of the most comprehensive examinations to date of mental health challenges facing autistic students in higher education—a population that researchers say has been historically underrepresented in academic research despite growing enrollment numbers.
“What we found is really staggering—autistic individuals endorse much higher rates of anxiety and depression compared to their non-autistic peers,” said Diego Aragon-Guevara, the study’s lead author and a PhD student in psychology at Binghamton University.
The research team analyzed data from the National Survey of Student Engagement (NSSE), which in 2021 became the first year that autism was included as an endorsable category in the survey. This milestone allowed researchers to conduct the first large-scale comparison of mental health outcomes between autistic and non-autistic college students.
“We were really excited to see what the data would tell us. It was a big opportunity to be able to do this,” said Dr. Jennifer Gillis Mattson, professor of psychology and co-director of the Institute for Child Development at Binghamton University, who co-authored the study.
The findings come at a critical time for higher education institutions as autism diagnoses continue to rise nationwide and more autistic students pursue college degrees. The research highlights a significant gap in support services that could impact student success and retention.
“We know the number of autistic college students continues to increase every single year,” Gillis-Mattson noted. “We really do have an obligation to support these students, and to know how best to support these students, we need to look beyond just autism.”
The study reveals that campus support systems may be inadvertently overlooking mental health needs while focusing primarily on autism-specific accommodations. Aragon-Guevara, whose research focuses on improving quality of life for autistic adults, said this represents a critical oversight in student services.
“Support personnel might address an individual’s autism and, in the process, overlook their mental health issues,” he explained. “More care needs to be put into addressing that nuance.”
The research underscores the need for institutions to develop more comprehensive support frameworks that address both autism-related needs and concurrent mental health challenges. The findings suggest that traditional disability services approaches may need significant enhancement to serve this population effectively.
“We want to provide the best support for them and to make sure that they have a college experience where they get a lot out of it, but also feel comfortable,” Aragon-Guevara said.
Dr. Hyejung Kim, an assistant professor in Binghamton’s Department of Teaching, Learning and Educational Leadership, noted that the complexity of factors affecting autistic students requires deeper investigation.
“This population often skews male, and interactions between personal factors and conditions such as anxiety and depression may shape overall well-being in college,” she said.
Kim also pointed to additional considerations that institutions should examine.
“Autistic students are also more likely to pursue STEM fields, and many report different experiences with faculty and staff across institutional settings,” she said. “We still have much to learn about how these and other contextual factors relate to mental well-being.”
The Binghamton team views this study as foundational research that confirms the scope of mental health challenges among autistic college students. Their next phase will investigate specific contributing factors, including social dynamics, faculty support, campus accessibility, and other environmental elements that influence student well-being.
“There are so many elements that go into being comfortable in the new environment that is college,” Aragon-Guevara explained. “We want to look into that and see if there are any deficits in those areas that autistic college students are experiencing, so that we know where we can help support them, or create institutional things to help improve quality of life as a whole.”
The research is part of a broader effort at Binghamton to better understand and support autistic students in higher education, with plans to collaborate with campus partners to develop targeted interventions based on their findings.
The researchers aimed to show demographic changes across the entire “admissions pipeline.”
skynesher/E+/Getty Images
In the wake of the Supreme Court’s 2023 decision to ban affirmative action in college admissions, no one knew exactly what the impact on Black and Hispanic enrollment might be going forward. In fall 2024, the numbers varied substantially by institution; Inside Higher Ed’s analysis of 31 institutions’ enrollment data showed massive drops in Black and Hispanic enrollment at some institutions and less drastic decreases—and even slight increases—at others.
But enrollment data only tells part of the story. A new report from the Urban Institute, which uses data from 18 colleges and universities, highlights how the demographics of college applicants—and admits—shifted after the court’s decision in Students for Fair Admissions v. Harvard and the University of North Carolina at Chapel Hill. While the share of applicants who were Black or Hispanic increased from fall 2023 to fall 2024—by 0.47 and 0.65 percentage points, respectively—the portion who were admitted decreased.
It marked the first time since at least 2018 that the share of admitted students who were Black had declined; Hispanic students hadn’t seen a drop since 2021, when the share of applicants also declined. White students’ share of applicants, admitted students and enrolled students has shrunk every year since 2018, a trend consistent with the declining number of white high school graduates (and of white Americans in general). White graduates are also the only group that consistently make up a larger percentage of admitted students than applicants.
Jason Cohn, a higher education and workforce research associate for the Urban Institute and one of the report’s authors, said that these numbers shed more light on the impacts of affirmative action than enrollment figures alone.
“We’ve seen a lot of enrollment numbers in news articles here and there since last fall. In some cases, they stay the same; in some cases, they change. But I think what these data are showing is that that’s not fully reflective of what might actually be happening,” he said. “One of the big takeaways for me is just how much can be hidden if you only look at the enrollment numbers and aren’t seeing what’s happening in the rest of the admissions pipeline.”
For this study, the researchers partnered with two organizations, the Association of Undergraduate Education at Research Universities and the University of Southern California’s Center for Enrollment Research, Policy and Practice, to solicit data from a diverse group of 18 research universities (which they did not name). Although the sample is small, they said, it’s consistent with similar research conducted by the College Board, whose sample included about 60 institutions, indicating that the data is likely reflective of broader trends.
It’s difficult to say definitively that the Supreme Court’s decision caused the decline in the share of admitted students from underrepresented backgrounds. That same class of high school seniors faced other barriers, including the lingering effects of the COVID-19 pandemic and delays and errors with the Free Application for Federal Student Aid. Bryan J. Cook, another author of the report and the Urban Institute’s director of higher education policy, noted that colleges in some states had begun rolling back diversity, equity and inclusion efforts at that time, including some programs aimed at recruiting students of color.
“In this particular analysis, we’re not looking to isolate causation, but I think as we continue to look at this type of thing in future years, I think that’ll help us get a little closer,” Cohn said.
But Robert Massa, a veteran enrollment professional, said he believes the shifts were likely caused in large part by the end of affirmative action.
“I’m not at all surprised that Black students have increased their representation in the applicant pool and decreased their representation in the accepted pool, because universities are taking careful steps to make sure they don’t use race in and of itself as criteria in the admissions process,” he said.
(Edward Blum, the president of SFFA, the anti–affirmative action nonprofit that was the plaintiff in the Supreme Court case, told Inside Higher Ed in an email that the organization has no opinion on the study.)
The researchers plan to dig deeper into the data, analyzing other demographic information, including gender and family income, as well as academic variables such as the standardized test scores and grade point averages of the applicants and admitted students at these institutions.
One possible hiccup for future research: The report also showed that post-SFFA, the share of applicants who chose not to identify their race increased, from 3.2 percent in 2023 to 5.1 percent in 2024. If that upward trend continues, Cohn said, it might make it “more difficult, over time, to unpack these trends and see who’s being served by the higher education system.”